

Single-cell dissection of Merkel cell carcinoma heterogeneity unveils transcriptomic plasticity and therapeutic vulnerabilities
- PMID: 37421947
- PMCID: PMC10394170
- DOI: 10.1016/j.xcrm.2023.101101
Single-cell dissection of Merkel cell carcinoma heterogeneity unveils transcriptomic plasticity and therapeutic vulnerabilities
Abstract
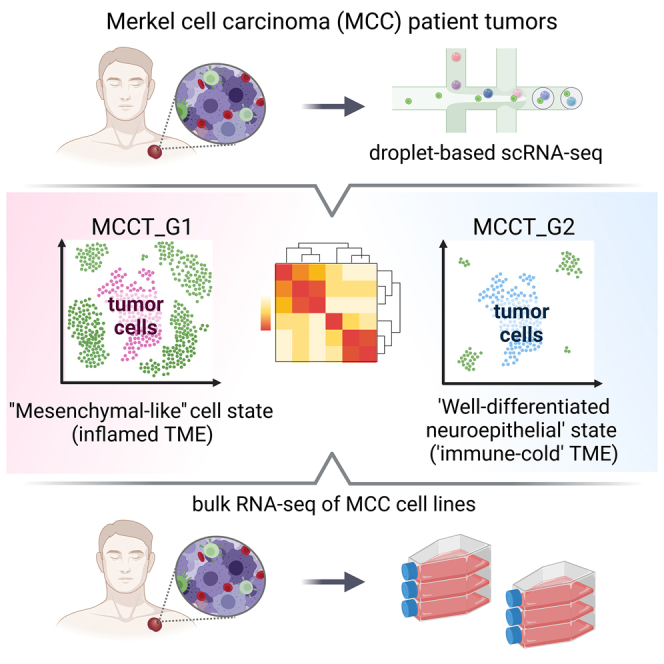
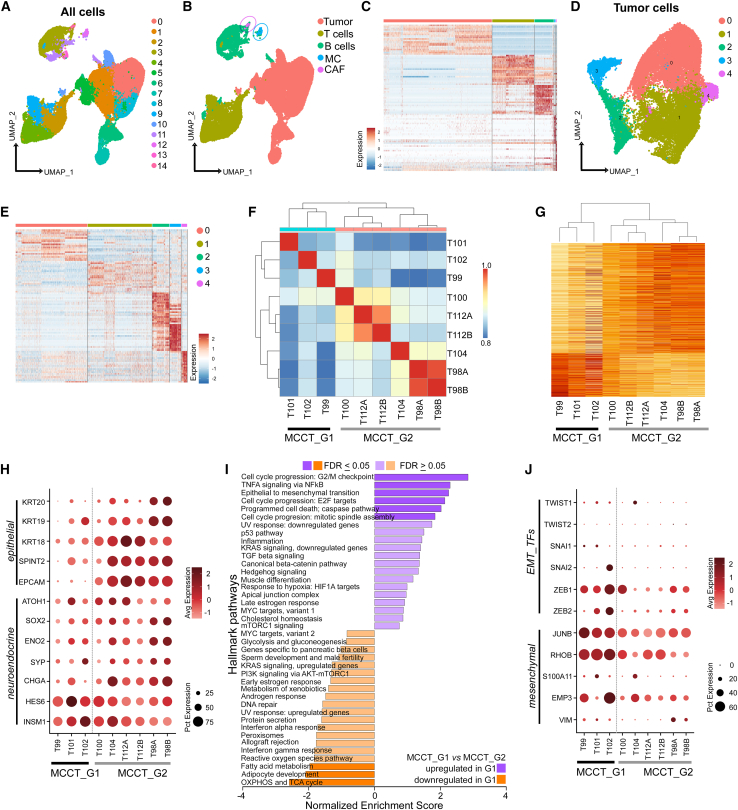
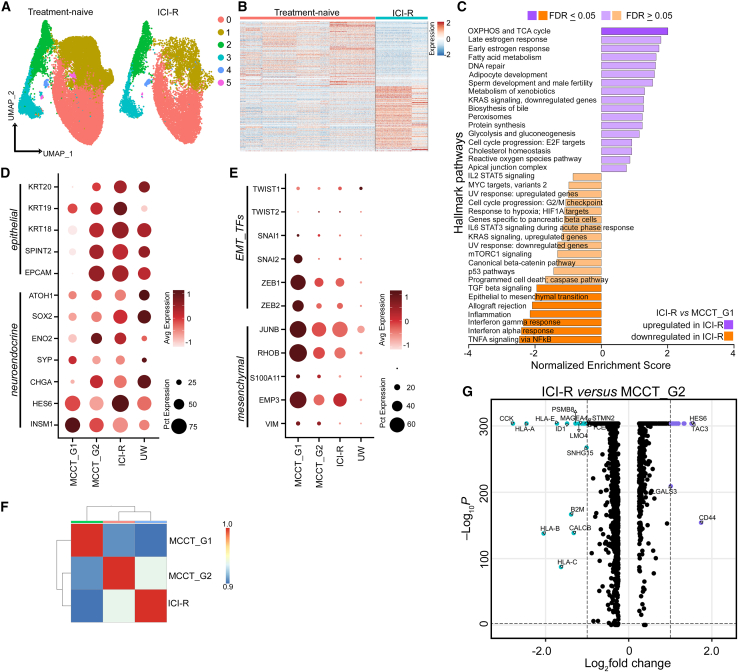
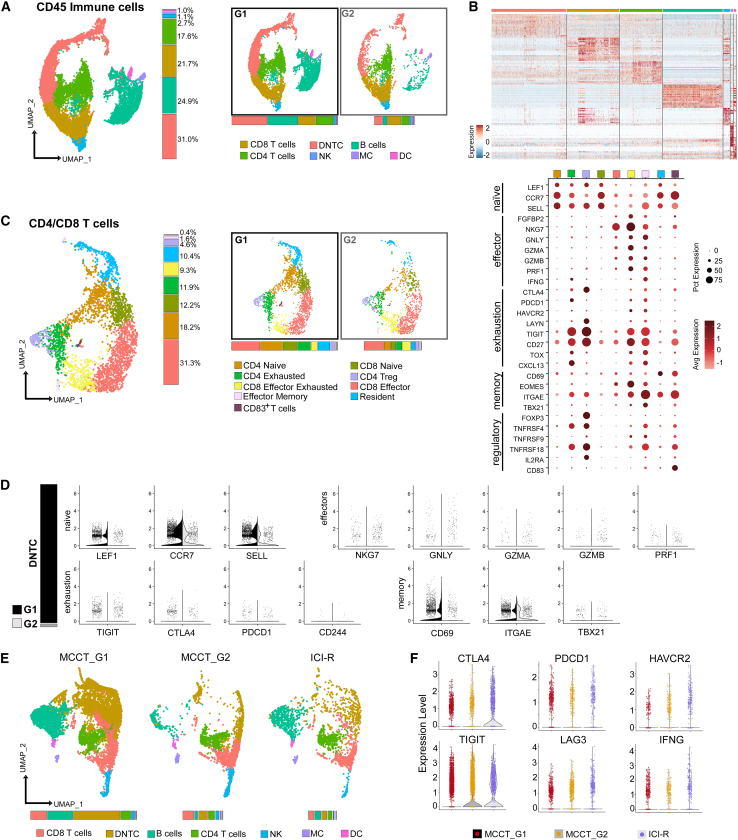
Merkel cell carcinoma (MCC), a rare but aggressive skin cancer, remains a challenge in the era of precision medicine. Immune checkpoint inhibitors (ICIs), the only approved therapy for advanced MCC, are impeded by high primary and acquired resistance. Hence, we dissect transcriptomic heterogeneity at single-cell resolution in a panel of patient tumors, revealing phenotypic plasticity in a subset of treatment-naive MCC. The tumor cells in a "mesenchymal-like" state are endowed with an inflamed phenotype that portends a better ICI response. This observation is also validated in the largest whole transcriptomic dataset available from MCC patient tumors. In contrast, ICI-resistant tumors predominantly express neuroepithelial markers in a well-differentiated state with "immune-cold" landscape. Importantly, a subtle shift to "mesenchymal-like" state reverts copanlisib resistance in primary MCC cells, highlighting potential strategies in patient stratification for therapeutics to harness tumor cell plasticity, augment treatment efficacy, and avert resistance.
Keywords: Merkel cell carcinoma; cellular plasticity; copanlisib; epigenetics; immunotherapy resistance; neuroendocrine carcinoma; single cell RNA-seq; skin cancer; tumor cell state; tumor heterogeneity.
Published by Elsevier Inc.
Conflict of interest statement
Declaration of interests The authors declare no competing interests.
Figures
Similar articles
-
The Genomic Landscape of Merkel Cell Carcinoma and Clinicogenomic Biomarkers of Response to Immune Checkpoint Inhibitor Therapy.Clin Cancer Res. 2019 Oct 1;25(19):5961-5971. doi: 10.1158/1078-0432.CCR-18-4159. Epub 2019 Aug 9. Clin Cancer Res. 2019. PMID: 31399473 Free PMC article.
-
The HDAC Inhibitor Domatinostat Promotes Cell-Cycle Arrest, Induces Apoptosis, and Increases Immunogenicity of Merkel Cell Carcinoma Cells.J Invest Dermatol. 2021 Apr;141(4):903-912.e4. doi: 10.1016/j.jid.2020.08.023. Epub 2020 Sep 28. J Invest Dermatol. 2021. PMID: 33002502 Free PMC article.
-
Response durability after cessation of immune checkpoint inhibitors in patients with metastatic Merkel cell carcinoma: a retrospective multicenter DeCOG study.Cancer Immunol Immunother. 2021 Nov;70(11):3313-3322. doi: 10.1007/s00262-021-02925-4. Epub 2021 Apr 18. Cancer Immunol Immunother. 2021. PMID: 33870464 Free PMC article.
-
Immunotherapy for Merkel Cell Carcinoma.Curr Treat Options Oncol. 2018 Sep 20;19(11):57. doi: 10.1007/s11864-018-0574-5. Curr Treat Options Oncol. 2018. PMID: 30238195 Review.
-
Recent Therapeutic Advances and Change in Treatment Paradigm of Patients with Merkel Cell Carcinoma.Oncologist. 2019 Oct;24(10):1375-1383. doi: 10.1634/theoncologist.2018-0718. Epub 2019 Apr 8. Oncologist. 2019. PMID: 30962295 Free PMC article. Review.
Cited by
-
Delta-catenin is required for cell proliferation in virus positive Merkel cell carcinoma cell lines but not in human fibroblasts.bioRxiv [Preprint]. 2025 Mar 14:2025.03.12.642815. doi: 10.1101/2025.03.12.642815. bioRxiv. 2025. Update in: mBio. 2025 Jun 11;16(6):e0083225. doi: 10.1128/mbio.00832-25. PMID: 40161767 Free PMC article. Updated. Preprint.
-
Functional Characterisation of the ATOH1 Molecular Subtype Indicates a Pro-Metastatic Role in Small Cell Lung Cancer.bioRxiv [Preprint]. 2024 Feb 17:2024.02.16.580247. doi: 10.1101/2024.02.16.580247. bioRxiv. 2024. Update in: Cell Rep. 2025 May 27;44(5):115603. doi: 10.1016/j.celrep.2025.115603. PMID: 38405859 Free PMC article. Updated. Preprint.
-
Herpesviruses mimic zygotic genome activation to promote viral replication.Nat Commun. 2025 Jan 16;16(1):710. doi: 10.1038/s41467-025-55928-5. Nat Commun. 2025. PMID: 39814710 Free PMC article.
-
Functional characterization of the ATOH1 molecular subtype indicates a pro-metastatic role in small cell lung cancer.Cell Rep. 2025 May 27;44(5):115603. doi: 10.1016/j.celrep.2025.115603. Epub 2025 Apr 29. Cell Rep. 2025. PMID: 40305287 Free PMC article.
-
Spatially organized inflammatory myeloid-CD8+ T cell aggregates linked to Merkel-cell Polyomavirus driven Reorganization of the Tumor Microenvironment.bioRxiv [Preprint]. 2025 Jun 6:2025.06.06.657162. doi: 10.1101/2025.06.06.657162. bioRxiv. 2025. PMID: 40501860 Free PMC article. Preprint.
References
-
- Harms P.W., Harms K.L., Moore P.S., DeCaprio J.A., Nghiem P., Wong M.K.K., Brownell I., International Workshop on Merkel Cell Carcinoma Research IWMCC Working Group The biology and treatment of Merkel cell carcinoma: current understanding and research priorities. Nat. Rev. Clin. Oncol. 2018;15:763–776. doi: 10.1038/s41571-018-0103-2. - DOI - PMC - PubMed
-
- D'Angelo S.P., Lebbé C., Mortier L., Brohl A.S., Fazio N., Grob J.J., Prinzi N., Hanna G.J., Hassel J.C., Kiecker F., et al. First-line avelumab in a cohort of 116 patients with metastatic Merkel cell carcinoma (JAVELIN Merkel 200): primary and biomarker analyses of a phase II study. J. Immunother. Cancer. 2021;9 doi: 10.1136/jitc-2021-002646. - DOI - PMC - PubMed
-
- Knepper T.C., Montesion M., Russell J.S., Sokol E.S., Frampton G.M., Miller V.A., Albacker L.A., McLeod H.L., Eroglu Z., Khushalani N.I., et al. The Genomic Landscape of Merkel Cell Carcinoma and Clinicogenomic Biomarkers of Response to Immune Checkpoint Inhibitor Therapy. Clin. Cancer Res. 2019;25:5961–5971. doi: 10.1158/1078-0432.Ccr-18-4159. - DOI - PMC - PubMed
Publication types
MeSH terms
Grants and funding
LinkOut - more resources
Full Text Sources
Medical
Molecular Biology Databases
