. 2023 Aug 3;110(8):1356-1376.
doi: 10.1016/j.ajhg.2023.06.008. Epub 2023 Jul 7.

Stretch-activated ion channel TMEM63B associates with developmental and epileptic encephalopathies and progressive neurodegeneration

Collaborators, Affiliations

Stretch-activated ion channel TMEM63B associates with developmental and epileptic encephalopathies and progressive neurodegeneration

Annalisa Vetro et al. Am J Hum Genet. .

Abstract

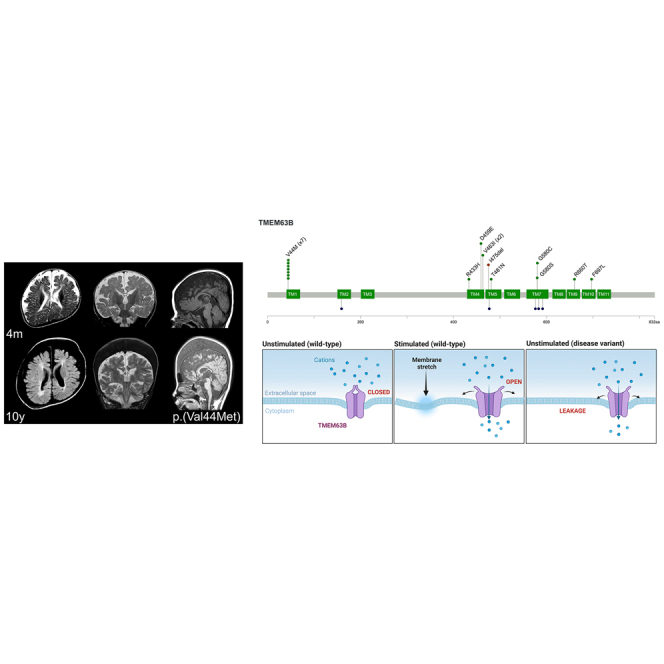
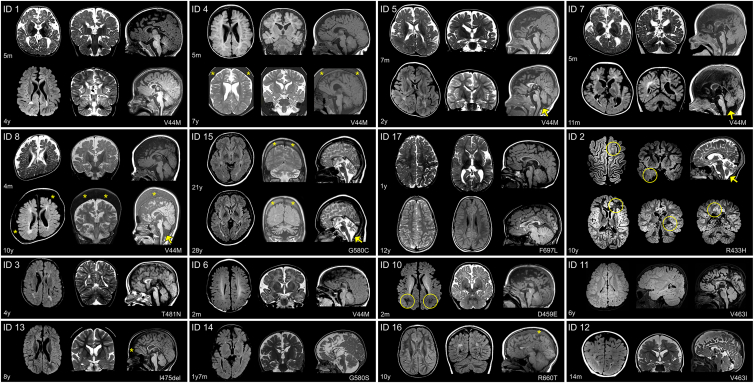
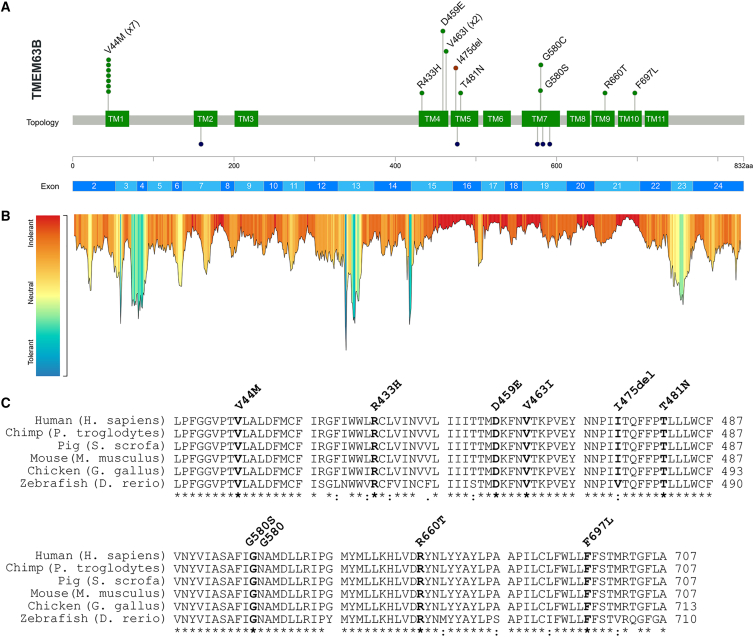
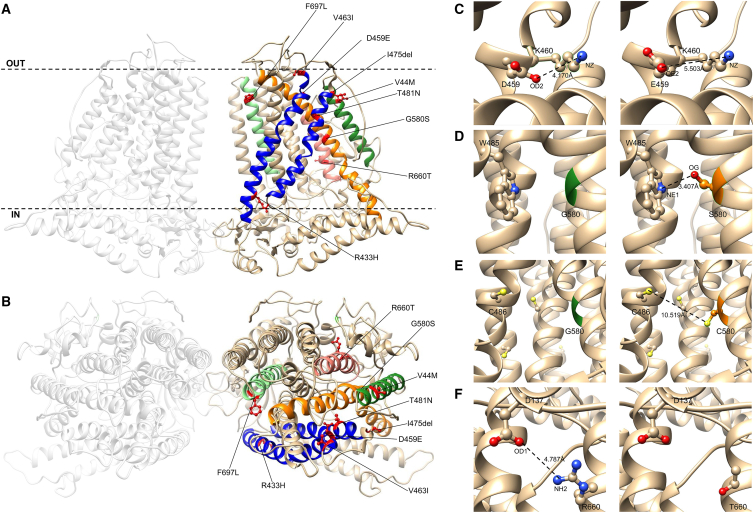
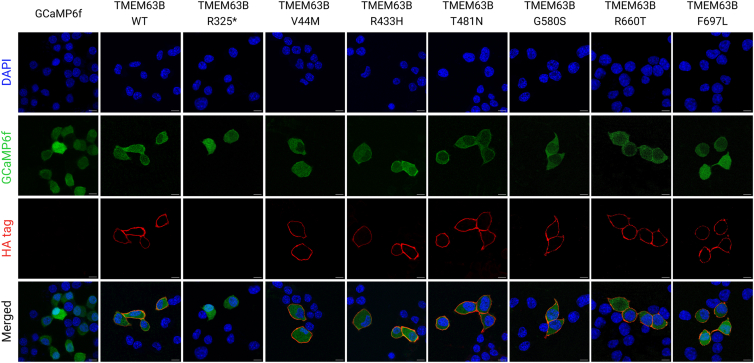
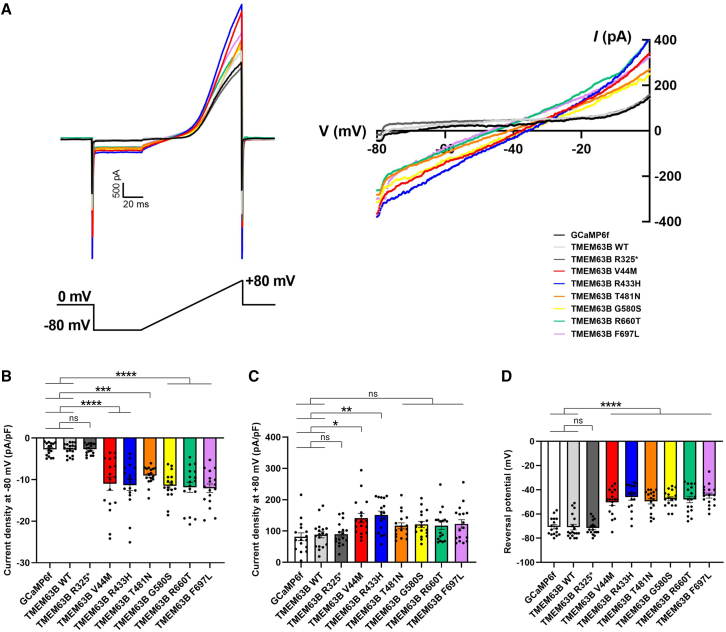
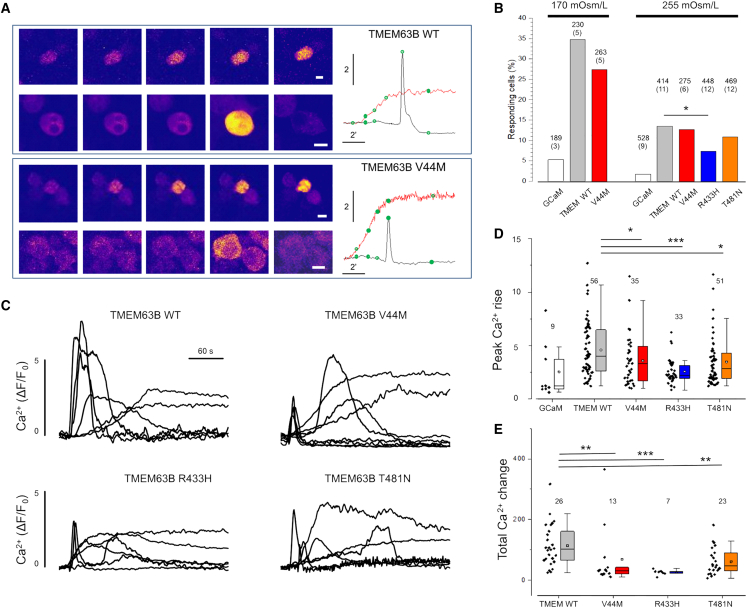
By converting physical forces into electrical signals or triggering intracellular cascades, stretch-activated ion channels allow the cell to respond to osmotic and mechanical stress. Knowledge of the pathophysiological mechanisms underlying associations of stretch-activated ion channels with human disease is limited. Here, we describe 17 unrelated individuals with severe early-onset developmental and epileptic encephalopathy (DEE), intellectual disability, and severe motor and cortical visual impairment associated with progressive neurodegenerative brain changes carrying ten distinct heterozygous variants of TMEM63B, encoding for a highly conserved stretch-activated ion channel. The variants occurred de novo in 16/17 individuals for whom parental DNA was available and either missense, including the recurrent p.Val44Met in 7/17 individuals, or in-frame, all affecting conserved residues located in transmembrane regions of the protein. In 12 individuals, hematological abnormalities co-occurred, such as macrocytosis and hemolysis, requiring blood transfusions in some. We modeled six variants (p.Val44Met, p.Arg433His, p.Thr481Asn, p.Gly580Ser, p.Arg660Thr, and p.Phe697Leu), each affecting a distinct transmembrane domain of the channel, in transfected Neuro2a cells and demonstrated inward leak cation currents across the mutated channel even in isotonic conditions, while the response to hypo-osmotic challenge was impaired, as were the Ca2+ transients generated under hypo-osmotic stimulation. Ectopic expression of the p.Val44Met and p.Gly580Cys variants in Drosophila resulted in early death. TMEM63B-associated DEE represents a recognizable clinicopathological entity in which altered cation conductivity results in a severe neurological phenotype with progressive brain damage and early-onset epilepsy associated with hematological abnormalities in most individuals.

Keywords: abnormal myelination; epilepsy; epileptic encephalopathy; hemolytic anemia; infantile spasms; ion channels; leak cation currents; osmotic stress; white matter abnormality.


Conflict of interest statement

Declaration of interests The authors have declared that no conflict of interest exists.

Figures

None
Graphical abstract
Figure 1
Figure 1
Brain MRI in 16 individuals with TMEM63B pathogenic variants Individuals’ ID is shown in the upper left corner. For each individual, the corresponding TMEM63B variant is reported in the lower right corner. For IDs 1, 4, 5, 7, 8, 15, and 17, two sets of comparative images are presented, taken respectively from the initial and follow-up investigation. For IDs 2, 3, 6, 10, 11–14, and 16, only one set of images is presented. For ID 2 we included additional images, illustrating suspected areas of focal cortical dysplasia (circles). Structural abnormalities include a combination of white matter (WM) abnormalities, dysmorphic lateral ventricles, thinning of corpus callosum (CC), and cortical and cerebellar atrophy that are variably distributed. In ID 1, MRI at age 5 months shows increased extracerebral spaces with enlarged cortical sulci, thin CC with colpocephaly, and high signal intensity of the hemispheric WM, consistent with abnormal myelination. At age 4, enlarged extracerebral spaces and thinning of the CC are less prominent but there is a definite high signal abnormality of the WM, with dysmorphic lateral ventricles, and mild atrophy of the cerebellar cortex. In ID 4, after a first MRI at age 5 months only showing reduced volume of the frontal lobes, a follow-up scan at 7 years revealed a progressive change in shape of the lateral ventricles and CC, revealing WM suffering with mild atrophy of the cerebellar cortex. In IDs 5 and 8, changes that occurred from age 7 months to age 2 years (ID 5) and from age 4 months to 10 years (ID 8) are comparable with those observed in ID 1. The abnormal ventricular shape causes ventricular asymmetry in these individuals. Cerebellar atrophy is indicated by arrows. In ID 7, a second MRI at age 11 months confirms the severe WM abnormality with dilated ventricles and thin CC and reveals mild progressive cerebellar atrophy (arrow). In ID 15, imaged twice 7 years apart, MRI shows as WM changes and cerebellar atrophy continued to progress after age 21 (arrow). In ID 17, only minor changes occurred between age 1 year and 12 years. At 1 year, there were areas of abnormal myelination, especially on the right hemisphere, with thin CC and colpocephaly. At age 12, the CC remained thin but because of maturation processes was thicker than before and ventricular dilatation less prominent, with mild peritrigonal high signal intensity. In ID 2, brain MRI taken at 10 years shows bilateral patchy WM abnormalities highlighted by a circle in the left frontal and right temporal regions. This finding, in association with focal seizures, had raised the suspicion of areas of focal cortical dysplasia. Additional findings include ventricular asymmetry, thin CC, and progressive cerebellar atrophy. In ID 3, imaged at 4 years, there are multifocal high signal WM changes with dysmorphic and asymmetric lateral ventricles, thin CC, and enlarged cortical sulci. IDs 6 and 10, both imaged at age 2 months, exhibited increased extracerebral spaces with enlarged sulci, thin CC, and reduced signal intensity of the WM, consistent with abnormal myelination (ID 10, circles). In ID 11, at age 6 years, there were multifocal areas of WM abnormalities without atrophic changes. In ID 12, at age 14 months, there is already an obvious combination of dilated extracerebral spaces and ventricles with thin CC and high signal abnormality in the posterior WM. IDs 13, 14, and 16 imaged between 1 year 7 months and 10 years show similar findings, slightly varying in severity and including a thin CC, areas of abnormal signal intensity of the WM with posterior predominance in all, dilated asymmetric ventricles (IDs 13 and 14), and mild cerebellar atrophy (ID 14). In IDs 4, 8, 13, 15, and 16, thickening of the trabecular (spongy) bone of the skull (indicated by the asterisks) is suggestive of a blood disorder.
Figure 2
Figure 2
Genetic results (A) The lollipop diagram shows the distribution of the TMEM63B variants observed in our cohort on the linear protein map and relative to the TMEM63B exons (top, based on NM_018426.3 reference sequence). The variants are represented as green (missense substitutions) or brown (in-frame deletion) dots and all map in the transmembrane helices TM1, TM4–7, and TM9–10 (green boxes). The p.Val44Met (V44M) and the p.Val463I (V463I) are recurrent in seven and two individuals, respectively, as illustrated by the number of green dots. At the bottom of the diagram, the dark blue dots represent the residues affected by missense variants in TMEM63A (five variants in six unrelated individuals: p.Gly168Glu [G168E], p.Ile462Asn [I462N], p.Gly553Val [G553V], p.Tyr559His [Y559H], p.Gly567Ser [G567S]).,, (B) Tolerance landscape plot of the TMEM63B protein provided by the MetaDome web server (https://stuart.radboudumc.nl/metadome/). The tool identifies regions of low tolerance to missense variations based on the local non-synonymous over synonymous variants ratio from gnomAD. All variants in our cohort are contained in intolerant/highly intolerant regions (in red) of the landscape. (C) Multiple sequence alignment shows the protein sequence of the human TMEM63B protein (NP_060896.1) and of its orthologs in five different vertebrate species (Pan troglodytes, Sus scrofa, Mus musculus, Gallus gallus, Danio rerio) with the mutated residues in bold. The details of the TMEM63B variants in the cohort are displayed above the alignments. The asterisk below the sequence indicates positions that have a single, fully conserved residue between all the input sequences, the colon indicates conservation between groups of strongly similar properties, and the period indicates conservation between groups of weakly similar properties.
Figure 3
Figure 3
Structural consideration of TMEM63B pathogenic variants (A and B) View of the predicted tridimensional protein structure of TMEM63B from the membrane plane (A) and the extracellular side (B). All the variants in our cohort map into a transmembrane (TM) helix: p.Val44Met (V44M) in TM1 (dark green helix), p.Arg433His (R433H), p.Asp459Glu (D459E), p.Val463Ile (V463I), p.Ile475del (I475del), and p.Thr481Asn (T481N) in TM4 and TM5 (blue helices), p.Gly580Ser (G580S) in TM7 (orange helix), p.Arg660Thr (R660T) in TM8 (pink helix), and p.Phe697Leu (F697L) in TM9 (light green helix). Dotted line in (A) indicates the plasma membrane, OUT the extracellular side and IN the intracellular (cytoplasmic) side. Details of selected variants are provided in the inlets. (C) Predicted structural change induced by the D459E substitution. The OD2 atom of Asp459 is predicted to form a buried salt bridge with NZ atom of Lys460 (K460). The substitution of an aspartic acid with a glutamic acid at position 459 increases the distance between the NZ atom of Lys460 and the closer oxygen atom (OE2) available to make a salt bridge, breaking this bond. (D) Predicted structural change induced by the G580S substitution. The substitution of a glycine (green) with a bulkier amino acid (serine, orange) changes the RSA of the amino acid at position 580 (5.9%–3.8%). In addition, OG atom of Ser580 might form a salt bridge with NE1 atom of Trp485 (W485) and help in stabilizing the structure of the pore. (E) Predicted structural change induced by the G580C substitution. The substitution of a glycine (green) with a bulkier amino acid (cysteine, orange) changes the RSA of the amino acid at position 580 (5.9%–3.7%). Although the substitution introduces an amino acid with a free SH group that can make disulphide bonds with other amino acids with free SH groups (depicted as yellow spheres), the distance between C580 and the closer amino acid with a free SH group (C486, 10.519 Å) is too big to allow the making of such type of bond. (F) Predicted structural change induced by the R660T substitution. The substitution of a buried charged residue (arginine) with an uncharged residue (threonine) at position 660 disrupts a salt bridge formed by NH2 atom of Arg660 and Asp137 (D137).
Figure 4
Figure 4
Immunocytochemistry to assess TMEM63B localization at the plasma membrane Confocal microscopy photographs of Neuro2A cells transfected with GCaMP6f empty vector, TMEM63B WT, or mutant plasmids and analyzed 48 h post-transfection. Transfected cells express the GCaMP6f protein, which fluoresces in the green channel. Cells were stained with primary anti-HA tag antibody, secondary Alexa Fluor 555 antibody, and DAPI. Scale bar = 10 μm.
Figure 5
Figure 5
Electrophysiological recordings on transfected Neuro2A cells (A) Left: representative raw traces of TMEM63B-mediated currents registered under isotonic condition in Neuro2A cells transfected with GCaMP6f, TMEM63B WT, or mutant plasmids. Cells were held at 0 mV and recorded with a ramp protocol from −80 mV to +80 mV, 100 ms duration, 0.1 Hz. Right: current-voltage (I/V) relationship showing variant-induced change in reversal potential. (B and C) Quantification of whole-cell current density at −80mV (B) and +80mV (C) (GCaMP6f = 16 cells, TMEM63B WT = 18 cells, TMEM63B R325, V44M, R433H, T481N, G580S, R660T, and F697L = 17 cells; ∗∗∗∗p < 0.0001, ∗∗∗p < 0.001, ∗∗p < 0.01, p < 0.05, ns = not significant, Kruskal-Wallis and Dunn’s multiple comparisons tests). (D) Quantification of reversal potential (GCaMP6f = 16 cells, TMEM63B WT = 18 cells, TMEM63B R325, V44M, R433H, T481N, G580S, R660T, and F697L = 17 cells; ∗∗∗∗p < 0.0001, one-way ANOVA and Tukey’s multiple comparison test). Data are expressed as mean ± SEM.
Figure 6
Figure 6
Mutations of TMEM63B impair the Ca2+ response to hypotonic stress (A) Representative time-lapse sequence of Neuro2A cells co-transfected with WT and p.Val44Met TMEM63B after exposure to hypo-osmotic solution (170 mOsm/L). For each genotype, we show two cells characterized by transient or steady responses. The green dots on the traces indicate the timing of the images. Calibration bar is 10 μm in all images. (B) Fraction of Neuro2A cells transfected with WT, p.Val44Met, p.Arg433His, or p.Thr481Asn TMEM63B presenting a Ca2+ response within 10 min from exposure to hypo-osmotic solutions. The number of analyzed cells is on top of each column, with the number of replicates in parentheses. (C) Representative traces showing the change of fluorescence for several cells transfected with WT, p.Val44Met, p.Arg433His, or p.Thr481Asn TMEM63B. (D) Cumulative results indicating the peak amplitude of the Ca2+ response to hypo-osmotic stimulus (255 mOsm/L). Numbers indicate the responding cells in each group. Total number of analyzed cells and replicates as indicated in (B). (E) Integral of the Ca2+ change for the indicated experimental groups. In this analysis, we included only the cells that returned to baseline within 150 s from the transient onset. All mutants showed a drastically reduced response. Abbreviations and symbols: ∗∗∗, p < 0.001; ∗∗, p < 0.01; , p < 0.05 (chi-squared test); GCaM, control cells transfected with GCaMP6f empty vector. Data are expressed as box plots ranging from 25th percentile to 75th percentile, while the whiskers indicate the range of the outliers with a coefficient of 1.5.

References

    1. Murthy S.E., Dubin A.E., Whitwam T., Jojoa-Cruz S., Cahalan S.M., Mousavi S.A.R., Ward A.B., Patapoutian A. OSCA/TMEM63 are an evolutionarily conserved family of mechanically activated ion channels. Elife. 2018;7 doi: 10.7554/eLife.41844. - DOI - PMC - PubMed
    1. Zhang M., Wang D., Kang Y., Wu J.-X., Yao F., Pan C., Yan Z., Song C., Chen L. Structure of the mechanosensitive OSCA channels. Nat. Struct. Mol. Biol. 2018;25:850–858. doi: 10.1038/s41594-018-0117-6. - DOI - PubMed
    1. Yuan F., Yang H., Xue Y., Kong D., Ye R., Li C., Zhang J., Theprungsirikul L., Shrift T., Krichilsky B., et al. OSCA1 mediates osmotic-stress-evoked Ca2+ increases vital for osmosensing in Arabidopsis. Nature. 2014;514:367–371. doi: 10.1038/nature13593. - DOI - PubMed
    1. Du H., Ye C., Wu D., Zang Y.Y., Zhang L., Chen C., He X.Y., Yang J.J., Hu P., Xu Z., et al. The Cation Channel TMEM63B Is an Osmosensor Required for Hearing. Cell Rep. 2020;31:107596. doi: 10.1016/j.celrep.2020.107596. - DOI - PubMed
    1. Lang F., Busch G.L., Ritter M., Völkl H., Waldegger S., Gulbins E., Häussinger D. Functional significance of cell volume regulatory mechanisms. Physiol. Rev. 1998;78:247–306. doi: 10.1152/physrev.1998.78.1.247. - DOI - PubMed

Publication types