. 2023 Aug 3;186(16):3427-3442.e22.
doi: 10.1016/j.cell.2023.06.005. Epub 2023 Jul 7.

TMEM106B is a receptor mediating ACE2-independent SARS-CoV-2 cell entry

Affiliations

TMEM106B is a receptor mediating ACE2-independent SARS-CoV-2 cell entry

Jim Baggen et al. Cell. .

Abstract

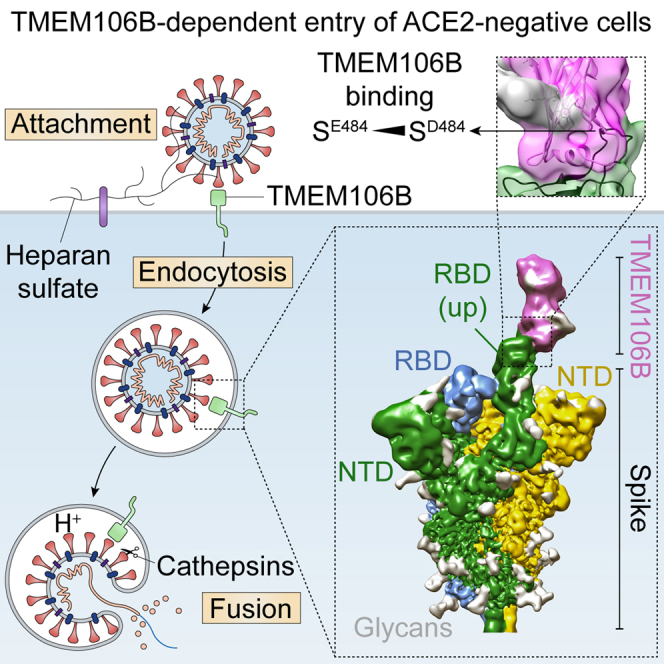
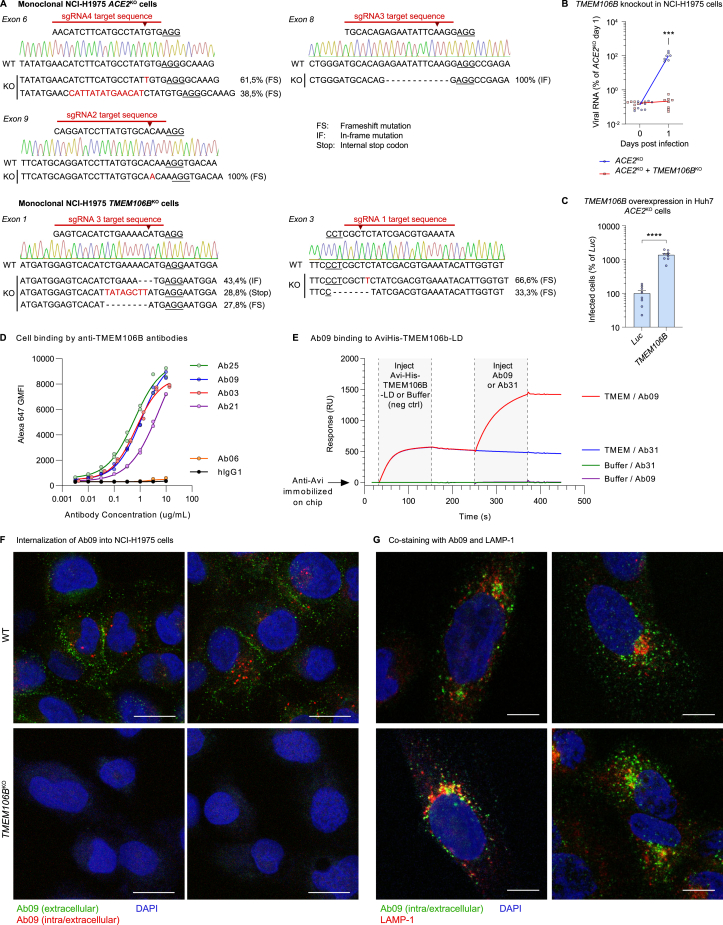
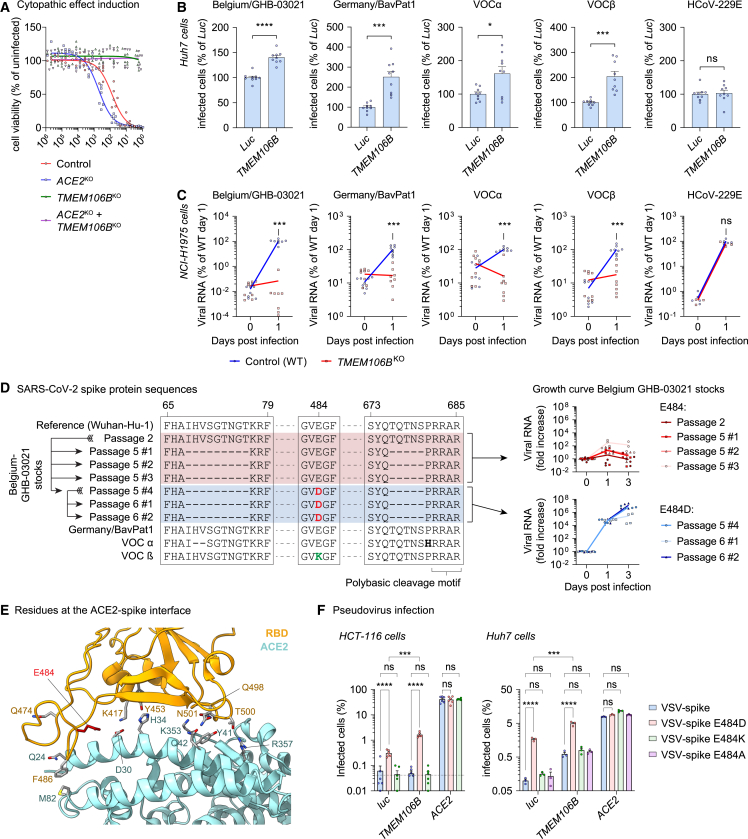
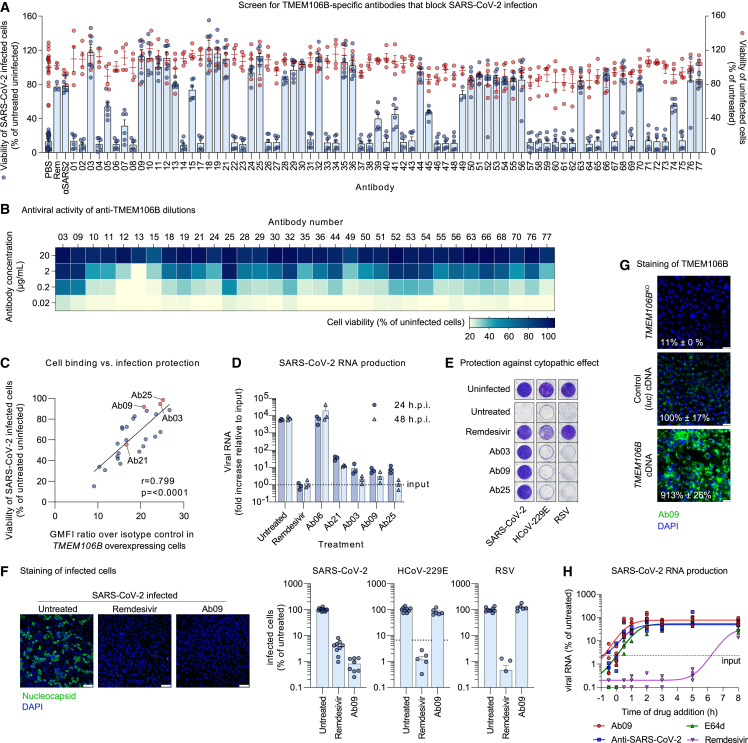
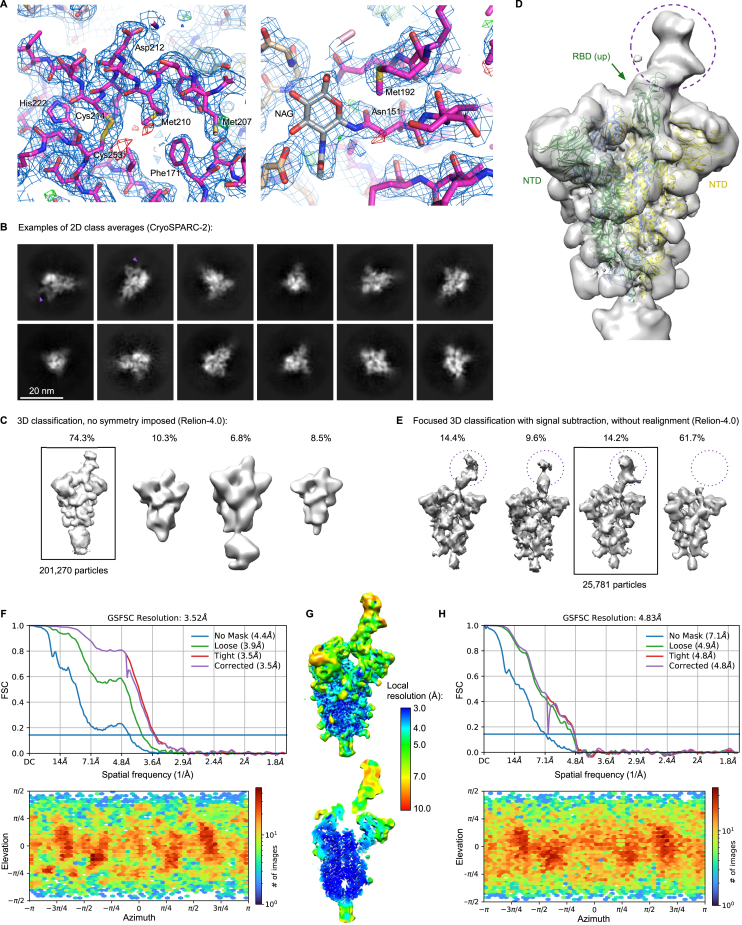
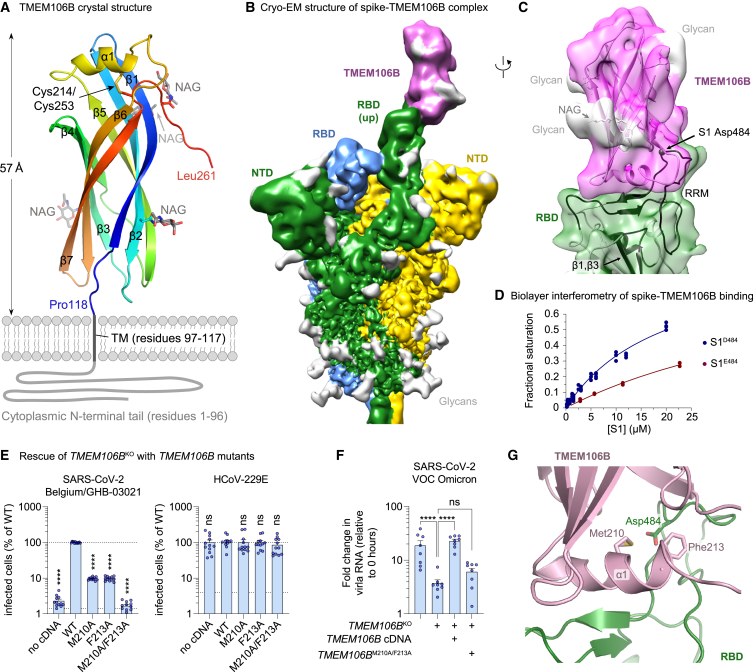
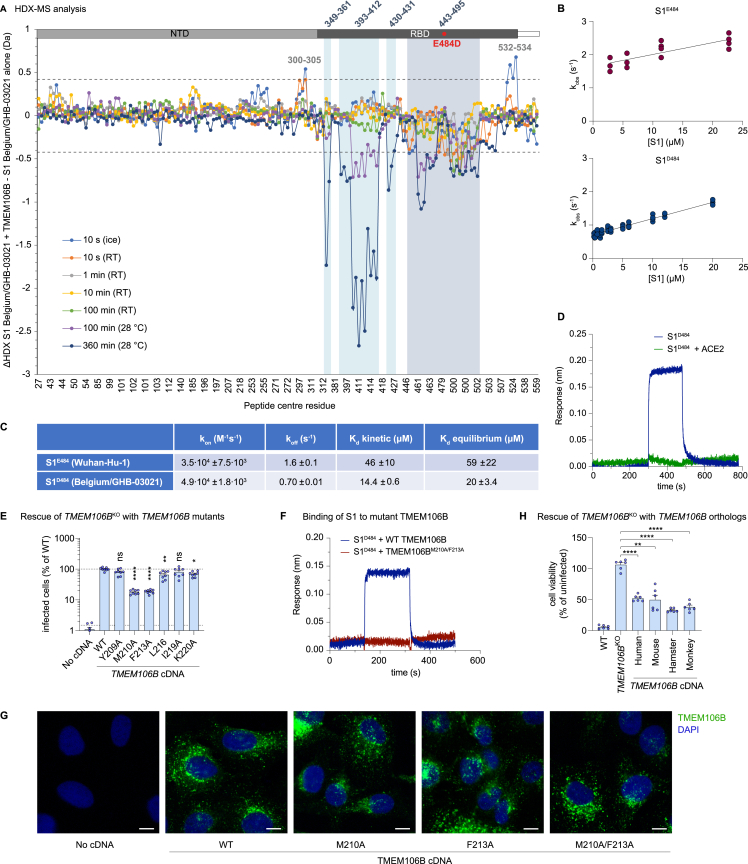
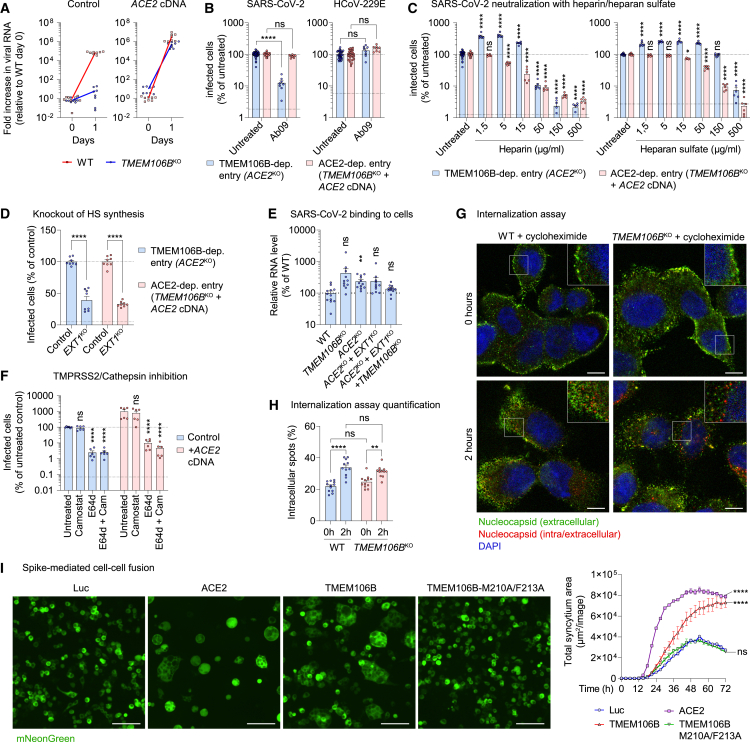
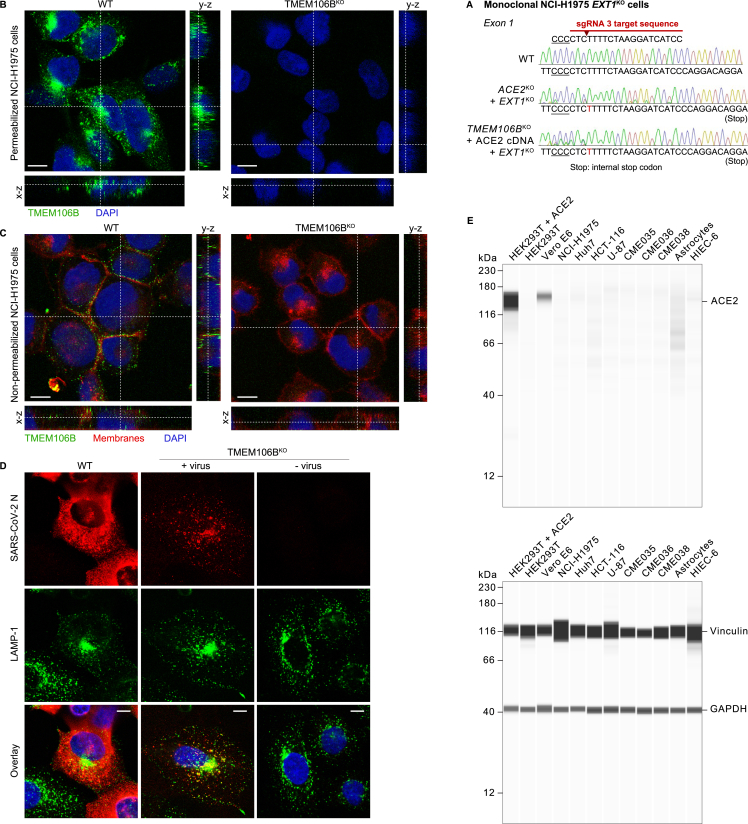
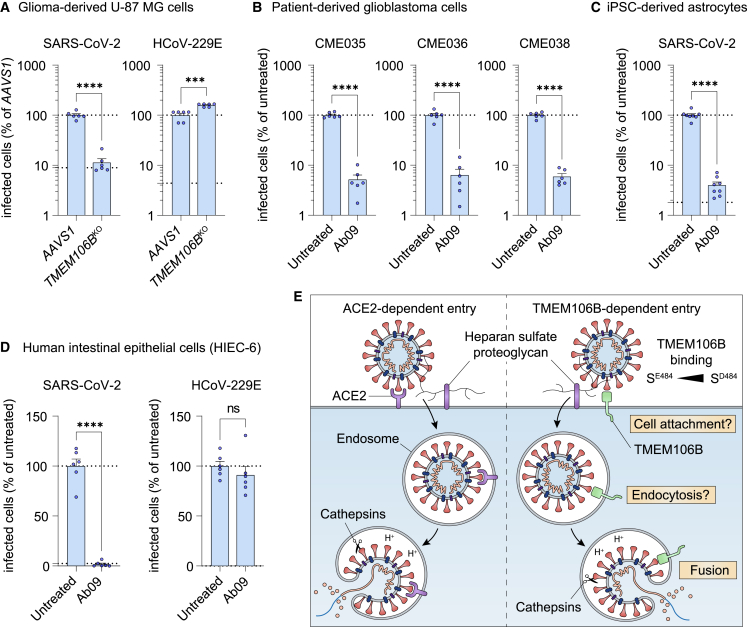
SARS-CoV-2 is associated with broad tissue tropism, a characteristic often determined by the availability of entry receptors on host cells. Here, we show that TMEM106B, a lysosomal transmembrane protein, can serve as an alternative receptor for SARS-CoV-2 entry into angiotensin-converting enzyme 2 (ACE2)-negative cells. Spike substitution E484D increased TMEM106B binding, thereby enhancing TMEM106B-mediated entry. TMEM106B-specific monoclonal antibodies blocked SARS-CoV-2 infection, demonstrating a role of TMEM106B in viral entry. Using X-ray crystallography, cryogenic electron microscopy (cryo-EM), and hydrogen-deuterium exchange mass spectrometry (HDX-MS), we show that the luminal domain (LD) of TMEM106B engages the receptor-binding motif of SARS-CoV-2 spike. Finally, we show that TMEM106B promotes spike-mediated syncytium formation, suggesting a role of TMEM106B in viral fusion. Together, our findings identify an ACE2-independent SARS-CoV-2 infection mechanism that involves cooperative interactions with the receptors heparan sulfate and TMEM106B.

Keywords: ACE2-independent entry; SARS-CoV-2; TMEM106B; TMEM106B crystal structure; antibody neutralization; coronavirus; cryo-EM; entry receptor.


Conflict of interest statement

Declaration of interests A.A.M., A.Y., E.B., M.R., M.A.Y.-C., N.F.-H., and T.N. are employees of Alector LLC, and H.R. was an Alector employee at the time of manuscript conception and may have an equity interest in Alector, Inc. Several authors have patents related to TMEM106B-specific antibodies. Work in the D.D. laboratory was partially funded by Alector LCC.

Figures

None
Graphical abstract
Figure S1
Figure S1
TMEM106B supports SARS-CoV-2 infection, and TMEM106B-specific monoclonal antibodies are internalized into cells, related to Figures 1 and 2 (A) Confirmation of TMEM106B and ACE2 knockout in monoclonal NCI-H1975 cell lines generated by CRISPR-Cas9. For each sgRNA, the target sequence is shown. The cut site is indicated by an arrowhead, and the protospacer adjacent motif (PAM) is underlined. Wild-type (WT) sequences of the corresponding exons were determined by Sanger sequencing and are presented with chromatograms. Sequences of knockout cells were determined by next-generation sequencing. For each detected sequence variant, the detection frequency and the type of mutation are shown. (B) NCI-H1975 cells expressing sgRNAs targeting ACE2 (monoclonal) or both ACE2 and TMEM106B and infected with SARS-CoV-2 Belgium/GHB-03021/2020. Viral RNA in cells was measured by qPCR at the indicated time points (n = 8 wells examined over two independent experiments.). p values for differences between ACE2KO and ACE2KO/TMEM106BKO on day 1 were calculated using Mann-Whitney test with Holm-Šídák correction for multiple comparisons. ∗∗∗0.0001 < p < 0.001. (C) Huh7 cells transduced with sgRNAs targeting ACE2 and with cDNA encoding luciferase (Luc) or TMEM106B and infected with SARS-CoV-2 Belgium/GHB-03021/2020. Cells were stained for nucleocapsid after 48 h. Infected cells were quantified by high-content imaging analysis (n = 8 wells examined over two independent experiments). Data were analyzed using two-sided unpaired t test with Welch’s correction. Data are mean ± SEM. ∗∗∗∗p < 0.0001. (D) Binding of TMEM106B-specific monoclonal antibodies to A549 cells stably overexpressing TMEM106B. Cells were incubated with antibody at the indicated concentrations and stained with Alexa Fluor 647-labeled anti-human IgG. The geometric mean fluorescence intensity (GMFI) compared with an hIgG1 isotype control is shown. (E) Binding of Ab09 to recombinant AviHis-TMEM106B-luminal domain (LD) was confirmed by surface plasmon resonance. Ab09 bound to recombinant AviHis-TMEM-LD that was captured by immobilized rabbit anti-Avi antibody. This confirmed that the epitope bound by Ab09 was intact on the recombinant protein. (F) WT and TMEM106BKO NCI-H1975 cells incubated with Ab09 for 2 h at ambient temperature to assess antibody internalization. Extracellular Ab09 was stained on live cells (green), followed by fixation, permeabilization, and staining of both extracellular and intracellular Ab09 (red) and nuclei (blue). The presence of red foci in WT cells indicates the endocytic uptake of anti-TMEM106B. Scale bars, 20 μm. (G) NCI-H1975 cells incubated with Ab09 for 50 min at ambient temperature and stained for Ab09 (green), LAMP-1 (red), and nuclei (blue). Four representative images are shown. Scale bars, 10 μm.
Figure 1
Figure 1
Different SARS-CoV-2 isolates can employ TMEM106B for infection, and spike substitution E484D enhances TMEM106B usage (A) NCI-H1975 cells expressing sgRNAs targeting ACE2 (monoclonal) or TMEM106B (polyclonal) infected with SARS-CoV-2 Belgium/GHB-03021/2020. Cell viability was determined by MTS assay after 4 days (n = 6 wells from two experiments). Fit curves were calculated by least squares regression. (B) Huh7 cells transduced with luciferase (Luc) or TMEM106B cDNA and infected with SARS-CoV-2 isolates or HCoV-229E. Cells were stained for nucleocapsid (SARS-CoV-2) after 24 h or double-stranded RNA (dsRNA) (HCoV-229E) after 48 h (n = 9 wells from three experiments). Data were analyzed using two-sided unpaired t test with Welch’s correction. (C) NCI-H1975 wild-type (WT) or monoclonal TMEM106BKO cells infected with SARS-CoV-2 isolates at multiplicity of infection (MOI) 10 or HCoV-229E at MOI 2. Viral RNA in cells was measured by qPCR (SARS-CoV-2: n = 8 wells from three experiments; HCoV-229E: n = 4 wells from one experiment). p values for differences between WT and TMEM106BKO on day 1 were calculated using Mann-Whitney test with Holm-Šídák correction for multiple comparisons. (D) Left: alignment of spike protein sequences of SARS-CoV-2 stocks used in this study. Right: NCI-H1975 cells infected with different stocks of SARS-CoV-2 Belgium/GHB-03021/2020 at MOI 1. Viral RNA in cells was measured by qPCR (n = 4 wells from two experiments). (E) Close-up view of the interactions between ACE2 (cyan) and the SARS-CoV-2-receptor-binding domain (RBD; orange), with Glu484 in red. Side chains are shown for important residues at the ACE2-spike interface. (F) HCT-116 or Huh7 cells transduced with luciferase (luc), TMEM106B, or ACE2 cDNA and infected with pseudoparticles harboring SARS-CoV-2 spike (VSV-spike; sequence of isolate Belgium/GHB-03021 passage 6) containing the indicated substitutions. GFP expression was quantified 24 h post-infection (n = 6 wells [HCT-116] from two experiments or n = 3 wells [Huh7] from one of two experiments with similar results). Data were log-transformed and analyzed using two-way ANOVA with Tukey’s multiple comparison test. (B and F) Data are mean ± SEM. ∗∗∗∗p < 0.0001; ∗∗∗0.0001 < p < 0.001; 0.01 < p < 0.05; ns, not significant. See also Figure S1.
Figure 2
Figure 2
TMEM106B-specific monoclonal antibodies block SARS-CoV-2 entry (A) NCI-H1975 cells pretreated with TMEM106B-specific antibodies at 20 μg/mL and infected with SARS-CoV-2 Belgium/GHB-03021/2020. Positive controls: remdesivir (Rem) and hamster anti-SARS-CoV-2 serum (αSARS2). Cell viability was determined by MTS assay after 3 days (n = 6 wells (infected; blue) or 4 wells (uninfected; red) from two experiments). (B) Heatmap representation of the viability of NCI-H1975 cells pretreated with different concentrations of TMEM106B-specific antibodies and infected with SARS-CoV-2 Belgium/GHB-03021/2020. Cell viability was determined by MTS assay after 3 days. (C) Correlation plot showing the ability of TMEM106B-specific antibodies to neutralize SARS-CoV-2 infection of NCI-H1975 cells at 2 μg/mL (y axis) and their ability to bind A549 cells overexpressing TMEM106B. Binding is expressed as the geometric mean fluorescence intensity (GMFI) relative to a hIgG1 isotype control. r, Spearman correlation. Fit curve was calculated by linear regression. (D) NCI-H1975 cells pretreated with TMEM106B-specific antibodies or remdesivir and infected with SARS-CoV-2 Belgium/GHB-03021/2020 at MOI 10. Viral RNA in cells was measured by qPCR (n = 3 wells from one of two experiments with similar results). (E) NCI-H1975 cells pretreated with TMEM106B-specific antibodies or remdesivir and infected with SARS-CoV-2 Belgium/GHB-03021/2020, HCoV-229E, or RSV. Cells were stained with crystal violet after 4 days. (F) NCI-H1975 cells pretreated with anti-TMEM106B (Ab09) or remdesivir and infected with SARS-CoV-2 Belgium/GHB-03021/2020, HCoV-229E, or RSV. After 24 h, cells were stained for nucleocapsid (SARS-CoV-2), dsRNA (HCoV-229E), or F (RSV). Left: representative confocal images. Scale bars, 100 μm. Right: quantification (SARS-CoV-2: n = 8–12 wells from three experiments; HCoV-229E and RSV: n = 6–9 wells from two experiments). Dotted line: lower detection limit. (G) Monoclonal TMEM106BKO or wild-type (WT) NCI-H1975 cells transduced with luciferase (Luc) or TMEM106B cDNA and stained with Ab09. Intensities were quantified using ImageJ (n = 4 wells), and representative images are shown. Scale bars, 50 μm. (H) NCI-H1975 cells treated at different time points with Ab09, anti-SARS-CoV-2, E64d, or remdesivir. At 11 h post-infection, viral RNA in cells was measured by qPCR (n = 4 wells from two experiments). Data are normalized to infected untreated cells. Fit curves were calculated by robust regression. (A, D, F, and G) Data are represented as mean ± SEM. See also Figure S1.
Figure S2
Figure S2
TMEM106B directly interacts with the RBD of SARS-CoV-2 spike, related to Figure 3 (A) TMEM106B crystal structure is shown as sticks with 2Fo-Fc electron density in blue mesh (contoured at 1 RMSD) and positive and negative Fo-Fc density in green and red mesh (contoured at 3 RMSD), respectively. The regions shown correspond to α1 helix (residues 208–216), left, and glycosylated Asn151, right. Carbon atoms of TMEM106B amino acid residues are colored magenta (chain A) or pink (molecules related by crystal symmetry). Carbon atoms of NAG residues are shown in gray. Other atoms are colored according to the standard format: oxygen, red; nitrogen, blue; and sulfur, yellow. (B) Examples of 2D class averages of the trimeric spike ectodomain. TMEM106BLD is visible in some 2D class average (purple arrowheads). (C) Result of the classification of the spike particles into four 3D classes. The class containing 201,270 particles selected for further processing is boxed. (D) Unmasked 3D reconstruction using particles images selected after initial 3D classification (B). The cryo-EM map is shown as a semi-transparent surface with the feature corresponding to associated TMEM106B indicated with dotted purple circle. Fitted is an atomistic model of the spike trimer in 1RBD-up conformation (PDB: 7NTA); RBD and NTD domains are indicated. (E) Results of focused 3D classification after signal subtraction, as detailed in the STAR Methods section. The displayed cryo-EM reconstructions were obtained after reversion to the original (non-subtracted) particles. One class selected for the final reconstruction is boxed. (F) Resolution and particle orientation metrics for final cryo-EM reconstructions. Half-map Fourier shell correlations (FSCs) and distribution of the refined particle orientations for the result of the final global non-uniform refinement, as implemented in cryoSPARC. (G) The final 3D reconstruction, colored by local resolution. (H) Half-map FSCs and particle orientation for local refinement using a soft mask covering TMEM106BLD and the associated RBD.
Figure 3
Figure 3
TMEM106B directly interacts with the RBD of SARS-CoV-2 spike (A) The crystal structure spanning residues 118–261 of human TMEM106B, shown as cartoons, colored by the rainbow gradient from N (blue) to C (red) terminus. The remainder of the protein, comprising the transmembrane region (TM, residues 97–117) and cytoplasmic tail (residues 1–96), is schematically represented as thick gray lines. Secondary structure elements (α1, β1–β7), N-acetylglucosamine (NAG) residues, Cys214–Cys253 disulfide, the TM, and the cytoplasmic tail are indicated. NAG residues are shown as sticks with carbon atoms in gray. (B) Cryo-EM map of the spike trimer in complex with TMEM106BLD. Protein chains are colored by protomer: subunits of the spike trimer in green, yellow, and blue and TMEM106B in magenta. The cryo-EM map features corresponding to glycans are light gray. (C) Local reconstruction of TMEM106BLD bound to the erect RBD within the spike trimer. The cryo-EM map is shown as a semi-transparent surface, colored as in (B). The atomistic models are placed by rigid body docking and shown as cartoons. The RBD regions showing protection from HDX in the presence of excess TMEM106BLD are colored dark green. (D) Biolayer interferometry results of S1 binding to immobilized TMEM106B. Data are represented as plots of variation of fractional saturation with S1 concentration for the S1E484 (Wuhan-Hu-1; red) versus S1D484 (Belgium/GHB-03021; blue) spike subunits. Symbols are measured values, and solid lines are computed best fits. (E) NCI-H1975 monoclonal TMEM106BKO cells transduced with wild-type (WT) or mutant TMEM106B cDNA, infected with SARS-CoV-2 Belgium/GHB-03021/2020 or HCoV-229E. Cells were stained for dsRNA after 24 h (n = 12 wells from three experiments). Data were log-transformed and analyzed using one-way ANOVA with Dunnett’s multiple comparison test, comparing each condition with WT TMEM106B. (F) NCI-H1975 cells or monoclonal TMEM106BKO cells transduced with WT or mutant TMEM106B cDNA, infected with SARS-CoV-2 VOC omicron. Viral RNA in cells was measured by qPCR at 0 and 24 h post-infection (n = 8 wells from two experiments). Data were log-transformed and analyzed using one-way ANOVA with Tukey’s multiple comparison test. (G) Close-up view of the spike-TMEM106B interface shown in (C). TMEM106B and the RBD are shown as purple and green cartoons with side chains of TMEM106B Met210 and Phe213 and spike Asp484 as sticks. Consistent with binding data (D and Figure S3F), the model predicts that the three residues project into the protein-protein interface. (E and F) Data are mean ± SEM. ∗∗∗∗p < 0.0001; ns, not significant. See also Figures S2, S3, and S4.
Figure S3
Figure S3
Spike residue D484 and TMEM106B residues M210 and F213 enhance spike-TMEM106B binding, related to Figure 3 (A) Differences in hydrogen-deuterium exchange (ΔHDX) between the spike S1 subunit of the Belgium/GHB-03021 isolate alone and when in the presence of excess TMEM106B. Negative values indicate protection and positive values deprotection from exchange in the presence of TMEM106B. The threshold of significance calculated with 98% CI at ±0.42 Da is indicated with a dashed gray line. Peptides are arranged from the N to C terminus according to their peptide center residue. See Table S3 and Data S1 for HDX data tables and deuterium uptake plots. (B) Biolayer interferometry results of S1 binding to immobilized TMEM106B. Data are represented as the dependence of the observed rate constant on S1 concentration for S1E484 (Wuhan-Hu-1) and S1D484 (Belgium/GHB-03021). (C) Thermodynamic parameters for S1E484 and S1D484 subunit binding to immobilized TMEM106B. For each variant, kon was determined from the slope of the plot of kobs against (S1) for the association phase, koff was obtained from the intercept of the plot of kobs against (S1) for the association phase, KD kinetic was calculated as koff/kon, and KD equilibrium was calculated from the plot of the amplitude versus (S1). (D) Biolayer interferometry traces of 6 μM S1D484 (blue) and 6 μM S1D484 premixed with 8 μM ACE2 (green) binding to immobilized TMEM106B (luminal domain). (E) NCI-H1975 monoclonal TMEM106B knockout cells transduced with cDNA encoding wild-type (WT) TMEM106B or TMEM106B containing single amino acid changes, infected with SARS-CoV-2 Belgium/GHB-03021/2020. Cells were stained for dsRNA after 24 h. Infected cells were quantified by high-content imaging analysis (n = 8 wells examined over two independent experiments). Data were log-transformed and analyzed using one-way ANOVA with Dunnett’s multiple comparison test, comparing each condition with WT TMEM106B. (F) Biolayer interferometry traces of 13.5 μM S1D484 binding to immobilized wild-type TMEM106B (blue) or mutant TMEM106BM210A/F213A (red). (G) NCI-H1975 monoclonal TMEM106B knockout cells transduced with cDNA encoding WT or mutant TMEM106B and stained with anti-TMEM106B (Ab09) and DAPI. Representative images are shown, scale bars, 10 μm. (H) WT or TMEM106BKO NCI-H1975 cells transduced with cDNA encoding human, mouse (mus musculus), hamster (Mesocricetus auratus), or African green monkey (Chlorocebus sabaeus) TMEM106B and infected with SARS-CoV-2 Belgium/GHB-03021/2020. Cell viability was determined by MTS assay after 3 days (n = 6 wells examined over two independent experiments). Data were analyzed using one-way ANOVA with Dunnett’s multiple comparison test, comparing each condition with TMEM106BKO cells. (E and G) Data are mean ± SEM. ∗∗∗∗p < 0.0001; ∗∗0.001 < p < 0.01; 0.01 < p < 0.05; ns, not significant.
Figure S4
Figure S4
Spike sequence coverage in HDX assays, related to Figure 3 Peptides of Belgium/GHB-03021 S1D484 whose HDX was experimentally followed for HDX-MS analysis are indicated with blue bars. Potential sites of N- and O-linked glycosylation are indicated with green spheres above the amino acid sequence. The residue numbering is adapted to the sequence of the ancestral spike of the original Wuhan-Hu-1 isolate.
Figure 4
Figure 4
TMEM106B is required for a post-endocytic stage of virus entry (A) Wild-type (WT) or monoclonal TMEM106BKO NCI-H1975 cells, untransduced (control) or transduced with ACE2 cDNA and infected with SARS-CoV-2 Belgium/GHB-03021/2020 at MOI 0.03. Viral RNA in cells was measured by qPCR (n = 8 wells from two experiments). (B) Monoclonal NCI-H1975 ACE2KO cells or TMEM106BKO cells overexpressing ACE2, infected with SARS-CoV-2 Belgium/GHB-03021/2020 or HCoV-229E in the presence of anti-TMEM106B (Ab09). After 6 h (SARS-CoV-2) or 24 h (HCoV-229E), cells were stained for dsRNA (n = 8 wells from three experiments; untreated, n = 36). (C) Monoclonal NCI-H1975 ACE2KO cells or TMEM106BKO cells overexpressing ACE2, infected with SARS-CoV-2 Belgium/GHB-03021/2020 or HCoV-229E pretreated with different concentrations of heparin or heparan sulfate. After 6 h (SARS-CoV-2) or 24 h (HCoV-229E), cells were stained for dsRNA (n = 6 wells from two experiments; untreated, n = 28). (D) Monoclonal NCI-H1975 ACE2KO cells or TMEM106BKO cells overexpressing ACE2, with or without an sgRNA targeting EXT1 (EXT1KO), infected with SARS-CoV-2 Belgium/GHB-03021/2020. After 6 h, cells were stained for dsRNA (n = 8 wells from two experiments). (E) WT NCI-H1975 cells, ACE2KO (monoclonal), TMEM106BKO (monoclonal), ACE2/EXT1KO (monoclonal), or ACE2/EXT1/TMEM106BKO (polyclonal) cells, incubated with SARS-CoV-2 Belgium/GHB-03021/2020 on ice. Viral RNA bound on cells was measured by qPCR (n = 12 wells from two experiments). Data were analyzed using one-way ANOVA with Dunnett’s multiple comparison test, comparing each condition with WT cells. (F) NCI-H1975 cells, untransduced (control) or transduced with ACE2 cDNA, treated with E64d or camostat, infected with SARS-CoV-2 Belgium/GHB-03021/2020, and stained for nucleocapsid after 6 h (n = 6 wells from two experiments). (G) NCI-H1975 WT or monoclonal TMEM106BKO cells, incubated with SARS-CoV-2 at MOI 8 on ice, followed by virus internalization at 35°C for 0 or 2 h in the presence of 20 μg/mL cycloheximide to block translation. Cells were stained for nucleocapsid before permeabilization (green) and after permeabilization (red) and nuclei (blue). Shown are representative images, scale bars, 10 μm. A magnification of the area in the square is shown in each upper right corner. (H) Quantified results from (G) (n = 12 wells from two experiments.). (B–D, F, and H) Upper dotted line: untreated level. Lower dotted line: detection limit. Data were log-transformed (B, C, and F) and analyzed using two-way ANOVA with Tukey’s (H), Šidák’s (B and D), or Dunnett’s (C and F) multiple comparison test, comparing each condition with the untreated control. (I) HEK293T cells co-transfected with three plasmids, encoding (1) SARS-CoV-2 Belgium/GHB-03021/2020 spike and mNeonGreen, (2) TMPRSS2, and (3) a receptor (ACE2 or TMEM106B) or control protein (Luc). Left: representative images, scale bars, 100 μm. Right: quantified syncytium area (n = 2 wells from one of two experiments with similar results). The area under the curve was calculated, followed by one-way ANOVA with Dunnett’s multiple comparison test, comparing each condition with Luc. (C, F, and I) Data are mean ± SEM. ∗∗∗∗p < 0.0001; ∗∗∗0.0001 < p < 0.001; ∗∗0.001 < p < 0.01; 0.01 < p < 0.05; ns, not significant. See also Figure S5.
Figure S5
Figure S5
Analysis of TMEM106B cell surface expression, SARS-CoV-2 uptake into TMEM106BKO cells, and ACE2 expression in various cell lines, related to Figures 4 and 5 (A) Confirmation of EXT1 knockout in monoclonal NCI-H1975 cell lines generated by CRISPR-Cas9. The cut site within the sgRNA is indicated by an arrowhead, and the protospacer adjacent motif (PAM) is underlined. Sequences of wild-type and EXT1 knockout cells were determined by Sanger sequencing and are shown as chromatograms. Inserted nucleotides are shown in red. (B and C) Wild-type (WT) or TMEM106BKO NCI-H1975 cells stained for TMEM106B (Ab09; green), membranes (CellBrite Fix 640; red), and nuclei (blue). Shown are representative images from one out of two independent experiments with similar results. Cells were either permeabilized before staining (B) or not permeabilized (C) to visualize only TMEM106B expressed on the cell surface. Scale bars, 10 μm. (D) WT or TMEM106BKO NCI-H1975 cells incubated with SARS-CoV-2 at MOI 1 for 24 h and stained for SARS-CoV-2 N (red), LAMP-1 (green), and nuclei (blue). Shown are representative images from one out of three independent experiments with similar results. Scale bars, 10 μm. Note that WT cells show more widespread N staining due to the translation of new N protein during productive infection. (E) Analysis of ACE2 expression levels in different cell lines. Lysates of the indicated wild-type cell lines or HEK293T cells transduced with an ACE2 overexpression construct were analyzed using a ProteinSimple Wes system, with antibodies specific for ACE2 and the endogenous controls vinculin and GAPDH.
Figure 5
Figure 5
Cells from various organs support SARS-CoV-2 infection via TMEM106B (A) U-87 MG cells transduced with sgRNAs targeting TMEM106B or safe harbor locus AAVS1, infected with SARS-CoV-2 Belgium/GHB-03021/2020 or HCoV-229E, fixed after 24 (SARS-CoV-2) or 96 h (HCoV-229E). (B) Patient-derived glioblastoma cells infected with SARS-CoV-2 Belgium/GHB-03021/2020 in the presence of anti-TMEM106B (Ab09), fixed after 24 h. (C) iPSC-derived astrocytes infected with SARS-CoV-2 Belgium/GHB-03021/2020 in the presence of Ab09, fixed after 48 h. (D) HIEC-6 cells infected with SARS-CoV-2 Belgium/GHB-03021/2020 or HCoV-229E in the presence of Ab09, fixed after 96 (SARS-CoV-2) or 72 h (HCoV-229E). (A–D) Cells were stained for nucleocapsid (SARS-CoV-2) or dsRNA (HCoV-229E). Data were analyzed using two-sided unpaired t test with Welch’s correction (n = 6 wells—A, B, and D—or n = 8 wells—C —from two experiments). Upper dotted line: untreated level. Lower dotted line: detection limit. Data are mean ± SEM. ∗∗∗∗p < 0.0001; ∗∗∗0.0001 < p < 0.001; ∗∗0.001 < p < 0.01; 0.01 < p < 0.05; ns, not significant. (E) Hypothetical model summarizing the two SARS-CoV-2 infection mechanisms characterized here. See also Figure S5.

Comment in

References

    1. Drożdżal S., Rosik J., Lechowicz K., Machaj F., Szostak B., Przybyciński J., Lorzadeh S., Kotfis K., Ghavami S., Łos M.J. An update on drugs with therapeutic potential for SARS-CoV-2 (COVID-19) treatment. Drug Resist. Updat. 2021;59:100794. doi: 10.1016/j.drup.2021.100794. - DOI - PMC - PubMed
    1. Kuba K., Imai Y., Rao S., Gao H., Guo F., Guan B., Huan Y., Yang P., Zhang Y., Deng W., et al. A crucial role of angiotensin converting enzyme 2 (ACE2) in SARS coronavirus-induced lung injury. Nat. Med. 2005;11:875–879. doi: 10.1038/nm1267. - DOI - PMC - PubMed
    1. Yan R., Zhang Y., Li Y., Xia L., Guo Y., Zhou Q. Structural basis for the recognition of SARS-CoV-2 by full-length human ACE2. Science. 2020;367:1444–1448. doi: 10.1126/science.abb2762. - DOI - PMC - PubMed
    1. Zhou P., Yang X.-L., Wang X.G., Hu B., Zhang L., Zhang W., Si H.R., Zhu Y., Li B., Huang C.L., et al. A pneumonia outbreak associated with a new coronavirus of probable bat origin. Nature. 2020;579:270–273. doi: 10.1038/s41586-020-2012-7. - DOI - PMC - PubMed
    1. Hoffmann M., Kleine-Weber H., Schroeder S., Krüger N., Herrler T., Erichsen S., Schiergens T.S., Herrler G., Wu N.H., Nitsche A., et al. SARS-CoV-2 cell entry depends on ACE2 and TMPRSS2 and is blocked by a clinically proven protease inhibitor. Cell. 2020;181:271–280.e8. doi: 10.1016/j.cell.2020.02.052. - DOI - PMC - PubMed

Publication types