. 2023 Aug 21;33(16):3299-3311.e3.
doi: 10.1016/j.cub.2023.06.045. Epub 2023 Jul 7.

Synaptic variance and action potential firing of cerebellar output neurons during motor learning in larval zebrafish

Affiliations

Synaptic variance and action potential firing of cerebellar output neurons during motor learning in larval zebrafish

Marion Najac et al. Curr Biol. .

Abstract

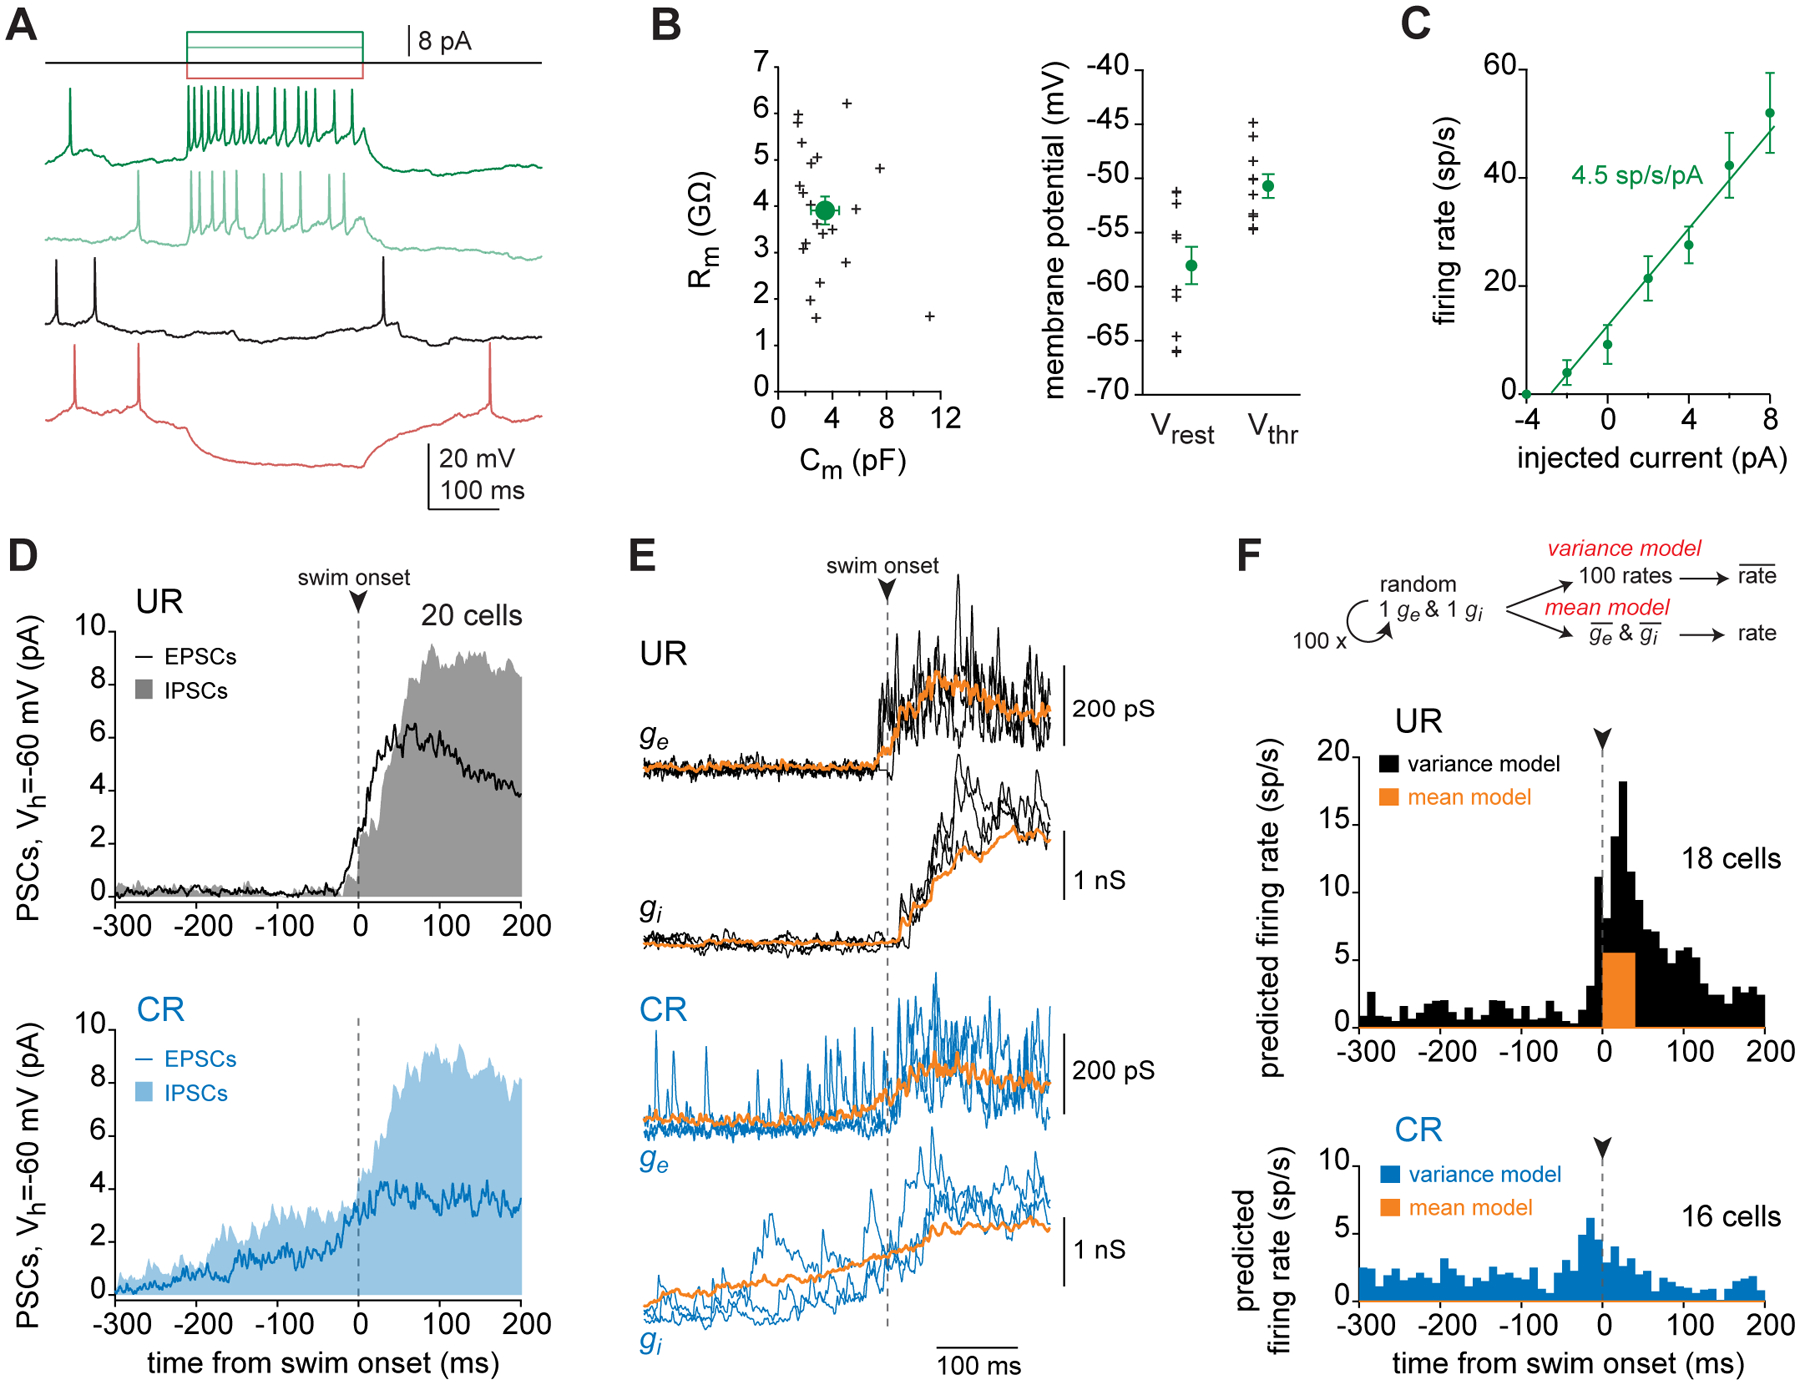
The cerebellum regulates both reflexive and acquired movements. Here, by recording voltage-clamped synaptic currents and spiking in cerebellar output (eurydendroid) neurons in immobilized larval zebrafish, we investigated synaptic integration during reflexive movements and throughout associative motor learning. Spiking coincides with the onset of reflexive fictive swimming but precedes learned swimming, suggesting that eurydendroid signals may facilitate the initiation of acquired movements. Although firing rates increase during swimming, mean synaptic inhibition greatly exceeds mean excitation, indicating that learned responses cannot result solely from changes in synaptic weight or upstream excitability that favor excitation. Estimates of spike threshold crossings based on measurements of intrinsic properties and the time course of synaptic currents demonstrate that noisy excitation can transiently outweigh noisy inhibition enough to increase firing rates at swimming onset. Thus, the millisecond-scale variance of synaptic currents can regulate cerebellar output, and the emergence of learned cerebellar behaviors may involve a time-based code.

Keywords: EPSC; IPSC; cerebellum; conditioning; eurydendroid; fictive swimming; spike timing.


Conflict of interest statement

Declaration of interests The authors declare no competing interests.

Figures

Figure 1.
Figure 1.. Firing rates of Olig2+ EuryD cells increase during reflexive and learned swimming.
(A) Schematic of the larval zebrafish preparation. EuryD, eurydendroid neuron; CS, conditional stimulus (blue light); VR, ventral root; US, unconditional stimulus (tail shock). Scale bar, 500 μm. (B) Percentage of trials with conditional responses (CR+) during the light, binned in 3-trial blocks of paired CS-US presentations. (C) Population mean swimming probability from the VR recording (black, CR– trials; magenta, CR+ trials) during paired CS-US presentations (n=40 fish). In each trial, the probability was set at 1 for the duration of each swimming bout, and at 0 before and afterward, and a mean probability record was generated for each fish, from which the grand mean was calculated. Blue bar and shading, 2-s light pulse; arrowhead, tail shock, in all panels. (D) Top, Example traces of VR recordings (grey) and simultaneous loose cell-attached recordings for CR– and CR+ trials Bottom, Raster plot of spikes on sequential trials. (E) PSTH (100-ms bins) of firing rates for the EuryD cell in (D). (F) Heatmaps of PSTHs in each of the 18 cells during CR– (top) and CR+ (bottom) trials. (G) Population average PSTHs (10-ms bins) aligned to sensory stimulus onset for CR– and CR+ trials (n=18 cells). (H) Firing rates in CR– (black) vs. CR+ (magenta) trials. Left, Baseline (bsl) rate before light (CR– vs. CR+: 3.5 ± 0.8 vs. 4.0 ± 0.8 spikes/s, p=0.09). Middle, Change in rate 0.1 s to 1.1 s after CS onset. Right, Change in firing rate 10 ms to 300 ms after US. Symbols, means ± SEM; lines individual cells. *, p<0.05; ***, p<0.001. See also Figure S1.
Figure 2.
Figure 2.. Olig2+ EuryD neurons fire before learned but not reflexive swimming.
(A) Example responses from a single fish. Top, Mean VR burst frequency aligned to the onset of swimming (grey dashed line) for CRs in 20 CR+ trials (blue), and URs in 6 CR– trials (black). Middle, Spike rasters from all CR– (black) and CR+ (blue) trials from concurrent recordings from a olig2+ EuryD neuron. Bottom, Mean PSTH (10-ms bins) from the spike rasters. (B) Heatmaps of firing rate (10-ms bins, smoothed with a 5-ms sliding window) during URs from CR– trials (top) and CRs (bottom) for all 18 cells. Arrowhead and white dashed line, swimming onset. (C) Response latency (time at which z-score ≥1.96) in all modulated cells. Solid symbols, mean ± SEM. (D) Population mean PSTH aligned to the motor response onset (10-ms bins, n=18 cells). (E) Mean change in firing rate during the 150 ms preceding swimming onset (left), and 100 ms following swimming onset (right). See also Figure S2.
Figure 3.
Figure 3.. Firing patterns of individual EuryD neurons can be motor-, sensorimotor- or sensory-related.
(A) Top, histogram of latencies to swimming onset relative to light onset (199 CR+ trials from 18 cells). Short-latency (≤350 ms), dark pink line; long-latency (≥700 ms), light pink bars; mid-latency, grey bars. Bottom, mean EuryD firing rates (50-ms bins) for fish with both short- and long-latency CRs (n=16 cells). CR– trials, black. (B) Firing rate (20-ms bins) during long-latency CRs (blue bars), and URs from CR– trials (black), aligned to onset of swimming (grey dotted line). (C) Change in firing rate (50-ms bins) for short- (dark pink line, top) and long-latency (light pink bars, middle) CRs, after subtraction of firing rates in CR– trials. Swimming probability calculated from the VR response (thick lines) is overlaid. Bottom, Change in firing rate vs. swimming probability (from upper panels) for the first 0.5 s of the light stimulus for short-latency CR+ trials (open squares), and for the last 1.5 s of the light stimulus for long-latency CR+ trials (filled squares). Black line, linear regression for short- and long-latency CRs combined (slope, 1.2; intercept, 2.5; r2 = 0.80, n=40 points, p<0.001). (D) Left, Maximum change in firing rate (100-ms bins) in the 200-ms window around swimming onset vs. for 100–500 ms after light onset. For light-related responses, the absolute value of rates is plotted because firing was suppressed in 2 cells. Motor-related cells, purple; sensorimotor-related cells, orange; sensory-related cells, green. Filled symbols, data from long-latency CR+ trials. Open symbols, data from swimming onset from all CR trials and data at light onset from CR– trials, for cells without long-latency CR+ trials. Right, plot of percentage of cells in each class. (E) Firing rate (50-ms bins) aligned to light onset in long-latency CR+ trials (color) and CR– trials (black) for motor (top, n=6), sensorimotor (middle, n=5), and sensory (bottom, n=3) cells. Only cells with long-latency CRs are included (see text). (F) As in (E), with data aligned to swimming onset, with URs from CR– trials in black, and 20-ms bins. See also Figure S3.
Figure 4.
Figure 4.. Synaptic inhibition exceeds excitation of Olig2+ EuryD neurons during reflexive and learned swimming.
(A) Example data from a single fish. Left, One trial of IPSCs recorded at −12 mV and one trial for EPSCs recorded at −72 mV (black), each with its corresponding VR recording (grey), for CR– trials. Right, same, for CR+ trials (PSCs, magenta). Insets, magnification of tail shock- and light-evoked responses. (B) Top, Population mean EPSCs (n=18 cells) and IPSCs (n=20 cells) for CR– trials (black) and CR+ trials (magenta). Bottom, magnification of responses in the time window around the tail shock. (C) Maximal EPSC (left) and IPSC (right) amplitudes measured 0.1 to 1.1 s after CS onset, (top) and 10 to 300 ms after the US, (bottom), for the mean of all trials within individual cells (lines) and the population grand mean (symbols). (D) Comparison of mean excitatory current, mean inhibitory current, and change in firing rates during CR+ and CR– trials, during the light pulse and after the tail shock. URs, 10 to 300 ms after the US (filled inverted triangles); CRs, 0.1 to 1.1 s after light onset (open squares). CR– trials, black; CR+ trials, magenta, for all panels. Left, Population mean inhibitory vs. excitatory current, averaged over the full window, Middle, Population mean change in firing rate vs. mean EPSC amplitude. Right, Population mean change in firing rate vs. mean IPSC amplitude. Black lines connect the origin to URs on CR– trials for comparison.
Figure 5.
Figure 5.. Synaptic inhibition of EuryD neurons lags excitation for URs but not CRs.
(A) Top, Mean population EPSCs (n=21 cells) and IPSCs (n=21 cells) aligned to swimming onset (dashed line). UR from CR– trials, black, CR, blue. Bottom, same data on an expanded time base. (B), (C) Mean EPSC (left) and IPSC (right) maximal amplitudes for URs and CRs during the 150 ms before swim onset (B) and 100 ms after swim onset (C), for the mean of all trials within individual cells (lines) and the population grand mean (symbols). (D) PSTH of the population mean change in firing rate (10-ms bins, grey) aligned to the motor response onset and mean EPSC (top, black) and IPSC (bottom, black) for URs. (E) Same as (D) for CRs. (F) Change in firing rate interpolated from plots in (D) and (E) (0.5 pA steps) vs. EPSC amplitude. URs are from CR– trials, filled triangles; CR, open circles; linear fits, lines. (G) Same as (F) for IPSCs, with 2.5 pA steps for interpolation. Sigmoid curves, solid lines, provided a better fit to the data (UR, χ2=43; CR, χ2=51) than linear fits, dashed lines (UR, χ2=491; CR, χ2=195). See also Figure S4.
Figure 6.
Figure 6.. Rapid fluctuations of IPSCs and EPSCs are permissive for action potential firing before the onset of learned swimming.
(A) Example olig2+ EuryD neuron whole-cell current-clamped hyperpolarizations or action potentials evoked by 250-ms current injections from −4 to +8 pA, in 4-pA increments. (B) Left, membrane resistance, Rm, vs. membrane capacitance, Cm (n=21 cells). Right, resting membrane potential, Vrest (n=11 cells) and action potential threshold, Vthr (n=10 cells that fired with 0 current injection). (C) Firing rate vs. injected current (n=19 cells). Line, linear fit with slope of 4.5 sp/s per pA. (D) Overlay of mean EPSCs (lines) and IPSCs (shaded areas) recorded in the same cells, scaled based on driving force to give the current predicted at holding potential of −60 mV (n=20 cells) during tail-shock evoked swimming (top, black, UR from CR– trials only) and during learned light-evoked swimming (bottom, blue, CR). (E) Synaptic conductance traces obtained by scaling PSC traces by driving force from a single cell. Excitatory conductance (ge) inhibitory conductances (gi,), are shown for reflexive swimming (UR, top, CR– trials only) and learned swimming (CR, bottom). Three individual trials (thin lines, UR, black, CR, blue) are overlaid with averages (orange thick lines). (F) Top, schematic of simulation of firing rates with a simple threshold-crossing calculation with leak and synaptic conductances. Predicted firing rates relative to swimming onset with ge and gi traces, for URs (n=18 cells, CR– trials only, middle) and CRs (n=16 cells, bottom). Variance model (black line or blue bars), average of 100 predicted firing rate traces generated by 100 random combinations of single traces of ge and gi. Mean model (orange line or grey bars), 1 predicted firing rate generated by the average of 100 random combinations of single traces of ge and gi. See also Figure S5 and Data S1.

Comment in

Similar articles

Cited by

References

    1. Witter L, Canto CB, Hoogland TM, de Gruijl JR, and De Zeeuw CI (2013). Strength and timing of motor responses mediated by rebound firing in the cerebellar nuclei after Purkinje cell activation. Front Neural Circuits 7, 133. 10.3389/fncir.2013.00133. - DOI - PMC - PubMed
    1. Heiney SA, Kim J, Augustine GJ, and Medina JF (2014). Precise control of movement kinematics by optogenetic inhibition of Purkinje cell activity. J Neurosci 34, 2321–2330. 10.1523/JNEUROSCI.4547-13.2014. - DOI - PMC - PubMed
    1. Proville RD, Spolidoro M, Guyon N, Dugue GP, Selimi F, Isope P, Popa D, and Lena C (2014). Cerebellum involvement in cortical sensorimotor circuits for the control of voluntary movements. Nat Neurosci 17, 1233–1239. 10.1038/nn.3773. - DOI - PubMed
    1. Lee KH, Mathews PJ, Reeves AM, Choe KY, Jami SA, Serrano RE, and Otis TS (2015). Circuit mechanisms underlying motor memory formation in the cerebellum. Neuron 86, 529–540. 10.1016/j.neuron.2015.03.010. - DOI - PMC - PubMed
    1. ten Brinke MM, Boele HJ, Spanke JK, Potters JW, Kornysheva K, Wulff P, AC IJ, Koekkoek SK, and De Zeeuw CI (2015). Evolving Models of Pavlovian Conditioning: Cerebellar Cortical Dynamics in Awake Behaving Mice. Cell Rep 13, 1977–1988. 10.1016/j.celrep.2015.10.057. - DOI - PMC - PubMed

Publication types

LinkOut - more resources