

The Thoracic Research Evaluation and Treatment 2.0 Model: A Lung Cancer Prediction Model for Indeterminate Nodules Referred for Specialist Evaluation
- PMID: 37421973
- PMCID: PMC10635839
- DOI: 10.1016/j.chest.2023.06.009
The Thoracic Research Evaluation and Treatment 2.0 Model: A Lung Cancer Prediction Model for Indeterminate Nodules Referred for Specialist Evaluation
Abstract
Background: Appropriate risk stratification of indeterminate pulmonary nodules (IPNs) is necessary to direct diagnostic evaluation. Currently available models were developed in populations with lower cancer prevalence than that seen in thoracic surgery and pulmonology clinics and usually do not allow for missing data. We updated and expanded the Thoracic Research Evaluation and Treatment (TREAT) model into a more generalized, robust approach for lung cancer prediction in patients referred for specialty evaluation.
Research question: Can clinic-level differences in nodule evaluation be incorporated to improve lung cancer prediction accuracy in patients seeking immediate specialty evaluation compared with currently available models?
Study design and methods: Clinical and radiographic data on patients with IPNs from six sites (N = 1,401) were collected retrospectively and divided into groups by clinical setting: pulmonary nodule clinic (n = 374; cancer prevalence, 42%), outpatient thoracic surgery clinic (n = 553; cancer prevalence, 73%), or inpatient surgical resection (n = 474; cancer prevalence, 90%). A new prediction model was developed using a missing data-driven pattern submodel approach. Discrimination and calibration were estimated with cross-validation and were compared with the original TREAT, Mayo Clinic, Herder, and Brock models. Reclassification was assessed with bias-corrected clinical net reclassification index and reclassification plots.
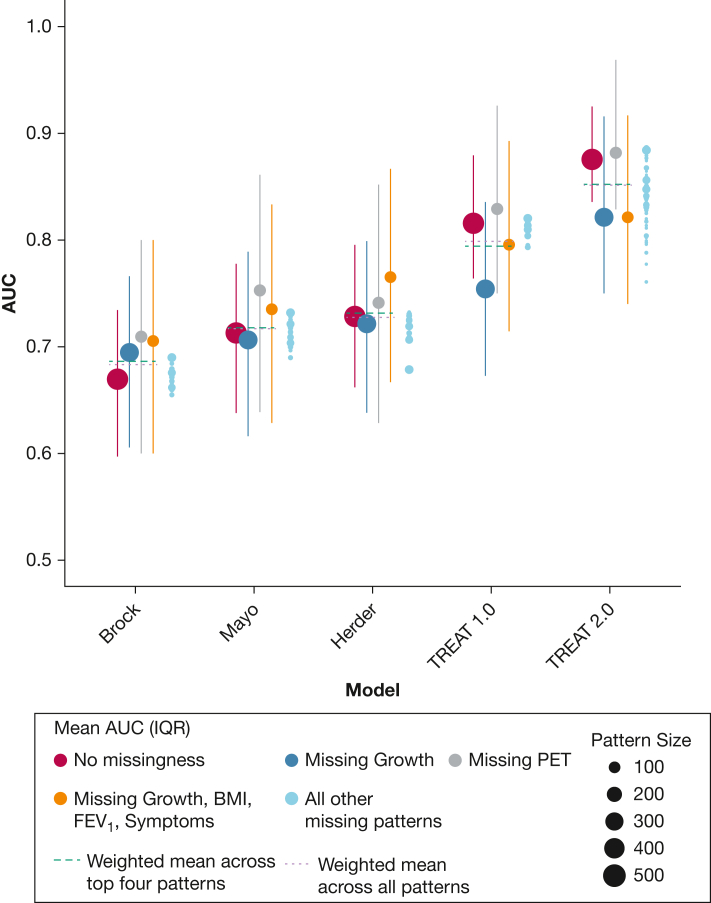
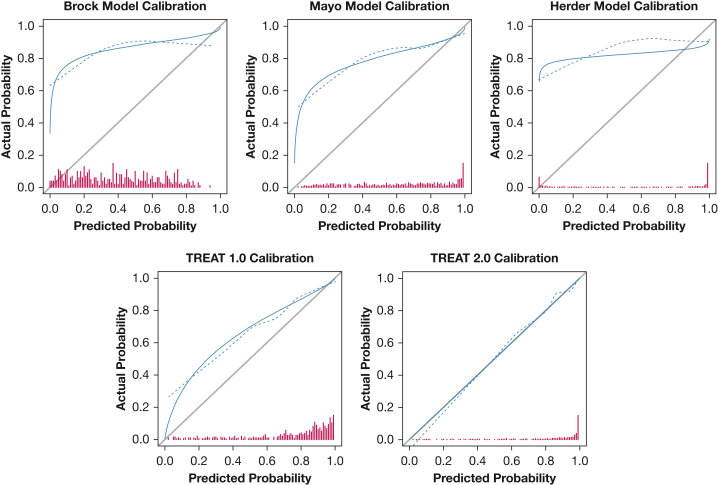
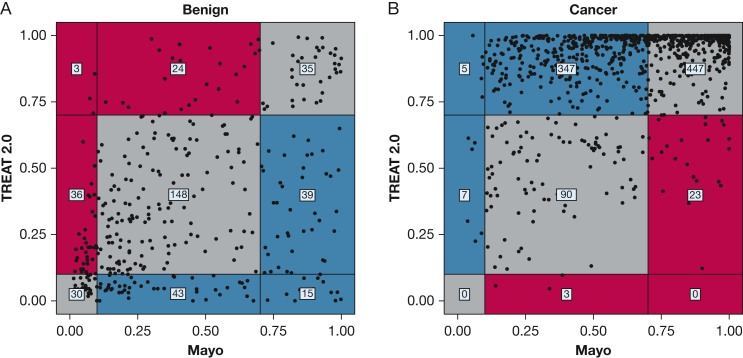
Results: Two-thirds of patients had missing data; nodule growth and fluorodeoxyglucose-PET scan avidity were missing most frequently. The TREAT version 2.0 mean area under the receiver operating characteristic curve across missingness patterns was 0.85 compared with that of the original TREAT (0.80), Herder (0.73), Mayo Clinic (0.72), and Brock (0.68) models with improved calibration. The bias-corrected clinical net reclassification index was 0.23.
Interpretation: The TREAT 2.0 model is more accurate and better calibrated for predicting lung cancer in high-risk IPNs than the Mayo, Herder, or Brock models. Nodule calculators such as TREAT 2.0 that account for varied lung cancer prevalence and that consider missing data may provide more accurate risk stratification for patients seeking evaluation at specialty nodule evaluation clinics.
Keywords: lung cancer; lung nodule; prediction model.
Published by Elsevier Inc.
Conflict of interest statement
Financial/Nonfinancial Disclosures The authors have reported to CHEST the following: J. M. I. discloses grants from Guardant Health and GRAIL, prior support for meeting attendance from Intuitive Surgical, planned or issued patents with AstraZeneca and Roche Genentech, and stock or stock options from LumaCyte, LLC. L. T. V. has received consulting fees from Ambu A/S. F. M. receives consulting fees from Medtronic, Johnson & Johnson, and Intuitive and additionally received research funding from Medtronic. The disclosures listed did not have any relation to the content of this manuscript. None declared (C. M. G., M. E. S., V. F. W., A. W. M., M. C. A., C. M., J. C., S. R., O. B. R., R. P., E. S. L., J. C. N., J. D. B., S. A. D., E. L. G.).
Figures
References
-
- Siegel R., Ward E., Brawley O., Jemal A. Cancer statistics, 2011: the impact of eliminating socioeconomic and racial disparities on premature cancer deaths. CA Cancer J Clin. 2011;61(4):212–236. - PubMed
-
- Jemal A., Siegel R., Xu J., Ward E. Cancer statistics, 2010. CA Cancer J Clin. 2010;60(5):277–300. - PubMed
-
- Ost D.E., Jim Yeung S.C., Tanoue L.T., Gould M.K. Clinical and organizational factors in the initial evaluation of patients with lung cancer: Diagnosis and Management of Lung Cancer, 3rd ed: American College of Chest Physicians evidence-based clinical practice guidelines. Chest. 2013;143(5 suppl):e121S–e141S. - PMC - PubMed
-
- Detterbeck F.C., Lewis S.Z., Diekemper R., Addrizzo-Harris D., Alberts W.M. Executive summary: Diagnosis and Management of Lung Cancer, 3rd ed: American College of Chest Physicians evidence-based clinical practice guidelines. Chest. 2013;143(5 suppl):7S–37S. - PubMed
Publication types
MeSH terms
Grants and funding
LinkOut - more resources
Full Text Sources
Medical
