. 2023 Aug:253:109689.
doi: 10.1016/j.clim.2023.109689. Epub 2023 Jul 6.

TACI and endogenous APRIL in B cell maturation

Affiliations

TACI and endogenous APRIL in B cell maturation

Yolanda Garcia-Carmona et al. Clin Immunol. 2023 Aug.

Abstract

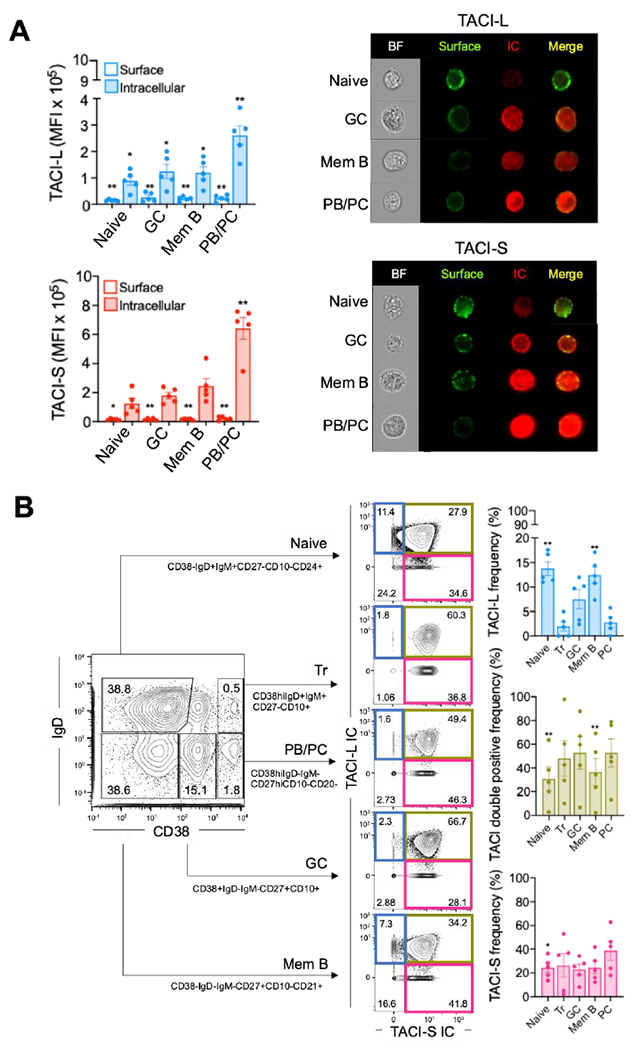
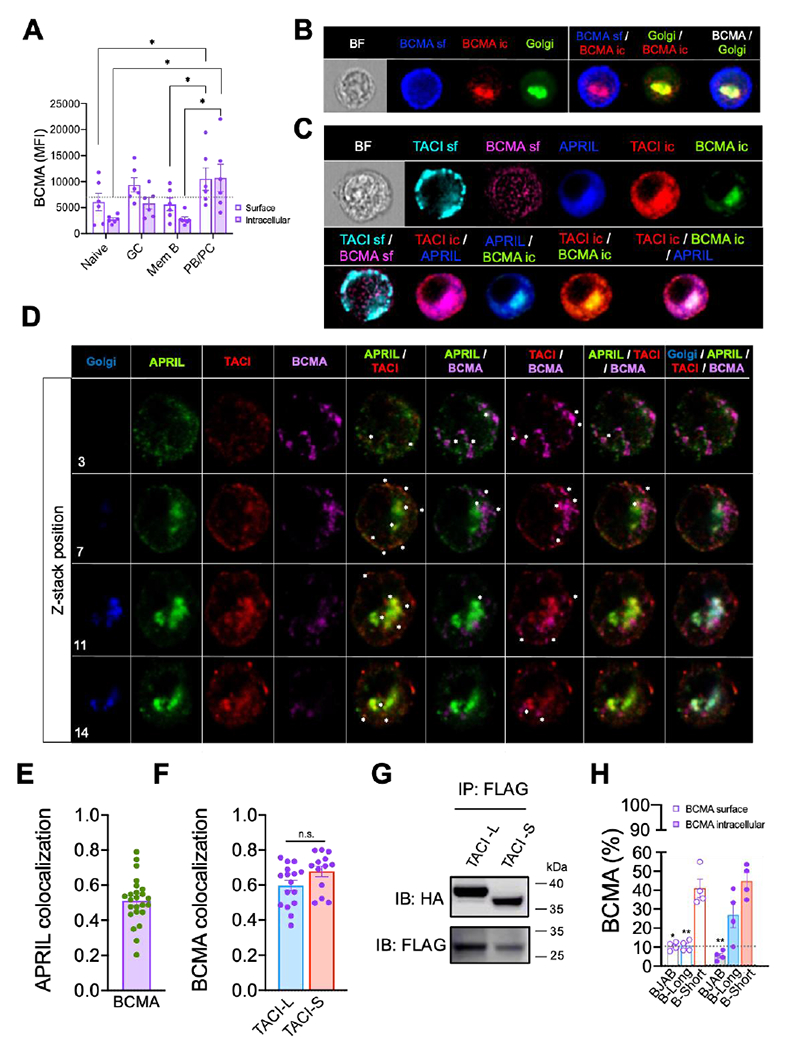
While many of the genes and molecular pathways in the germinal center B cell response which initiate protective antibody production are known, the contributions of individual molecular players in terminal B cell differentiation remain unclear. We have previously investigated how mutations in TACI gene, noted in about 10% of patients with common variable immunodeficiency, impair B cell differentiation and often, lead to lymphoid hyperplasia and autoimmunity. Unlike mouse B cells, human B cells express TACI-L (Long) and TACI-S (Short) isoforms, but only TACI-S promotes terminal B cell differentiation into plasma cells. Here we show that the expression of intracellular TACI-S increases with B cell activation, and colocalizes with BCMA and their ligand, APRIL. We show that the loss of APRIL impairs isotype class switch and leads to distinct metabolic and transcriptional changes. Our studies suggest that intracellular TACI-S and APRIL along with BCMA direct long-term PC differentiation and survival.

Keywords: A proliferation inducing ligand (APRIL); BCMA (B cell maturation antigen); Plasma cell; TACI (transmembrane activator and CAML interactor).


Conflict of interest statement

Declaration of Competing Interest Authors declare that they have no competing interests to disclosure.

Figures

Fig. 1.
Fig. 1.. Differential expression of TACI isoforms in human B cell subpopulations.
(A) TACI isoforms surface and intracellular expression in tonsillar B cells after stimulation with CD40L/IL21, analyzed by flow cytometry (left panels). Right panels show representative images by imaging flow cytometry (Amnis) of surface (green) and intracellular (red) TACI isoforms expression in the same B cell subpopulations. Samples were all acquired using the same laser settings. Significance was determined compared to PC for surface or intracellular condition. (B) TACI isoforms co-expression was analyzed by CyTOF in tonsillar B cells. Cells were gated after non-B cells exclusion. B cell subpopulations: Transitional (Tr), Naïve, Germinal Center (GC), Memory B cell (Mem B) and Plasmablast/Plasma cell (PB/PC). Intracellular TACI isoforms expression frequency (TACI-S vs TACI-L) were analyzed for each subpopulation (centered contour plots). Labeled quadrants represent TACI-L+ cells (blue), dual TACI-L/TACI-S co-expression (green) and TACI-S expressing cells (pink). Contour plots and numbers show TACI isoforms frequency of each subpopulation of one representative experiment. Right panels represent frequency of cells that only express TACI-L (blue), double-positive TACI-L and TACI-S cells (green) and cells that express only TACI-S (pink). Significance was determined compared to PC condition. Data show Mean of Fluorescence Intensity (MFI) mean ± SEM, two-tailed paired Student t test of 5 independent experiments. n.s.: no significative; * p<0.05; ** p<0.01.
Fig. 2.
Fig. 2.. TACI-S expression in B cells alters phosphorylation and metabolism.
(A) Flow cytometry analysis of cell size (FSC-A) and cell internal complexity and granularity (SSC-A) of resting BJAB, B-Long and B-Short cells. n=19. (B) Transmission electron microscopy of resting BJAB, B-Long and B-Short cells. Original magnification x3000 (BJAB), x2000 (B-Long) and x1500 (B-Short) (upper images), and 2 μm enlargement (lower images). Scale bars 2 or 5 μm. Data show representative images of 30 cells analyzed for each cell line. (C) Phosphorylation profile of resting BJAB cells determined by CyTOF. Heatmaps show mean of fluorescence intensity (MFI) comparison between cell lines for each phosphorylated protein analyzed. n=3. (D) Glucose uptake measurement of resting BJAB cells. Data represents 8 independent experiments expressed as relative luciferase units (RLU). (E) Flow cytometry analysis of mitochondrial mass (MitoTracker Green), mitochondrial potential (MitoTracker Deep Red), Golgi (BODIPY TR ceramide-A) and ER (ER-Tracker) of resting BJAB, B-Long and B-Short cells. Data is presented as mean +/− SEM of mean of fluorescence intensity (MFI) of 7 independent experiments. (F) Surface and intracellular IgG and IgA determination by flow cytometry of resting BJAB cells. Data is presented as mean +/− SEM of mean of fluorescence intensity (MFI) of 4 independent experiments. (G) Venn diagrams indicating genes with differentially increased expression in resting B-Long (blue) and B-Short (red) cells when compared to WT BJAB cells (log2FoldChange>1.5, p<0.001) and corresponding Gene Ontology enrichment for these subsets (enrichment P-values were obtained applying a hypergeometric test). Significance was determined compared to TACI-S condition. * p<0.05; ** p<0.01; *** p<0.001; **** p<0.0001.
Fig. 3.
Fig. 3.. Isoforms have different transcriptomes.
Gene set enrichment analysis plots for genes with increased expression in TACI-L (in blue, left) or TACI-S (in red, right) expression when compared to wild type BJAB versus gene signatures relevant B cells at large (www.gsea-msigdb.org) (NES, normalized enrichment score). DZ (Germinal center dark zone); LZ (Germinal center light zone); BM (bone marrow); SwMe (Switched Memory B cells).
Fig. 4.
Fig. 4.. B cells express ligands BAFF and APRIL, and TACI binds endogenous intracellular APRIL.
(A) BAFF and APRIL mRNA expression in human B cells, analyzed by quantitative RT-PCR and normalized with GAPDH. Data is represented as arbitrary units (a.u.) of at least 7 independent experiments. (B) Representative Amnis (imaging flow cytometry) images of surface and intracellular BAFF (orange) and APRIL (green) expression in human B cells and an overlay. Right panel shows ligand expression (represented as MFI) of surface and intracellular BAFF and APRIL. In each bar is indicated the number of cells analyzed for each condition. (C) Surface (left panel) and intracellular (right panel) BAFF and APRIL expression in human B cell subpopulations analyzed by flow cytometry and represented as Mean of Fluorescence Intensity (MFI) of 5 independent experiments. (D) BAFF and APRIL secretion determined by ELISA from human B cell cultures supernatants of tonsillar B stimulated for 5 days with CD40L/IL21. Data represent 5 independent experiments. (E) Representative Amnis image of human B cell (2860 analyzed cells), showing bright field (BF), TACI surface (SF) in light blue, total APRIL in dark blue, intracellular (IC) TACI in red and APRIL/TACI IC overlay. (F) Human tonsillar B cells were analyzed by confocal microscopy using either TACI-S or TACI-L monoclonal antibodies. Panel shows different z-stacks from the total projection of one representative cell. Images shows Golgi (blue), APRIL (green), TACI-S (red) and APRIL/TACI overlay. Images were analyzed with IMARIS software and the APRIL/TACI isoform colocalization was assessed by Pearson’s colocalization coefficient (right panel) and indicated with white stars (left panel). Results are represented as mean ± SEM of 15 different cells from 3 independent experiments. Significance was determined compared to PC condition (A, B and C) or to No stimuli condition (D). * p<0.05; *** p<0.001.
Fig. 5.
Fig. 5.. BCMA is co-expressed with TACI and APRIL in B cells.
(A) Surface and intracellular BCMA expression in subpopulations of tonsillar B cells. Graph show p value and mean ± SEM, two-tailed paired Student t test of 6 independent experiments. Significance was determined compared to PC for Surface or Intracellular condition. (B) Representative Amnis (imaging flow cytometry) images of surface (dark blue) and intracellular (red) BCMA, Golgi (green) and merged images, from human tonsillar B cells stimulated for 5 days in the presence of CD40L/IL21 (1796 cells analyzed). (C) Representative Amnis images of surface TACI (light blue), APRIL (dark blue), surface BCMA (pink), intracellular TACI (red) intracellular BCMA (green) and merged images, from cells cultured as in (B) (4170 cells analyzed). (D) Confocal images of 5 days stimulated tonsillar B cells examining Golgi (dark blue), APRIL (green), TACI-L (red) and BCMA (pink) expression in 4 Z-stacks from one representative cell. Images were analyzed with IMARIS software. Colocalization is indicated with white stars (E) APRIL/BCMA colocalization was assessed and quantified using Pearson’s colocalization coefficient. Results are represented as mean ± SEM of 15 different cells from 3 independent experiments. (F) TACI isoforms and BCMA colocalization analysis in same cells as in D. Results are represented as mean ± SEM of 15 different cells from 3 independent experiments and statistical significance was evaluated using two-tailed paired t-Student test. (G) TACI isoforms and BCMA co-immunoprecipitation. HEK-293T cells were co-transfected with HA-labeled TACI-S or TACI-L plasmids with BCMA-FLAG plasmid and immune-complexes were pulled down using anti-FLAG beads. Upper panels show co-immunoprecipitated TACI isoforms (using anti-HA antibody). Lower panel shows BCMA expression as control (using anti-FLAG antibody). Representative western blot of 4 independent experiments. (H) BCMA expression in BJAB, BJAB-L and BJAB-S cells analyzed by flow cytometry. Significance was determined compared to TACI-S for Surface or Intracellular condition. Graph show p value and mean ± SEM, two-tailed paired Student t test of 4 independent experiments. * p<0.05; ** p<0.01; n.s.: no significative.
Fig. 6.
Fig. 6.. APRIL silencing blocks B cell differentiation.
(A) Representative flow cytometry contour plots of human B cells transduced with control (scramble) RNA or APRIL shRNA. Quadrants show different B cell subpopulations: Naïve (IgD+CD27−), NSM (Non-Switch Memory, IgD+CD27+), SwMe (Switched Memory, IgD−CD27+) and DN (double negative, IgD−CD27−). Numbers indicate populations frequency (%) from one representative experiment of 12 independent experiments. (B) The effect of APRIL silencing in B cell subpopulation frequency was analyzed in human tonsillar (filled circles) and peripheral blood (open circles) B cells by flow cytometry. Graphs show Naïve, NSM, SwMe, IgD+ and PB/PC (plasmablasts/plasma cells) cells frequency comparison between control shRNA and APRIL shRNA-transduced cells, and percentage of live cells in both conditions. Donors are color-coded. Graphs show p values and mean, two-tailed paired Student t test of 12 independent experiments. (C) Glucose uptake measurement of cells from (B). Data represents 7 independent experiments expressed as relative luciferase units (RLU). (D) Hierarchical cluster analysis of metabolome data from control shRNA and APRIL shRNA tonsillar B cells. Metabolite ratios from two independent experiments/3 different samples per group, are shown. Color intensity correlates with degree of increase (red) and decrease (green) relative to the mean metabolite ratio. (E) Metabolite Set Enrichment analysis showing upregulated metabolic pathways in control shRNA (upper panel) and APRIL shRNA (lower panel). (F) Phosphorylation profiles of TACI-S or TACI-L BJAB cells, transduced with control shRNA or APRIL shRNA, analyzed by CyTOF. Heatmap shows differential phosphorylation (Fold) in resting APRIL- TACI-L cells and APRIL- TACI-S as compared to control cells. Data were previously normalized with respective BJAB APRIL shRNA or control shRNA. Red (up) and blue (down). (G) Surface BCMA expression by flow cytometry in WT and BJAB-TACI cells transduced with control or APRIL shRNA. * p<0.05; *** p<0.001; **** p<0.0001; n.s.: not significant.

Similar articles

Cited by

References

    1. Victora GD, Nussenzweig MC, Germinal Centers, Annu Rev Immunol, 40 (2022) 413–442. - PubMed
    1. Egawa T, Bhattacharya D, Regulation of metabolic supply and demand during B cell activation and subsequent differentiation, Curr Opin Immunol, 57 (2019) 8–14. - PMC - PubMed
    1. Boothby M, Rickert RC, Metabolic Regulation of the Immune Humoral Response, Immunity, 46 (2017) 743–755. - PMC - PubMed
    1. Choi SC, Morel L, Immune metabolism regulation of the germinal center response, Exp Mol Med, 52 (2020) 348–355. - PMC - PubMed
    1. Mackay F, Schneider P, TACI, an enigmatic BAFF/APRIL receptor, with new unappreciated biochemical and biological properties, Cytokine Growth Factor Rev, 19 (2008) 263–276. - PubMed

Publication types

MeSH terms

Substances