

Thymic stromal lymphopoietin participates in the host response to intra-amniotic inflammation leading to preterm labor and birth
- PMID: 37422429
- PMCID: PMC10530449
- DOI: 10.1016/j.humimm.2023.06.005
Thymic stromal lymphopoietin participates in the host response to intra-amniotic inflammation leading to preterm labor and birth
Abstract
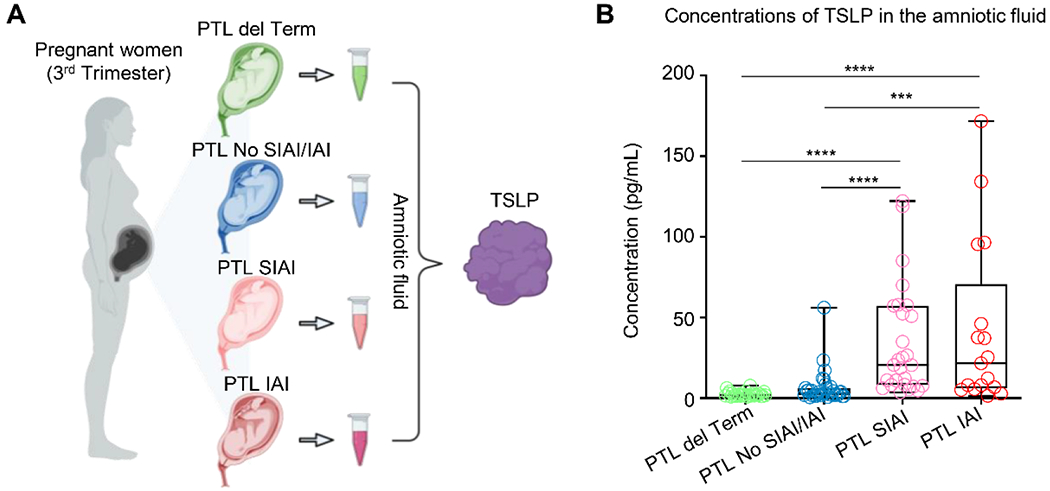
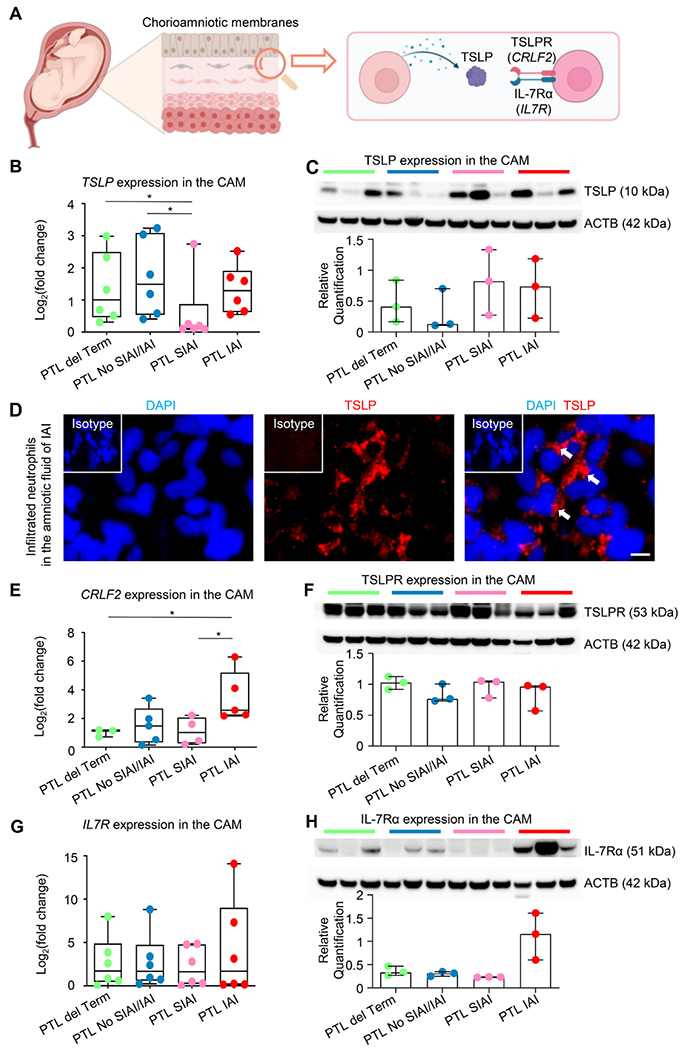
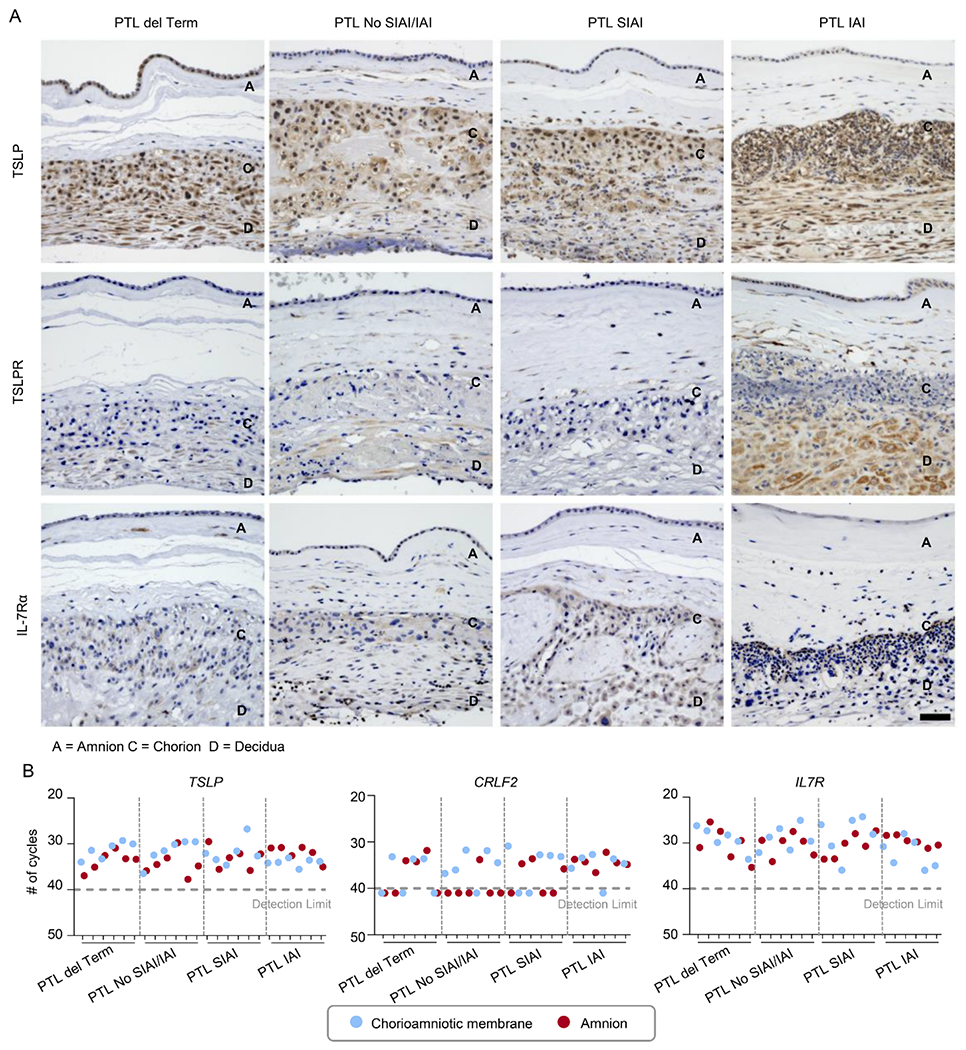
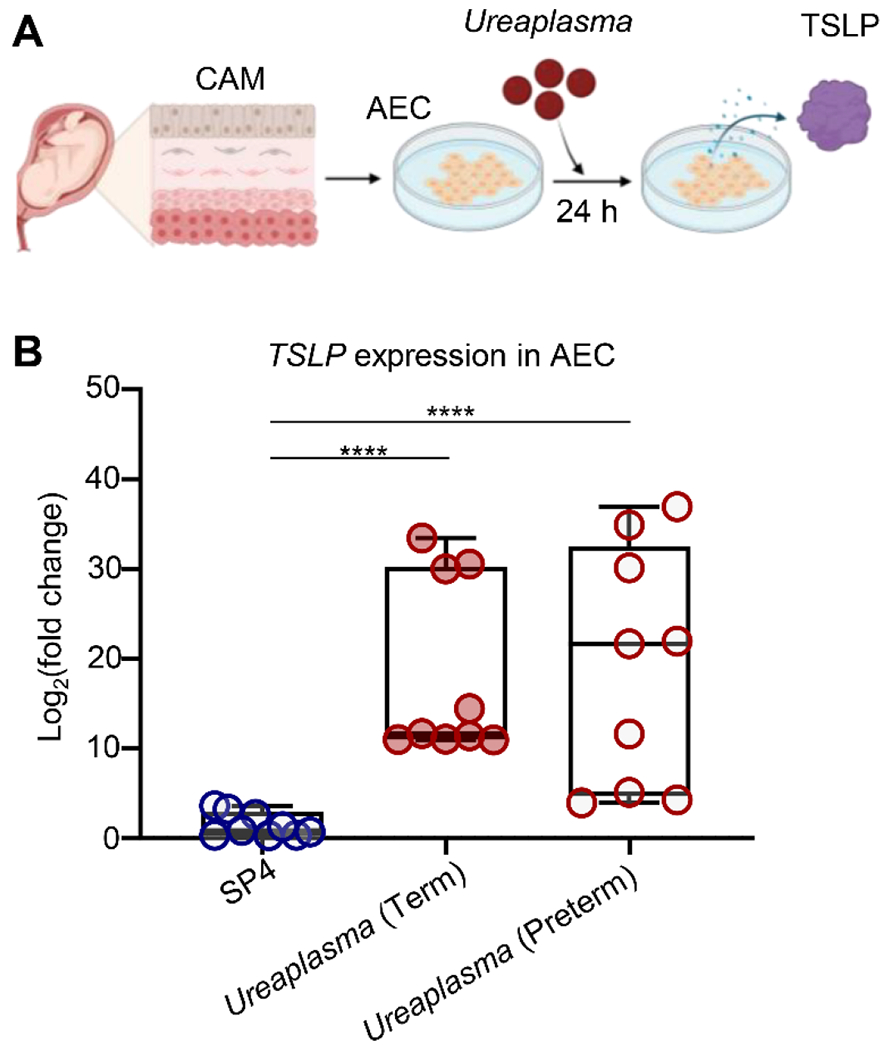
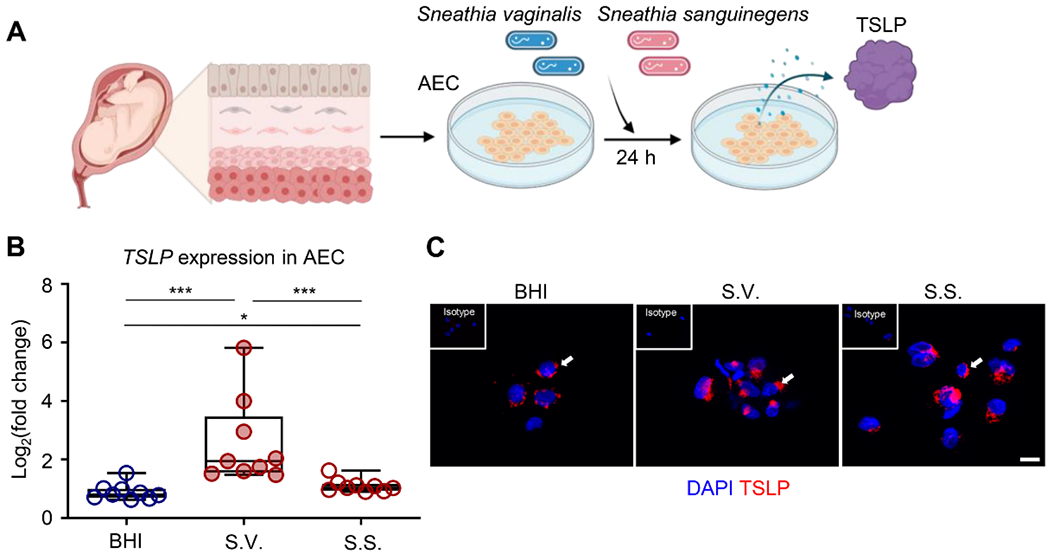
The aim of this study was to establish the role of thymic stromal lymphopoietin (TSLP) in the intra-amniotic host response of women with spontaneous preterm labor (sPTL) and birth. Amniotic fluid and chorioamniotic membranes (CAM) were collected from women with sPTL who delivered at term (n = 30) or preterm without intra-amniotic inflammation (n = 34), with sterile intra-amniotic inflammation (SIAI, n = 27), or with intra-amniotic infection (IAI, n = 17). Amnion epithelial cells (AEC), Ureaplasma parvum, and Sneathia spp. were also utilized. The expression of TSLP, TSLPR, and IL-7Rα was evaluated in amniotic fluid or CAM by RT-qPCR and/or immunoassays. AEC co-cultured with Ureaplasma parvum or Sneathia spp. were evaluated for TSLP expression by immunofluorescence and/or RT-qPCR. Our data show that TSLP was elevated in amniotic fluid of women with SIAI or IAI and expressed by the CAM. TSLPR and IL-7Rα had detectable gene and protein expression in the CAM; yet, CRLF2 was specifically elevated with IAI. While TSLP localized to all layers of the CAM and increased with SIAI or IAI, TSLPR and IL-7Rα were minimal and became most apparent with IAI. Co-culture experiments indicated that Ureaplasma parvum and Sneathia spp. differentially upregulated TSLP expression in AEC. Together, these findings indicate that TSLP is a central component of the intra-amniotic host response during sPTL.
Keywords: Amniotic fluid; Chorioamniotic membranes; Sneathia; TSLP; Ureaplasma.
Copyright © 2023 American Society for Histocompatibility and Immunogenetics. All rights reserved.
Conflict of interest statement
Declaration of Competing Interest The authors declare that they have no known competing financial interests or personal relationships that could have appeared to influence the work reported in this paper.
Figures
Similar articles
-
Inflammasome activation during spontaneous preterm labor with intra-amniotic infection or sterile intra-amniotic inflammation.Am J Reprod Immunol. 2018 Nov;80(5):e13049. doi: 10.1111/aji.13049. Epub 2018 Sep 18. Am J Reprod Immunol. 2018. PMID: 30225853 Free PMC article.
-
Soluble ST2, a modulator of the inflammatory response, in preterm and term labor.J Matern Fetal Neonatal Med. 2014 Jan;27(2):111-21. doi: 10.3109/14767058.2013.806894. Epub 2013 Nov 13. J Matern Fetal Neonatal Med. 2014. PMID: 23688338 Free PMC article.
-
Damage-associated molecular patterns (DAMPs) in preterm labor with intact membranes and preterm PROM: a study of the alarmin HMGB1.J Matern Fetal Neonatal Med. 2011 Dec;24(12):1444-55. doi: 10.3109/14767058.2011.591460. Epub 2011 Sep 29. J Matern Fetal Neonatal Med. 2011. PMID: 21958433 Free PMC article.
-
Expression and Regulation of Thymic Stromal Lymphopoietin and Thymic Stromal Lymphopoietin Receptor Heterocomplex in the Innate-Adaptive Immunity of Pediatric Asthma.Int J Mol Sci. 2018 Apr 18;19(4):1231. doi: 10.3390/ijms19041231. Int J Mol Sci. 2018. PMID: 29670037 Free PMC article. Review.
-
The Role of Innate Immune System in the Human Amniotic Membrane and Human Amniotic Fluid in Protection Against Intra-Amniotic Infections and Inflammation.Front Immunol. 2021 Oct 21;12:735324. doi: 10.3389/fimmu.2021.735324. eCollection 2021. Front Immunol. 2021. PMID: 34745106 Free PMC article. Review.
Cited by
-
Stretch Causes cffDNA and HMGB1-Mediated Inflammation and Cellular Stress in Human Fetal Membranes.Int J Mol Sci. 2024 May 9;25(10):5161. doi: 10.3390/ijms25105161. Int J Mol Sci. 2024. PMID: 38791199 Free PMC article.
-
Amniotic fluid modifies esophageal epithelium differentiation and inflammatory responses.Am J Physiol Gastrointest Liver Physiol. 2024 Nov 1;327(5):G629-G639. doi: 10.1152/ajpgi.00197.2024. Epub 2024 Aug 27. Am J Physiol Gastrointest Liver Physiol. 2024. PMID: 39189791
References
-
- Liu L, Oza S, Hogan D, Perin J, Rudan I, Lawn JE et al. Global, regional, and national causes of child mortality in 2000-13, with projections to inform post-2015 priorities: an updated systematic analysis. Lancet 2015;385:430. - PubMed
-
- Births: Provisional Data for 2021. In National Center for Health S (ed), vol 20. Hyattsville, MD, 10.15620/cdc:116027, 2022. - DOI
-
- March of Dimes. The impact of premature birth on society. vol 2022, 2015.
MeSH terms
Substances
Grants and funding
LinkOut - more resources
Full Text Sources
Molecular Biology Databases
Miscellaneous
