. 2023 Jul 8;14(1):4049.
doi: 10.1038/s41467-023-39823-5.

Blocking D2/D3 dopamine receptors in male participants increases volatility of beliefs when learning to trust others

Affiliations

Blocking D2/D3 dopamine receptors in male participants increases volatility of beliefs when learning to trust others

Nace Mikus et al. Nat Commun. .

Abstract

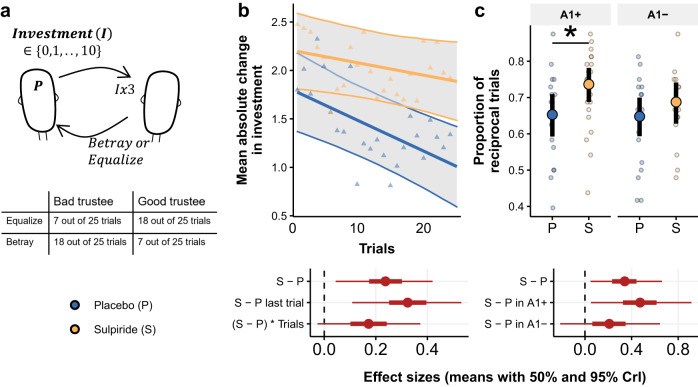
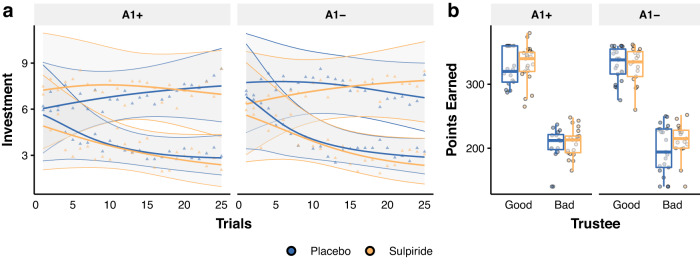
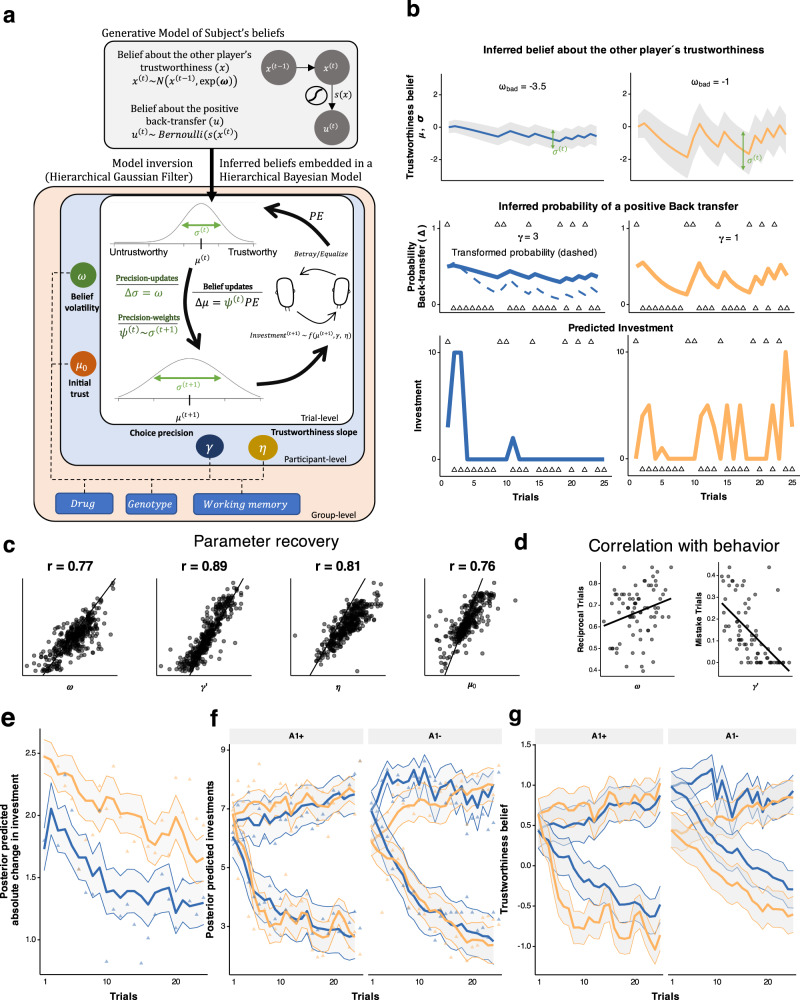
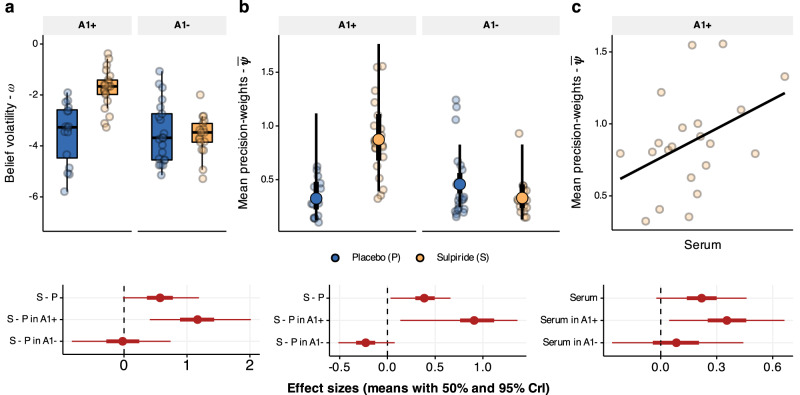
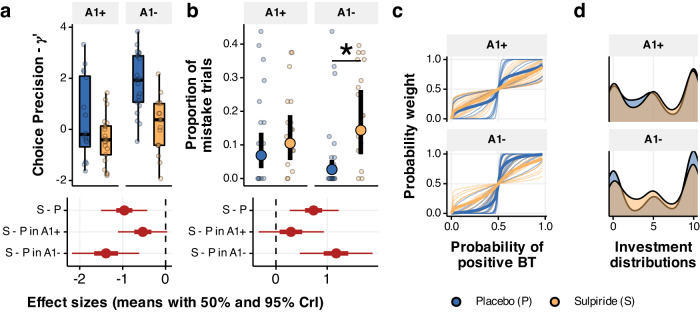
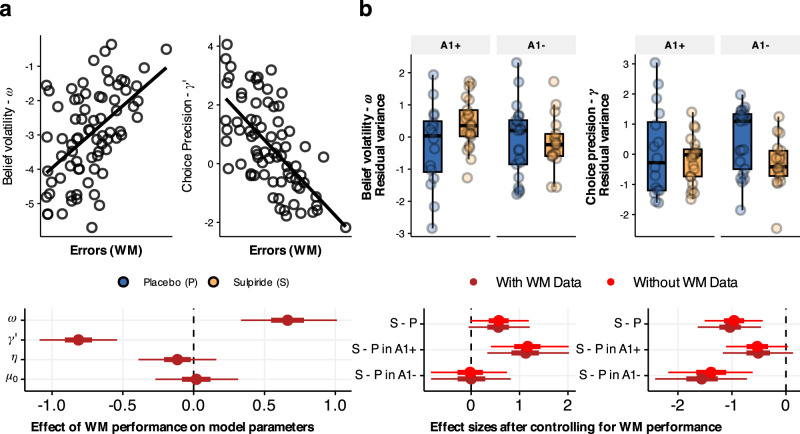
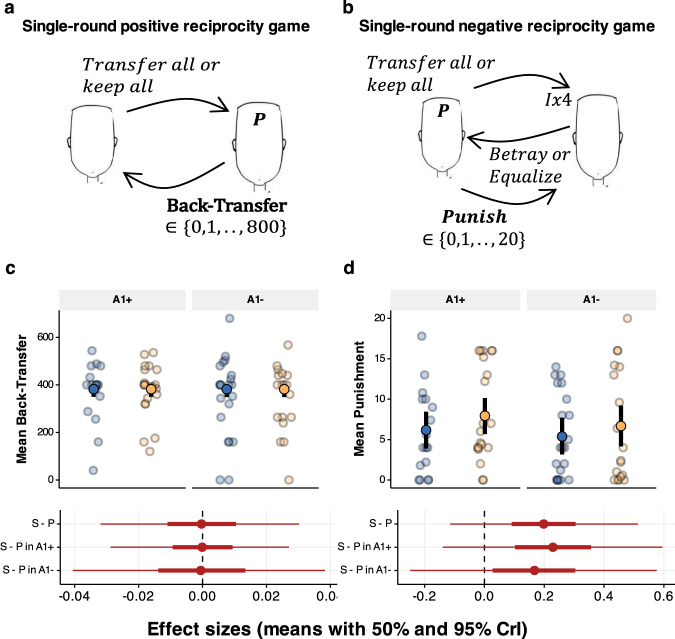
The ability to learn about other people is crucial for human social functioning. Dopamine has been proposed to regulate the precision of beliefs, but direct behavioural evidence of this is lacking. In this study, we investigate how a high dose of the D2/D3 dopamine receptor antagonist sulpiride impacts learning about other people's prosocial attitudes in a repeated Trust game. Using a Bayesian model of belief updating, we show that in a sample of 76 male participants sulpiride increases the volatility of beliefs, which leads to higher precision weights on prediction errors. This effect is driven by participants with genetically conferred higher dopamine availability (Taq1a polymorphism) and remains even after controlling for working memory performance. Higher precision weights are reflected in higher reciprocal behaviour in the repeated Trust game but not in single-round Trust games. Our data provide evidence that the D2 receptors are pivotal in regulating prediction error-driven belief updating in a social context.


Conflict of interest statement

L.C. has received royalties from Cambridge Cognition Ltd. relating to neurocognitive testing. U.M. discloses consultancy for Janssen-Cilag, Lilly, Heptares and Shire, and educational funding from AstraZeneca, Bristol-Myers Squibb, Janssen-Cilag, Lilly, Lundbeck and Pharmacia-Upjohn. T.W.R. discloses consultancy with Cambridge Cognition Ltd and a research grant with Shionogi Inc. The remaining authors declare no competing interests.

Figures

Fig. 1
Fig. 1. Effects of sulpiride on investment updates in the repeated Trust Game.
a The participants played 25 trials with two trustees. Each trial started with an endowment of 10 points to both players. On each trial they could invest any integer between 0 and 10. The trustee received a tripled amount of the investment and could decide to either equalise payoff or betray the other player and keep all the points for himself. The trustees were pre-programmed to be either “good” or “bad”. b Mean and 95% CrI of absolute change of investment from one trial to the next for both treatment groups based on a Bayesian multilevel model, plotted over raw means for each treatment group (), obtained over n = 76 participants, n = 38 in each drug group, and with 2 × 25 trials per participant. Corresponding effect sizes with means, 50% and 95% CrI, for the main effect of sulpiride (S-P), for the effect of sulpiride in the last trial and for the interaction of the drug with Trial variable. c Mean and 95% CrI of reciprocal trials (defined as trials where investment was increased following positive feedback, or decreased following negative feedback) based on a Bayesian logistic multilevel model, plotted over raw proportion of reciprocal trials with standard errors for each participant (sample sizes as in b). Effect sizes in log-odds shown for the main effect of sulpiride as well as the effect of sulpiride within each genotype group.
Fig. 2
Fig. 2. Effects of sulpiride on average investments in the repeated Trust Game.
a Average investment behaviour grouped for each trustee. Lines depict model predictions (means with 95% CrI as the shaded area), plotted over raw means for each drug group (), obtained for 2 × 25 trials per participant, n = 76 participants (in A1+ group, n = 17 placebo, n = 21 sulpiride, and in A1- group n = 21 placebo and n = 17 sulpiride). We found no credible evidence for an effect of sulpiride in either genotype group on average investment behaviour regardless of the trustee. For statistics, refer to the main text and Supplementary Fig. 2. b Overall points earned in the task grouped for each trustee. Dots are average points earned for each participant. Boxplots with centre lines as medians, box bounds as 25th and 75th percentiles, and whiskers terminating at maxima/minima (a distance of 1.5 times the IQR away from the 25th and 75th percentiles). Sample sizes as in (a).
Fig. 3
Fig. 3. Computational modelling.
a We defined a generative model that describes the evolution of participants’ beliefs about the other person’s trustworthiness as a Gaussian random walk with the step size of ω. The hierarchical Gaussian filter (HGF) inverts this model and provides trial-level estimations of participants’ beliefs about the trustworthiness of others as Gaussian variables with mean μt and standard deviation σt. The evolution of σt is determined by the belief volatility parameter ω. The precision-weights ψ(t) are proportional to σt and serve as dynamic learning rates when updating beliefs about the trustworthiness of the other player. We also estimate initial trustworthiness belief per participant (μ0). The ordinal logistic link function governs how beliefs about others’ trustworthiness map to investments with two additional subject-level parameters: choice uncertainty (γ) and the slope (η). The parameter estimation is done through hierarchical Bayesian inference, where we estimate all individual and group-level parameters in one inferential step. b Two example belief trajectories portray the different behaviours that the model can capture, depicted as mean (μt, line) and standard deviation of beliefs (σt, error band). The participants have different belief volatilities for the good (ωgood) and the bad trustee (ωbad). Higher ω implies more uncertainty surrounding the trustworthiness beliefs (σt), which in turn leads to stronger belief shifts. c For each participant, we randomly draw parameters from their individual posterior distribution, simulate data, and re-estimate them five times. Relative high correlations indicate that the model parameters are well-defined. d The two main parameters of interest, belief volatility and choice uncertainty, correlate with distinct behavioural features, obtained for all participants (n = 76). e,f Posterior predictive for (e) absolute investment change from one trial to the next and (f) for the average investment behaviour. Plotted over raw means per trial per group and with standard deviations of predictions in the shaded area. g Lines depict average beliefs about the trustworthiness across participants for each trials, with error bands depicting average uncertainty around the investment (σ). All plots in (e–g) obtained with the following sample sizes: in A1+ group, n = 17 placebo, n = 21 sulpiride, and in A1- group n = 21 placebo and n = 17 sulpiride.
Fig. 4
Fig. 4. Effects of sulpiride on belief volatility and precision weights.
a Belief volatility boxplots over individual means of posterior distributions. Boxplots with centre lines as medians, box bounds as 25th and 75th percentiles, and whiskers terminating at maxima/minima (a distance of 1.5 times the IQR away from the 25th and 75th percentiles). Sample sizes in A1+ group, n = 17 placebo, n = 21 sulpiride, and in A1- group n = 21 placebo and n = 17 sulpiride. Belief volatility is higher in the sulpiride group, and this effect is driven by the A1+ group (50% and 95% CrI of effect sizes below). b Precision-weights on PEs. Scattered points are meaned precision weights across all trials for each participant (sample sizes as in a). Overlayed group level medians with 50% and 95% CrI. The effect sizes were calculated from posterior distributions of differences in means across four groups. c Precision weights correlate with log transformed serum levels in the blood, plotted for participants in the A1+ group that received sulpiride (n = 21). The effect sizes with means (and 50% and 95% CrI) depict correlations between serum levels and median precision weights for the sulpiride group (n = 38), and then separately for the A1+ genotype group (n = 21) and for the A1- genotype group (n = 17).
Fig. 5
Fig. 5. Effect of sulpiride on choice precision.
a Effects of sulpiride on choice uncertainty, estimated in log – space (hence the prime). Dots are participant-level posterior means. The 95% and 50% CrI of effect sizes show a main effect of sulpiride, driven by the A1- group. Boxplots with centre lines as medians, box bounds as 25th and 75th percentiles, and whiskers terminating at maxima/minima (a distance of 1.5 times the IQR away from the 25th and 75th percentiles). Sample sizes in A1+ group, n = 17 placebo, n = 21 sulpiride, and in A1- group n = 21 placebo and n = 17 sulpiride. b Mean proportion of mistake trials (with SEM), with samples sizes as in (a). Means and 95% quantiles of posterior distributions across the four groups are plotted based on a logistic regression model. Corresponding effect sizes below. c, d The choice uncertainty parameter determines the probability weight (c) and therefore the investment distribution (d). Higher values for the placebo group (the A1 group in particular) indicate more extreme investment choices and higher belief inflexibility.
Fig. 6
Fig. 6. Working memory performance and computational parameters.
a We reran the parameter estimation with a multilevel model that only included working memory data (number of errors) at the group level effect (and was agnostic about drug and genotype groups). Poorer performance in the spatial working memory task correlated positively with belief volatility ω and negatively with choice precision γ and did not affect noise or initial trustworthiness (obtained from sample size n = 75). Effect sizes depicted with means, 50% and 95% CrIs. b Residual variances after accounting for working memory data from the model that is agnostic about drug and genotype data, for parameters ω and γ. Boxplots with centre lines as medians, box bounds as 25th and 75th percentiles, and whiskers terminating at maxima/minima (a distance of 1.5 times the IQR away from the 25th and 75th percentiles), with the following samples: in A1+ group, n = 16 placebo, n = 21 sulpiride, and in A1− group n = 21 placebo and n = 17 sulpiride. In the second step, the parameters were estimated with working memory data and drug and genotype variables at the group level. The results of this analysis are shown below as effect sizes with means, 50% and 95% CrIs. The analysis is compared to that with the model that does not include working memory data.
Fig. 7
Fig. 7. Single-round reciprocity games.
a In the positive reciprocity task, participants played as trustees were paired with 7 other players. The investor in this version of the game received 800 points and could either keep everything or give everything to the trustee, who could then decide how to split the points. The investors were pre-programmed so that 5 out of 7 transferred everything to the trustee. b In the single-round negative reciprocity game, the participants played the investor. In the beginning of the round both players were given 10 points. The investor could then decide to transfer everything or nothing. The transferred investment got multiplied by a factor of four and the trustee could them decide to either equalise or betray. Crucially, after the choice of the trustee, both players received another 20 points and the investor could use his points to punish the trustee, with a factor of three. c, d Mean and 95% CrI of Back-transfer (c) and punishment (d) across the four groups, plotted over raw means (±SEM) per participant. Means, 50%, and 95% CrIs of effect sizes shown below, with the following sample sizes: in A1+ group, n = 17 placebo, n = 21 sulpiride, and in A1− group n = 21 placebo and n = 17 sulpiride.

Similar articles

Cited by

References

    1. Meyer-Lindenberg A, Tost H. Neural mechanisms of social risk for psychiatric disorders. Nat. Neurosci. 2012;15:663–668. doi: 10.1038/nn.3083. - DOI - PubMed
    1. Wellstein KV, et al. Inflexible social inference in individuals with subclinical persecutory delusional tendencies. Schizophr. Res. 2020;215:344–351. doi: 10.1016/j.schres.2019.08.031. - DOI - PubMed
    1. Gromann PM, et al. Trust versus paranoia: Abnormal response to social reward in psychotic illness. Brain. 2013;136:1968–1975. doi: 10.1093/brain/awt076. - DOI - PubMed
    1. Diaconescu AO, Wellstein KV, Kasper L, Mathys CD, Stephan KE. Hierarchical bayesian models of social inference for probing persecutory delusional ideation. J. Abnorm. Psychol. 2020;129:556–569. doi: 10.1037/abn0000500. - DOI - PubMed
    1. FeldmanHall O, Shenhav A. Resolving uncertainty in a social world. Nat. Hum. Behav. 2019;3:426–435. doi: 10.1038/s41562-019-0590-x. - DOI - PMC - PubMed

Publication types