. 2023 Jul 8;9(1):234.
doi: 10.1038/s41420-023-01522-x.

SCP2 mediates the transport of lipid hydroperoxides to mitochondria in chondrocyte ferroptosis

Affiliations

SCP2 mediates the transport of lipid hydroperoxides to mitochondria in chondrocyte ferroptosis

Tianming Dai et al. Cell Death Discov. .

Abstract

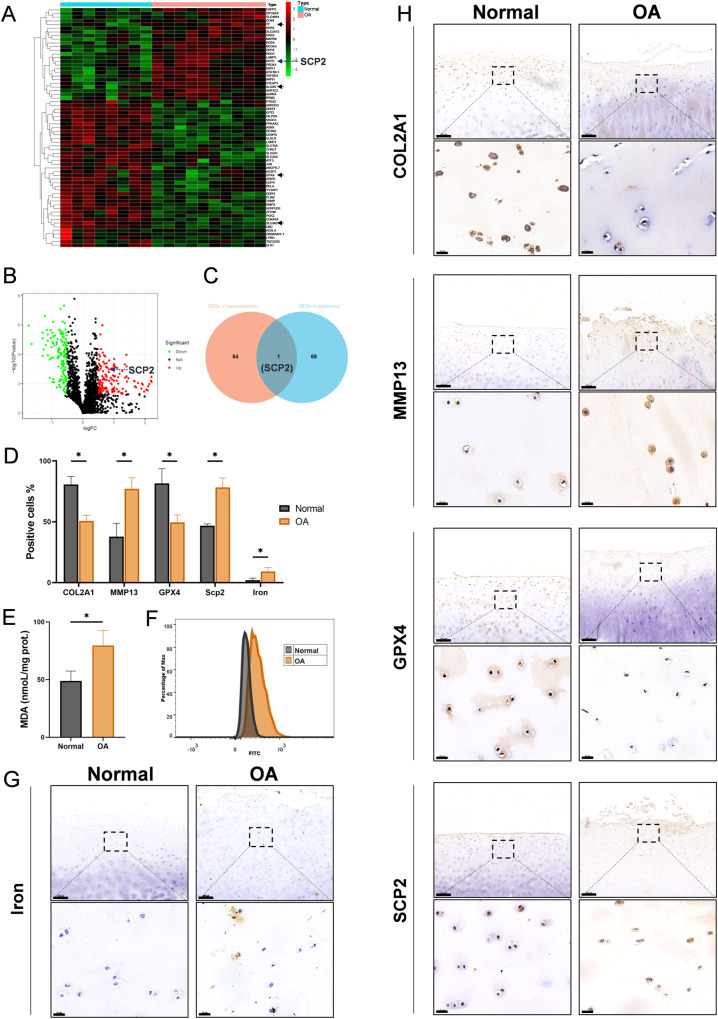
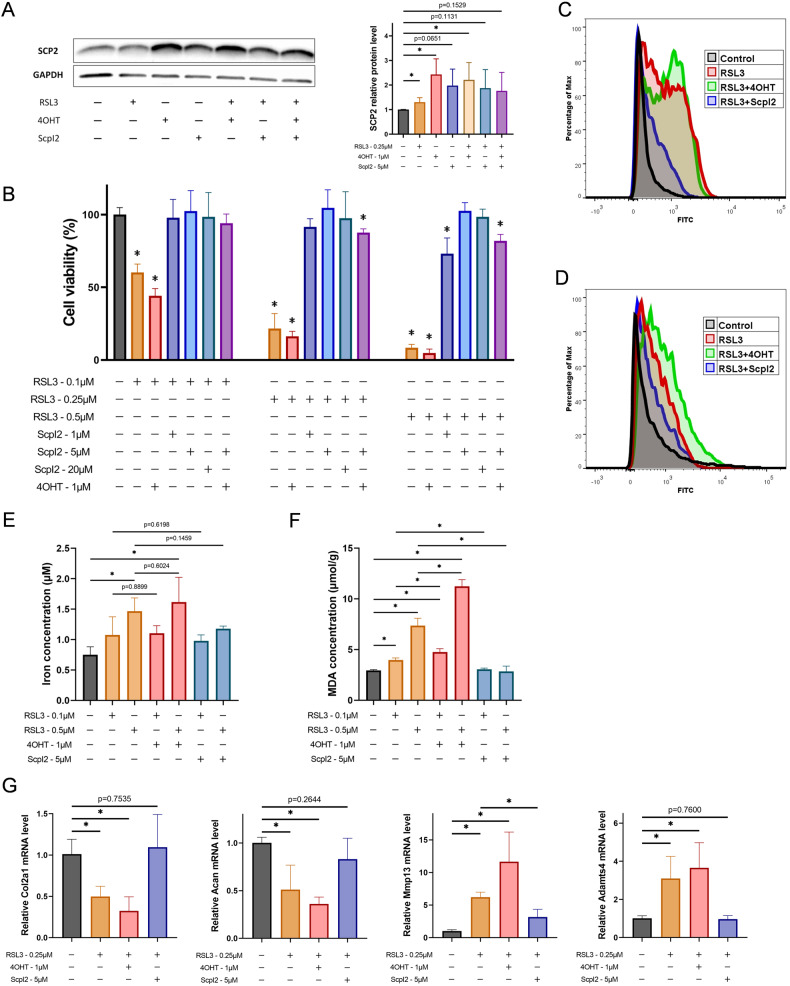
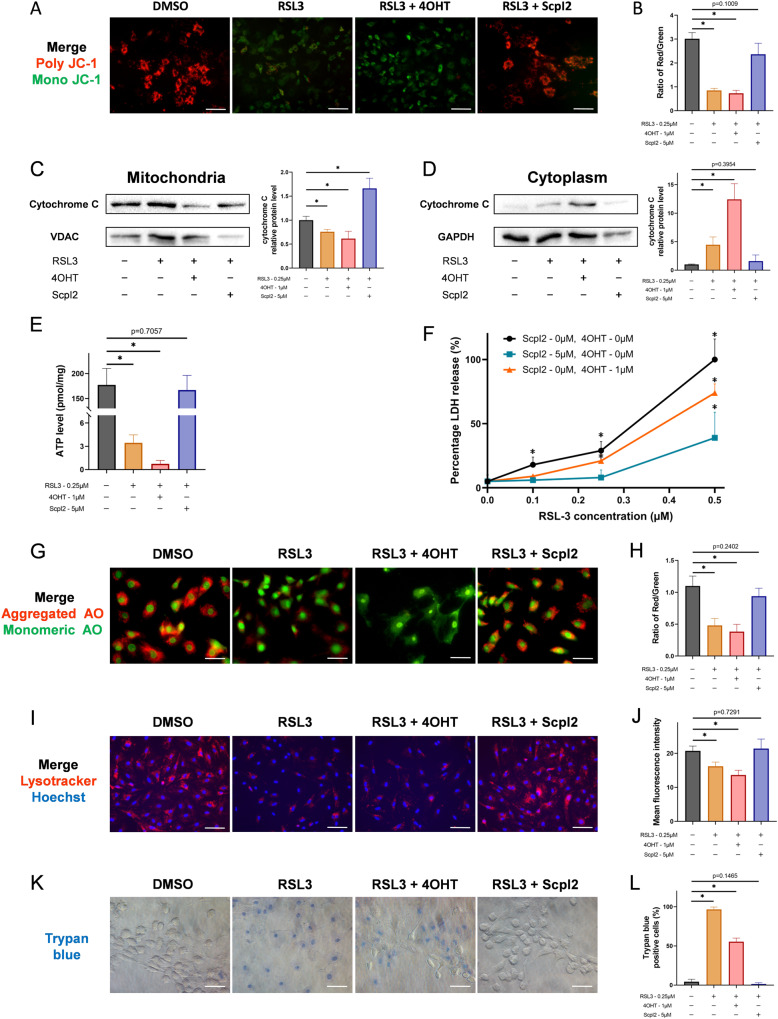
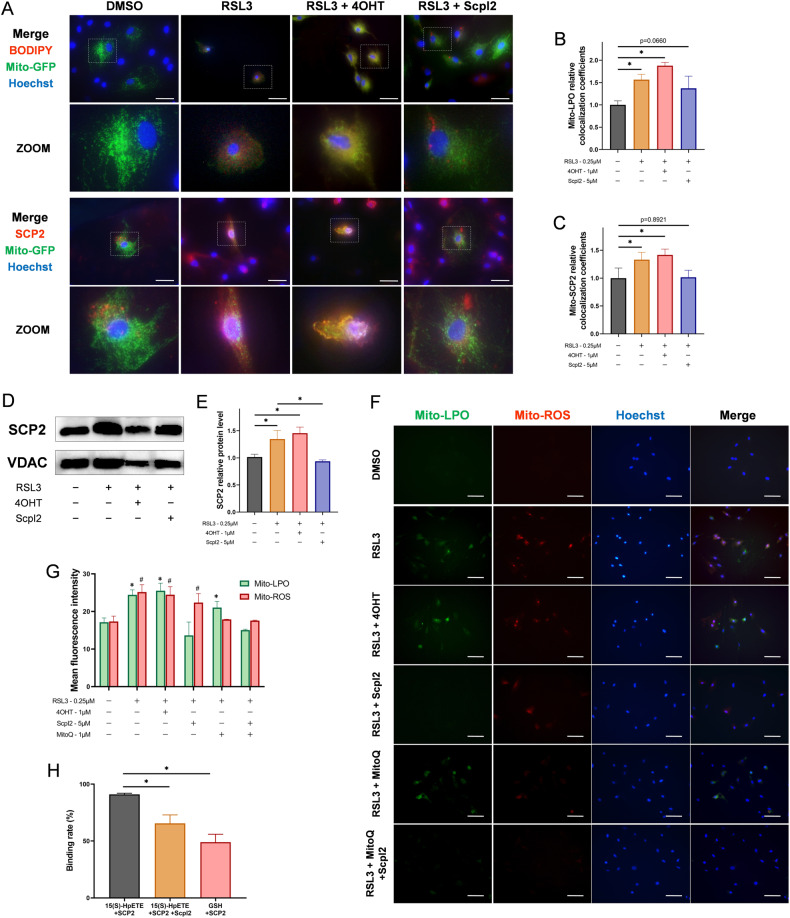
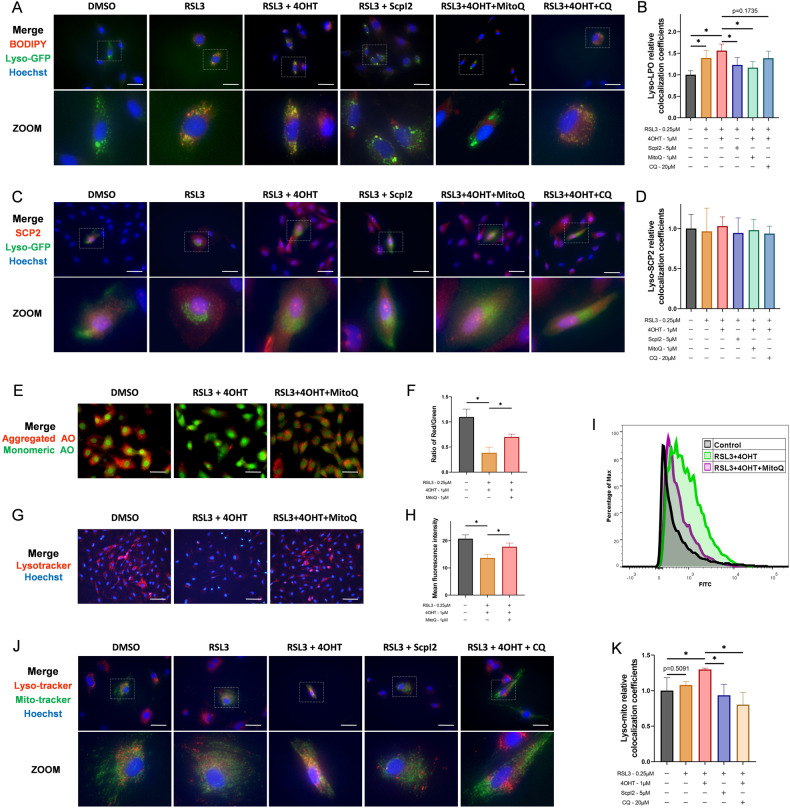
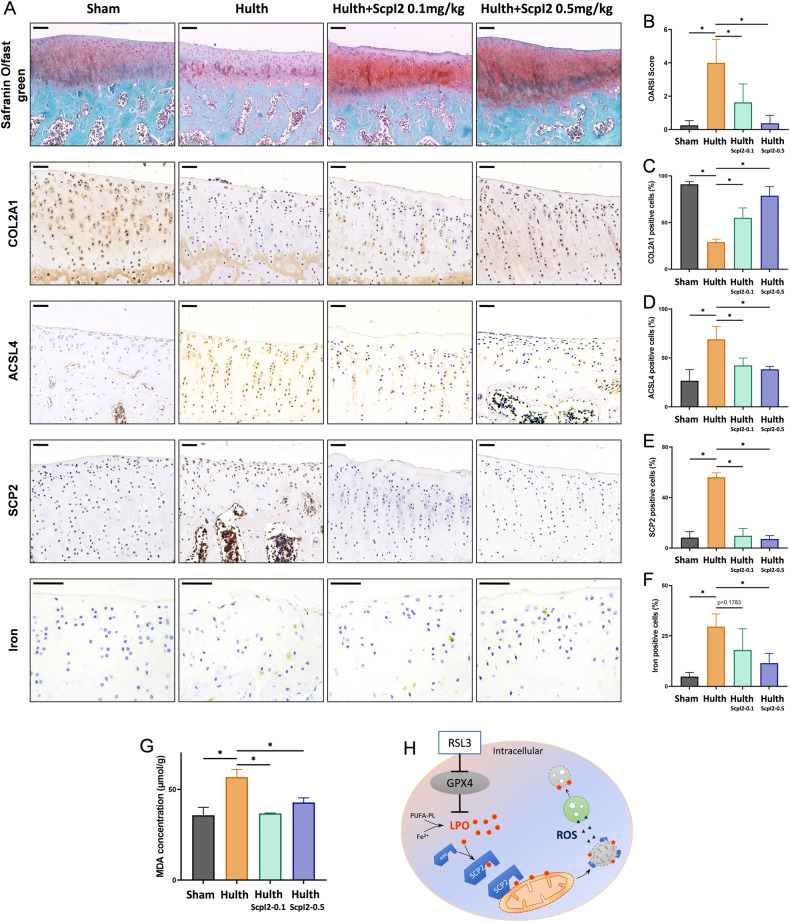
Sterol carrier protein 2 (SCP2) is highly expressed in human osteoarthritis (OA) cartilage, accompanied by ferroptosis hallmarks, especially the accumulation of lipid hydroperoxides (LPO). However, the role of SCP2 in chondrocyte ferroptosis remains unexplored. Here, we identify that SCP2 transports cytoplasmic LPO to mitochondria in RSL3-induced chondrocyte ferroptosis, resulting in mitochondrial membrane damage and release of reactive oxygen species (ROS). The localization of SCP2 on mitochondria is associated with mitochondrial membrane potential, but independent of microtubules transport or voltage-dependent anion channel. Moreover, SCP2 promotes lysosomal LPO increase and lysosomal membrane damage through elevating ROS. However, SCP2 is not directly involved in the cell membrane rupture caused by RSL3. Inhibition of SCP2 markedly protects mitochondria and reduces LPO levels, attenuating chondrocyte ferroptosis in vitro and alleviating the progression of OA in rats. Our study demonstrates that SCP2 mediates the transport of cytoplasmic LPO to mitochondria and the spread of intracellular LPO, accelerating chondrocyte ferroptosis.


Conflict of interest statement

The authors declare no competing interests.

Figures

Fig. 1
Fig. 1. SCP2 expression is upregulated in human OA cartilage with ferroptosis.
A Transcription levels of 66 ferroptosis-related differentially expressed genes in human OA cartilage (n = 10 per group) compared with those in normal cartilage (n = 8 per group). B The differentially expressed proteins in the synovial fluid from rabbit joints were analyzed by volcano plots between injured cartilage (n = 3 per group) and normal cartilage (n = 3 per group). C Venn diagram showed the overlapped DEGs between transcriptomics and proteomics. D Positive cell proportions (%) of immunohistochemistry staining and iron staining in human OA (n = 5 per group) and normal (n = 3 per group) cartilage. E MDA contents of human primary chondrocytes from OA (n = 5 per group) and normal (n = 3 per group) cartilage. F Flow cytometry analysis of lipid peroxides level of human primary chondrocytes from OA (n = 5 per group) and normal (n = 3 per group) cartilage. G Cartilage sections were stained with DAB-enhanced Prussian blue to detect iron in human OA (n = 5 per group) and normal (n = 3 per group) cartilage. Scale bar, 200 μm (top), 20 μm (bottom). H Immunohistochemistry staining of COL2A1, MMP13, GPX4, and SCP2 in human OA (n = 5 per group) and normal (n = 3 per group) cartilage. Scale bar, 200 μm (top), 20 μm (bottom). Data are expressed as means + SD. Unpaired two-tailed t tests, *P < 0.05.
Fig. 2
Fig. 2. SCP2 regulates lipid peroxidation in RSL3-induced chondrocyte ferroptosis.
A Western blot of SCP2 in rat chondrocytes after indicated treatment: 4OHT (1 μM) for 24 h to induce SCP2, then added RSL3 (0.25 μM) or ScpI2 (5 μM) for 4 h (n = 3 per group). B Chondrocyte viability was quantified by CCK-8 post indicated treatment: 4OHT (1 μM) was added 24 h before other treatment for induction of SCP2, then chondrocytes were treated with RSL3 and rescued by ScpI2 for 4 h (n = 3 per group). C Flow cytometry analysis of lipid peroxides level of rat chondrocytes after RSL3 (0.25 μM), 4OHT (1 μM), or ScpI2 (5 μM) treatment (n = 3 per group). D Flow cytometry analysis of ROS level of rat chondrocytes after RSL3 (0.25 μM), 4OHT (1 μM), or ScpI2 (5 μM) treatment (n = 3 per group). E Iron concentration of rat chondrocytes after RSL3, 4OHT, or ScpI2 treatment (n = 3 per group). F MDA concentration of rat chondrocytes after RSL3, 4OHT, or ScpI2 treatment (n = 3 per group). G Quantification of mRNA levels for Col2a1, Acan, Mmp13 and Adamts4 after RSL3, 4OHT, or ScpI2 treatment using qRT-PCR (n = 3 per group). Data are expressed as means + SD. For (B), compared to blank group. Unpaired two-tailed t tests, *P < 0.05.
Fig. 3
Fig. 3. SCP2 mediates the membrane damage of mitochondria and lysosomes.
A Mitochondrial membrane potential of rat chondrocytes treated with RSL3 (0.25 μM), 4OHT (1 μM), or ScpI2 (5 μM) detected by JC-1 staining. Scale bar, 100 μm. B The mean intensity ratio of red fluorescence to green fluorescence in JC-1 staining (n = 3 per group). C Western blot of cytochrome C and VDAC in mitochondria after RSL3, 4OHT, or ScpI2 treatment (n = 3 per group). D Western blot of cytochrome C and GAPDH in cytoplasm after RSL3, 4OHT, or ScpI2 treatment (n = 3 per group). E ATP levels of rat chondrocytes after RSL3, 4OHT, or ScpI2 treatment (n = 3 per group). F Percentage of LDH release (%) of rat chondrocytes after RSL3, 4OHT, or ScpI2 treatment (n = 3 per group). G Lysosomal membrane permeabilization of rat chondrocytes treated with RSL3 (0.25 μM), 4OHT (1 μM), or ScpI2 (5 μM) detected by acridine orange staining. Scale bar, 50 μm. H The mean intensity ratio of red fluorescence to green fluorescence in acridine orange staining (n = 3 per group). I Lysosomes staining in rat chondrocytes treated with RSL3 (0.25 μM), 4OHT (1 μM), or ScpI2 (5 μM) detected by lyso-tracker red. Scale bar, 100 μm. J The mean fluorescence intensity in lyso-tracker red staining (n = 3 per group). K Trypan blue staining of rat chondrocytes under RSL3 (0.25 μM), 4OHT (1 μM), or ScpI2 (5 μM) treatment. Scale bar, 50 μm. L Positive cell proportions (%) in trypan blue staining (n = 3 per group). Data are expressed as means + SD. Unpaired two-tailed t tests, *P < 0.05.
Fig. 4
Fig. 4. SCP2 transports cytoplasmic LPO to mitochondria.
A The merged images of BODIPY 665/676, CellLight-mito-GFP, and Hoechst 33258 staining in rat chondrocytes treated with RSL3 (0.25 μM), 4OHT (1 μM), or ScpI2 (5 μM) were shown in the upper part. The merged images of immunofluorescence SCP2, CellLight-mito-GFP, and Hoechst 33258 staining in rat chondrocytes were shown in the lower part. Scale bar, 50 μm. B The relative colocalization coefficients of mitochondria and LPO with mito-GFP and BODIPY staining (n = 6 per group). C The relative colocalization coefficients of mitochondria and SCP2 with mito-GFP and immunofluorescence staining (n = 6 per group). D Western blot of SCP2 and VDAC in mitochondria after treatment of RSL3 (0.25 μM), 4OHT (1 μM), or ScpI2 (5 μM) (n = 3 per group). E SCP2 relative protein level in mitochondria after indicated treatment (n = 3 per group). F The mito-LPO was stained with Mito-PeDPP, and mito-ROS was stained with MitoSox in rat chondrocytes after RSL3 (0.25 μM), 4OHT (1 μM), MitoQ (1 μM), or ScpI2 (5 μM) treatment. Scale bar, 100 μm. G The mean fluorescence intensity for Mito-LPO staining (compared to blank group of Mito-LPO, *P < 0.05), and Mito-ROS staining (compared to blank group of Mito-ROS, #P < 0.05), n = 6 per group. H The binding rates of SCP2 to 15(S)-HpETE or GSH were detected in phosphate buffered saline by LC-MS/MS (n = 3 per group). Unpaired two-tailed t tests, *P < 0.05.
Fig. 5
Fig. 5. Lysosomal lipid peroxidation was related to ROS but independent of the direct transport of LPO by SCP2.
A The merged images of BODIPY 665/676, CellLight-lyso-GFP, and Hoechst 33258 staining in rat chondrocytes treated with RSL3 (0.25 μM), 4OHT (1 μM), ScpI2 (5 μM), MitoQ (1 μM) or CQ (20 μM). Scale bar, 50 μm. B The relative colocalization coefficients of lysosomes and LPO with lyso-GFP and BODIPY staining (n = 6 per group). C The merged images of immunofluorescence SCP2, CellLight-lyso-GFP, and Hoechst 33258 staining in rat chondrocytes treated with RSL3 (0.25 μM), 4OHT (1 μM), ScpI2 (5 μM), MitoQ (1 μM) or CQ (20 μM). Scale bar, 50 μm. D The relative colocalization coefficients of lysosomes and SCP2 with lyso-GFP and immunofluorescence staining (n = 6 per group). E Lysosomal membrane permeabilization of rat chondrocytes treated with RSL3 (0.25 μM), 4OHT (1 μM), or MitoQ (1 μM) detected by acridine orange staining. Scale bar, 50 μm. F The mean intensity ratio of red fluorescence to green fluorescence in acridine orange staining (n = 3 per group). G Lysosomes staining in rat chondrocytes treated with RSL3 (0.25 μM), 4OHT (1 μM), or MitoQ (1 μM) detected by lyso-tracker red. Scale bar, 100 μm. H The mean fluorescence intensity in lyso-tracker red staining (n = 3 per group). I Flow cytometry analysis of ROS level of rat chondrocytes after RSL3 (0.25 μM), 4OHT (1 μM), or MitoQ (1 μM) treatment (n = 3 per group). J The merged images of Lyso-tracker red, Mito-tracker green, and Hoechst 33258 staining in rat chondrocytes treated with RSL3 (0.25 μM), 4OHT (1 μM), ScpI2 (5 μM), or CQ (20 μM). Scale bar, 50 μm. K The relative colocalization coefficients of mitochondria and lysosomes with Mito-tracker green and Lyso-tracker red staining (n = 6 per group). Data are expressed as means + SD. Unpaired two-tailed t tests, *P < 0.05.
Fig. 6
Fig. 6. Suppression of SCP2 alleviates OA progression in a modified-Hulth rat model.
A Experimental OA was examined by safranin O/fast green, prussian blue (with DAB), immunohistochemistry staining of COL2A1, ACSL4, and SCP2 in the articular cartilage of rats at 5 weeks after surgery (n = 4 per group). Scale bar, 100 μm for safranin O/fast green, 50 μm for the others. B OARSI score based on the results of safranin O/fast green staining (n = 4 per group). C Positive cell proportions (%) of immunohistochemistry staining of COL2A1 in rats' articular cartilage (n = 4 per group). D Positive cell proportions (%) of immunohistochemistry staining of ACSL4 in rats' articular cartilage (n = 4 per group). E Positive cell proportions (%) of immunohistochemistry staining of SCP2 in rats' articular cartilage (n = 4 per group). F Positive cell proportions (%) of iron staining in rats' articular cartilage (n = 4 per group). G MDA concentration of rat articular cartilage (n = 4 per group). H The schematic diagram for SCP2 mediating the transport of lipid peroxides to mitochondria and causing secondary damage to lysosomes during ferroptosis. Data are expressed as means + SD. Unpaired two-tailed t tests, *P < 0.05.

Similar articles

Cited by

References

    1. Yang J, Hu S, Bian Y, Yao J, Wang D, Liu X, et al. Targeting cell death: pyroptosis, ferroptosis, apoptosis and necroptosis in osteoarthritis. Front Cell Dev Biol. 2021;9:789948. doi: 10.3389/fcell.2021.789948. - DOI - PMC - PubMed
    1. Hunter DJ, Schofield D, Callander E. The individual and socioeconomic impact of osteoarthritis. Nat Rev Rheumatol. 2014;10:437–41. doi: 10.1038/nrrheum.2014.44. - DOI - PubMed
    1. Martel-Pelletier J, Barr AJ, Cicuttini FM, Conaghan PG, Cooper C, Goldring MB, et al. Osteoarthritis. Nat Rev Dis Primers. 2016;2:16072. doi: 10.1038/nrdp.2016.72. - DOI - PubMed
    1. Hunter DJ, Bierma-Zeinstra S. Osteoarthritis. The Lancet (British edition) 2019;393:1745–59.. - PubMed
    1. Charlier E, Relic B, Deroyer C, Malaise O, Neuville S, Collée J, et al. Insights on molecular mechanisms of chondrocytes death in osteoarthritis. Int J Mol Sci. 2016;17:2146. doi: 10.3390/ijms17122146. - DOI - PMC - PubMed