. 2023 Jul 8;14(1):4054.
doi: 10.1038/s41467-023-39784-9.

DNA 5-methylcytosine detection and methylation phasing using PacBio circular consensus sequencing

Affiliations

DNA 5-methylcytosine detection and methylation phasing using PacBio circular consensus sequencing

Peng Ni et al. Nat Commun. .

Abstract

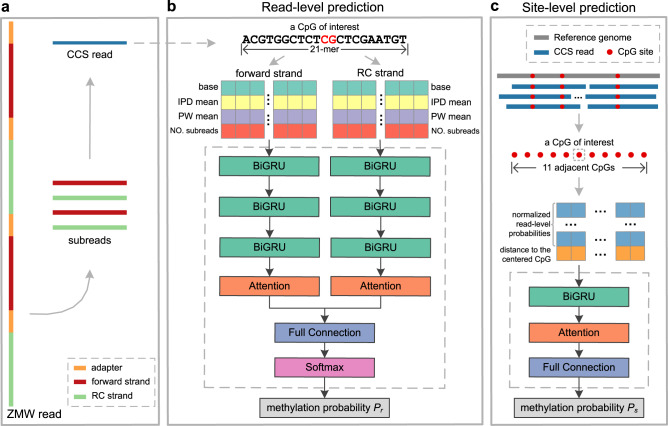
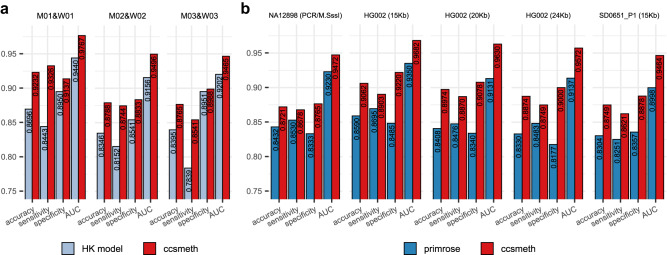
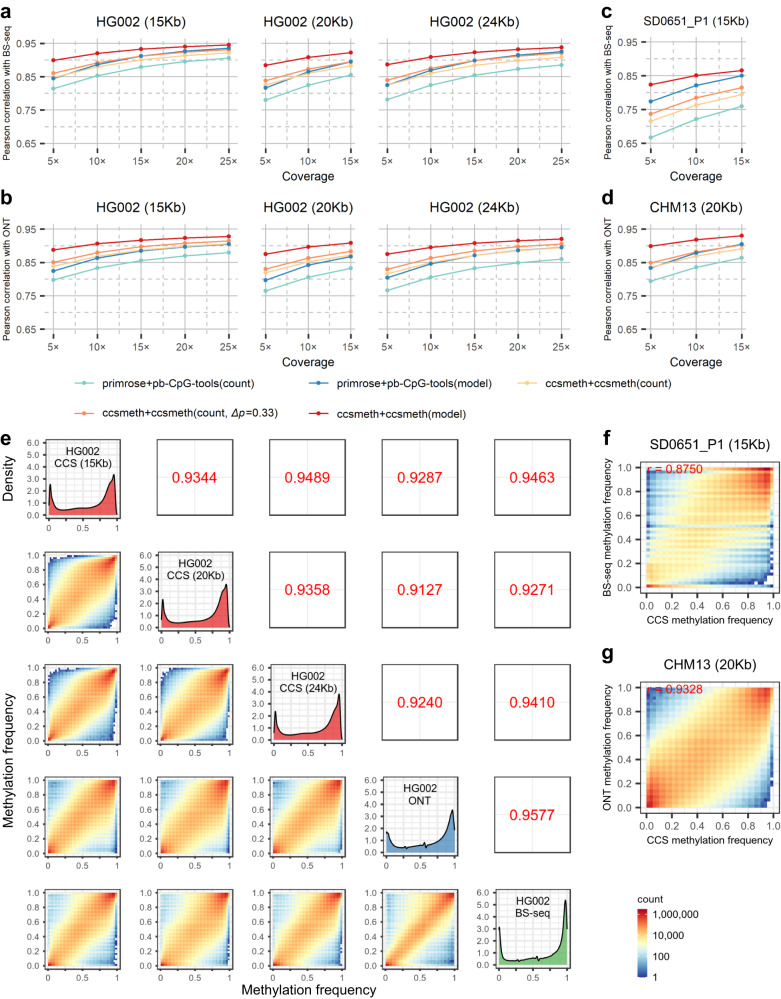
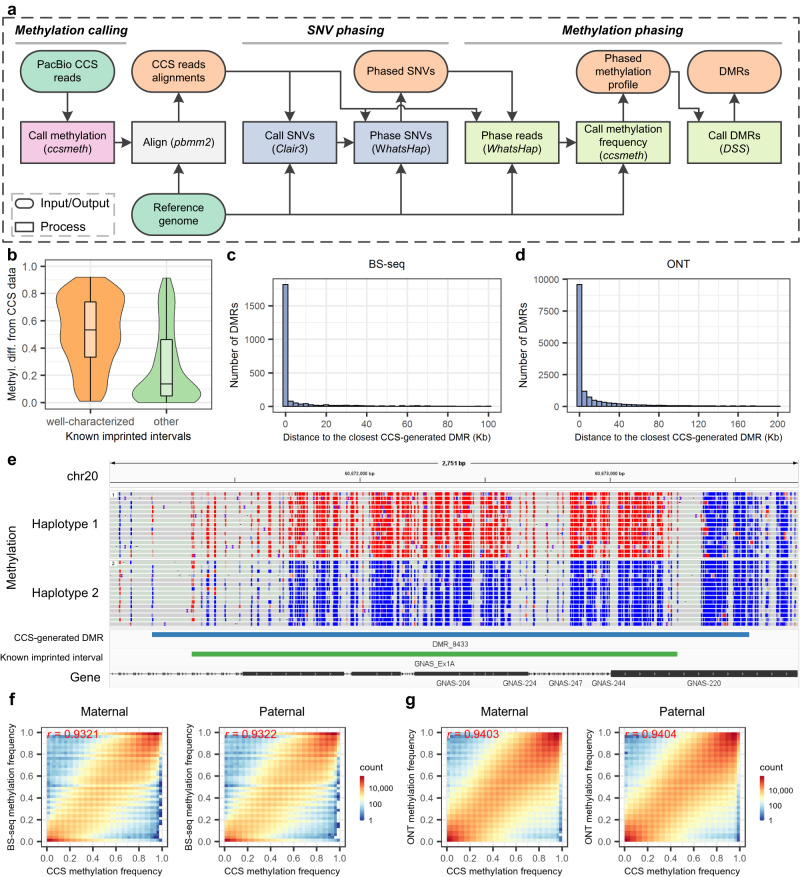
Long single-molecular sequencing technologies, such as PacBio circular consensus sequencing (CCS) and nanopore sequencing, are advantageous in detecting DNA 5-methylcytosine in CpGs (5mCpGs), especially in repetitive genomic regions. However, existing methods for detecting 5mCpGs using PacBio CCS are less accurate and robust. Here, we present ccsmeth, a deep-learning method to detect DNA 5mCpGs using CCS reads. We sequence polymerase-chain-reaction treated and M.SssI-methyltransferase treated DNA of one human sample using PacBio CCS for training ccsmeth. Using long (≥10 Kb) CCS reads, ccsmeth achieves 0.90 accuracy and 0.97 Area Under the Curve on 5mCpG detection at single-molecule resolution. At the genome-wide site level, ccsmeth achieves >0.90 correlations with bisulfite sequencing and nanopore sequencing using only 10× reads. Furthermore, we develop a Nextflow pipeline, ccsmethphase, to detect haplotype-aware methylation using CCS reads, and then sequence a Chinese family trio to validate it. ccsmeth and ccsmethphase can be robust and accurate tools for detecting DNA 5-methylcytosines.


Conflict of interest statement

The authors declare no competing interests.

Figures

Fig. 1
Fig. 1. ccsmeth for 5mCpG detection using PacBio CCS reads.
a Illustration of PacBio CCS. b, c Schema of ccsmeth to predict CpG methylation at read level and site level. RC reverse complement, BiGRU Bidirectional Gated Recurrent Unit layer, Full Connection fully connected layer, Softmax Softmax layer.
Fig. 2
Fig. 2. Evaluation of ccsmeth on 5mCpG detection at read level.
a Comparing ccsmeth and HK model on three datasets of PCR-treated and M.SssI-treated human DNA. b Comparing ccsmeth and primrose on NA12898 (10 Kb, PCR/M.SssI-treated), HG002 (15 Kb, 20 Kb, 24 Kb), and SD0651_P1 (15 Kb) CCS reads. Values in the figure are the average of 5 repeated tests. AUC area under the curve. The standard deviation values of the multiple repeated tests are in Supplementary Table 4. Source data are provided as a Source Data file.
Fig. 3
Fig. 3. Evaluation of ccsmeth on 5mCpG detection at genome-wide site level.
a–d Comparing ccsmeth and primrose/pb-CpG-tools against BS-seq and nanopore sequencing under different coverages of HG002, SD0651_P1, and CHM13 CCS reads. p: Difference absolute value between methylated and unmethylated probabilities. Values are the average of 5 repeated tests. The standard deviation values of the multiple repeated tests are in Supplementary Tables 5–12. e Evaluation of ccsmeth model mode against BS-seq and nanopore sequencing using total CCS reads of HG002 (15Kb) (25.6×), HG002 (20 Kb) (17.0×), and HG002 (24 Kb) (28.4×), respectively. Values in upper triangles are Pearson correlations. CCS PacBio CCS sequencing; ONT nanopore sequencing, BS-seq bisulfite sequencing. f Evaluation of ccsmeth model mode against BS-seq using total 19.6× SD0651_P1 (15 Kb) CCS reads. r: Pearson correlation. g Evaluation of ccsmeth model mode against nanopore sequencing using total 16.5× CHM13 (20 Kb) CCS reads. Source data underlying a, b, c, and d are provided as a Source Data file.
Fig. 4
Fig. 4. Methylation phasing of ccsmethphase using the HG002 CCS data.
a Pipeline of ccsmethphase for calling haplotype-aware methylation using CCS data. b Distribution of methylation differences of known imprinted intervals calculated using CCS data between two haplotypes of HG002. 96 out of 102 “well-characterized” intervals, and 95 out of 102 “other” intervals which have at least 5 CpGs covered by CCS reads in each haplotype are analyzed. The boxes inside the violin plots indicate 50th percentile (middle line), 25th and 75th percentile (box), the smallest value within 1.5 times interquatile range below 25th percentile and largest value within 1.5 times interquatile range above 75th percentile (whiskers). c, d Distribution of the number of BS-seq-generated and ONT-generated DMRs in terms of distance to the closest CCS-generated DMR. e Screenshot of Integrative Genomics Viewer (chr20:60,671,001-60,673,750) on a DMR of HG002 near the maternally imprinted gene GNAS. Red and blue dots represent CpGs with high and low methylation probabilities, respectively. f, g Comparing of PacBio CCS with BS-seq and nanopore sequencing on site-level methylation frequencies of maternal and paternal haplotypes phased by Illumina trio data. Methyl. diff. methylation difference, r: Pearson correlation, ONT nanopore sequencing. Source data underlying b, c, and d are provided as a Source Data file.
Fig. 5
Fig. 5. Comparison of the number of CpGs detected/phased by using CCS/BS-seq/nanopore sequencing in the human genome.
a The number of CpGs in autosomes and sex chromosomes detected by using difference coverage of HG002 CCS reads. Values for 5×–70× are the average of 5 repeated tests. b Comparison of the number of CpGs detected by the total HG002 BS-seq (117.5×), ONT (65.8×), and CCS (71.0×) reads in repeats annotated by RepeatMasker, segmental duplications, and peri/centromeric regions of autosomes and sex chromosomes. CpGs covered by at least 5 reads are analyzed. c The number of CpGs in autosomes phased by using difference coverage of HG002 CCS reads. Values for 5×-70× are the average of 5 repeated tests. d Comparison of the number of CpGs phased by using the total HG002 BS-seq (117.5×), ONT (65.8×), and CCS (71.0×) reads in repeats annotated by RepeatMasker, segmental duplications, and peri/centromeric regions of autosomes. CpGs covered by at least 5 phased reads are analyzed. The standard deviation values of the multiple repeated tests of figures a and c are in Supplementary Tables 14–15. Values in the titles of Venn graphs in sub-figures b and d are the total number of CpGs in corresponding regions of the T2T-CHM13 genome. cov. coverage, SDs segmental duplications, cenSats peri/centromeric satellites. Source data underlying a and c are provided as a Source Data file.

References

    1. Breiling A, Lyko F. Epigenetic regulatory functions of DNA modifications: 5-methylcytosine and beyond. Epigenetics Chromatin. 2015;8:1–9. doi: 10.1186/s13072-015-0016-6. - DOI - PMC - PubMed
    1. Greenberg MVC, Bourc’his D. The diverse roles of DNA methylation in mammalian development and disease. Nat. Rev. Mol. Cell Biol. 2019;20:590–607. doi: 10.1038/s41580-019-0159-6. - DOI - PubMed
    1. Gonzalo S. Epigenetic alterations in aging. J. Appl. Physiol. 2010;109:586–597. doi: 10.1152/japplphysiol.00238.2010. - DOI - PMC - PubMed
    1. Foox J, et al. The SEQC2 epigenomics quality control (EpiQC) study. Genome Biol. 2021;22:332. doi: 10.1186/s13059-021-02529-2. - DOI - PMC - PubMed
    1. Frommer M, et al. A genomic sequencing protocol that yields a positive display of 5-methylcytosine residues in individual DNA strands. Proc. Natl Acad. Sci. 1992;89:1827–1831. doi: 10.1073/pnas.89.5.1827. - DOI - PMC - PubMed

Publication types