. 2023 Jul 8;22(1):107.
doi: 10.1186/s12943-023-01803-0.

Combined proteomics and CRISPR‒Cas9 screens in PDX identify ADAM10 as essential for leukemia in vivo

Affiliations

Combined proteomics and CRISPR‒Cas9 screens in PDX identify ADAM10 as essential for leukemia in vivo

Ehsan Bahrami et al. Mol Cancer. .

Abstract

Background: Acute leukemias represent deadly malignancies that require better treatment. As a challenge, treatment is counteracted by a microenvironment protecting dormant leukemia stem cells.

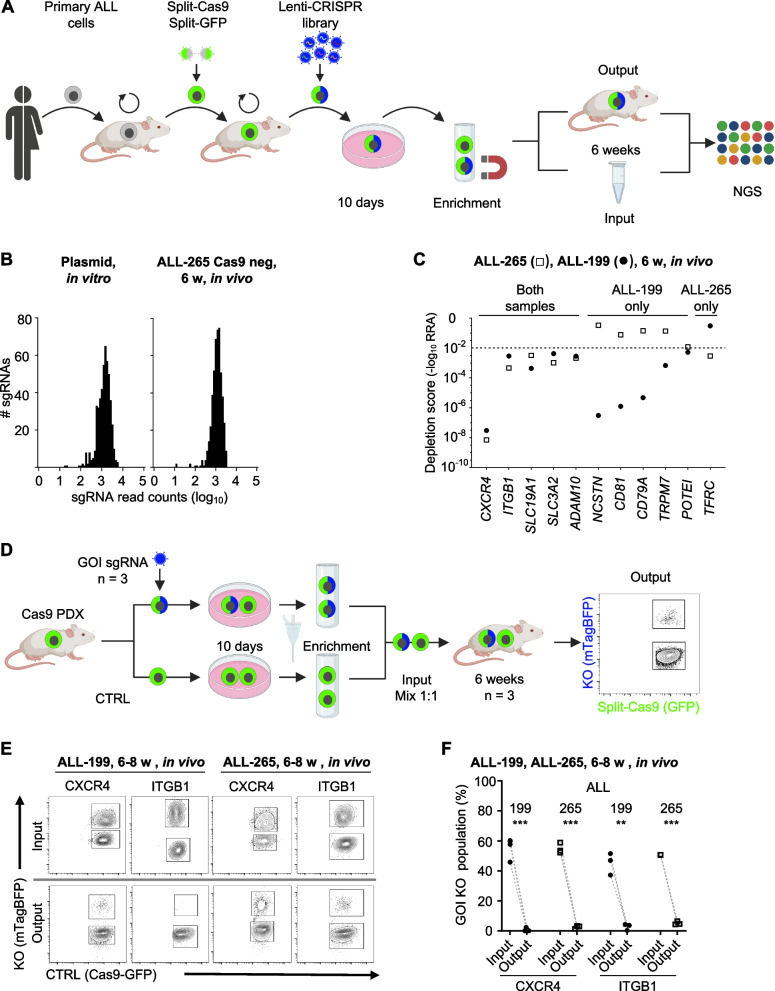
Methods: To identify responsible surface proteins, we performed deep proteome profiling on minute numbers of dormant patient-derived xenograft (PDX) leukemia stem cells isolated from mice. Candidates were functionally screened by establishing a comprehensive CRISPR‒Cas9 pipeline in PDX models in vivo.

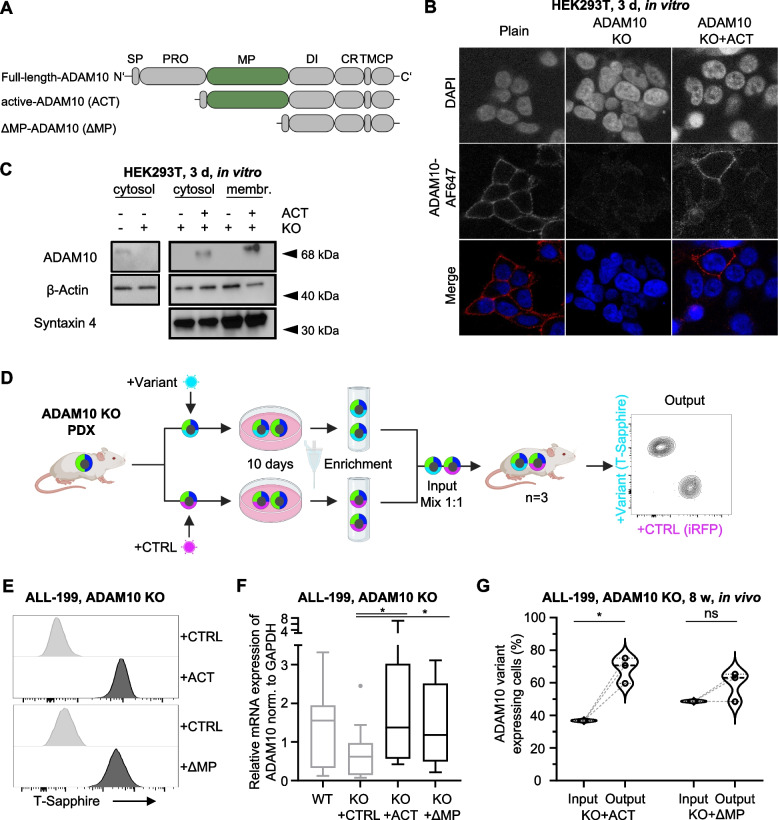
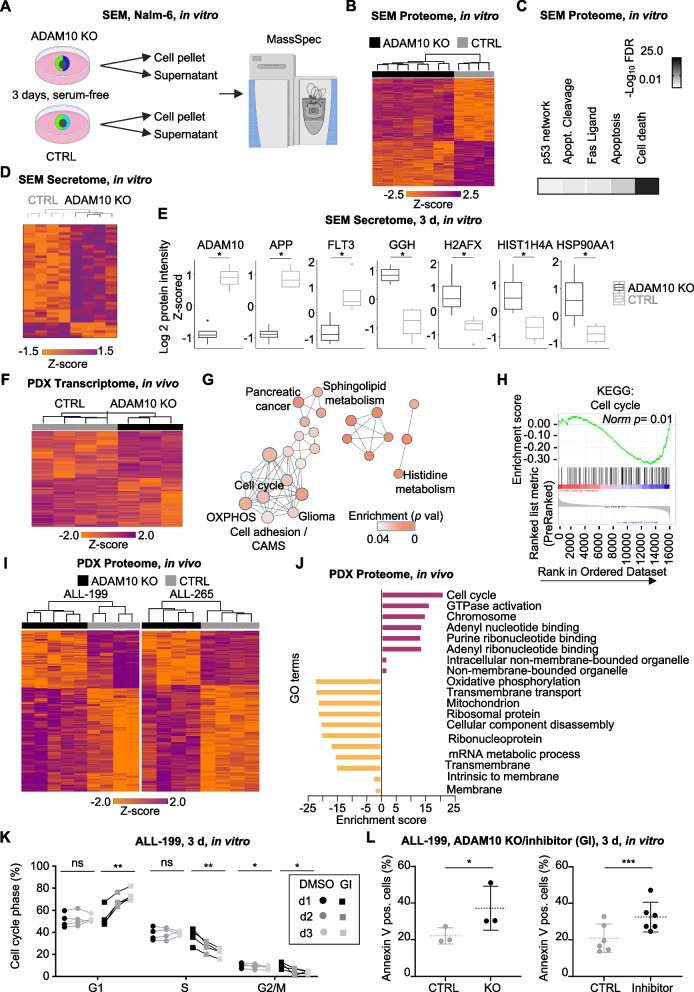
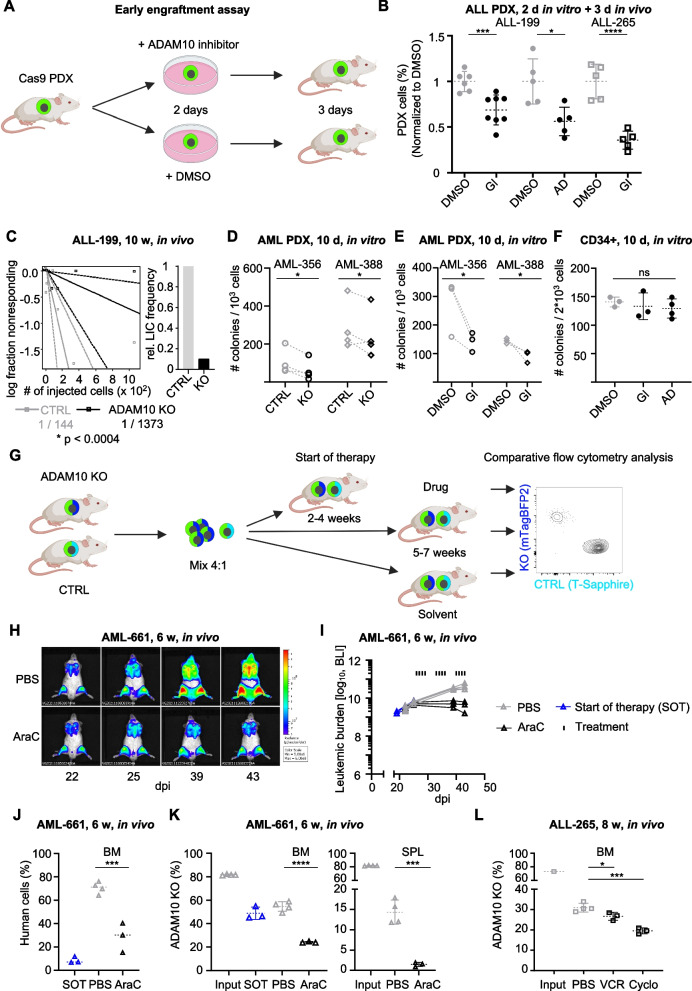
Results: A disintegrin and metalloproteinase domain-containing protein 10 (ADAM10) was identified as an essential vulnerability required for the survival and growth of different types of acute leukemias in vivo, and reconstitution assays in PDX models confirmed the relevance of its sheddase activity. Of translational importance, molecular or pharmacological targeting of ADAM10 reduced PDX leukemia burden, cell homing to the murine bone marrow and stem cell frequency, and increased leukemia response to conventional chemotherapy in vivo.

Conclusions: These findings identify ADAM10 as an attractive therapeutic target for the future treatment of acute leukemias.

Keywords: ADAM10; Acute leukemia; CRISPR-Cas9 in vivo screen; Leukemia stem cells; PDX; Proteomics.


Conflict of interest statement

The authors declare no competing interests.

Figures

Fig. 1
Fig. 1
Ultra-sensitive proteomics reveals regulation of cell adhesion in slow-cycling PDX ALL cells. A Experimental design of LRC proteome by diaPASEF. PDX cells of ALL-199 and ALL-265 were stained with the division-sensitive dye CFSE and transplanted into mice (n = 5 per sample). After 14 days, re-isolated PDX cells were enriched by magnetic cell sorting and slow-cycling, label-retaining cells (LRC) and fast-cycling (non-LRC) cells were separated by flow cytometry according to their CFSE content. Following lysis and protease digestion, purified peptides were injected into a nanoflow liquid chromatography (LC) system coupled online to a high-resolution TIMS quadrupole time-of-flight mass spectrometer (timsTOF Pro) using diaPASEF acquisition mode. The scheme shows quadrupole isolation windows in two-dimensional 1/K0—m/z plane for diaPASEF acquisition with a 100 ms TIMS scan time and the diaPASEF MS/MS spectra correspond to the precursor ion selection. B Number of proteins quantified from a total of 3000 cells of LRC (n = 5) and non-LRC (n = 5) samples. Peptide and protein level FDR cut-off at 1%. C Appearance of LRCs and non-LRCs in principle component analysis (PCA). D Volcano plot displaying significantly regulated quantified proteins in LRC and non-LRC. E Box plot representation of ADAM10 which is significantly upregulated in LRC compared to non-LRC. Z-scored log2 protein intensity is displayed for proteins with permutation-based FDR cut-off < 0.05. F Gene Ontology (GO) enrichment analysis (Fisher’s exact test) of proteins significantly enriched in LRC and non-LRC. G GO network analysis of enriched pathways in LRC was built using the ClueGo app in Cytoscape. H String network map of ADAM10-interacting proteins from the LRC-regulated proteome. Nodes in red color indicate proteins with functional dependencies in leukemia cells (according to Depmap (https://depmap.org/portal/)). I Fisher’s exact test showing the enrichment of Cell adhesion and Metalloendopeptides terms from the ADAM10 network in LRCs
Fig. 2
Fig. 2
A pipeline for in vivo CRISPR-Cas9 dropout screens in ALL PDX models. A Workflow of CRISPR-Cas9 screening experiments. Primary leukemia cells from patients were transplanted into mice, re-isolated, and lentivirally transduced with split-Cas9 and a lenti-CRISPR library. Cells were cultured for 10 days in vitro, and MACS-enriched Cas9/sgRNA double-positive cells were transplanted into mice (n = 5 for ALL-199, n = 8 for ALL-265). PDX cells were re-isolated from mice with advanced leukemia and sgRNA distribution was analyzed by next generation sequencing (NGS) in comparison to the input control. B Distribution of all sgRNAs present in the library was analyzed by NGS in the plasmid pool and in re-isolated cells from split-Cas9-negative PDX samples (n = 2) after 6 weeks of in vivo growth. C Depletion score calculated using the MAGeCK robust ranking algorithm (RRA) for dropout genes in both samples or exclusively in ALL-199 or ALL-265. Dotted line represents cut-off at < 0.01. D Workflow of in vivo competitive validation assay. Split-Cas9-GFP-transgenic PDX cells were either used as control (CTRL, GFP-positive) or lentivirally transduced with sgRNAs targeting the gene of interest (GOI, mTagBFP-positive). Cells were cultured for 10 days, before sgRNA-positive cells were enriched by FACS. KO cells and CTRL cells were mixed in a 1:1 ratio and injected into three mice, one mouse per sgRNA. Animals were sacrificed at advanced leukemia and the distribution of the two re-isolated cell populations was evaluated by flow cytometry. E Representative flow cytometry plots of in vivo competitive validation assay for CXCR4 and ITGB1 in ALL-199 and ALL-265. Distribution of mTagBFP-positive KO cells and mTagBFP-negative CTRL cells in the injection mixture (1:1 ratio, Input, upper panel) and in re-isolated PDX cells after 6 weeks of in vivo growth (Output, lower panel) is shown. F Quantification of in vivo competitive validation assay for CXCR4 and ITGB1. Percentage of the KO populations in the injection mixture and in corresponding re-isolated PDX cells of ALL-199 (n = 3 each GOI, each 3 animals with 3 BM measurements) and ALL-265 (n = 3 for CXCR4 and n = 3 for ITGB1 with 3 animals with the same ITGB1 sgRNA; for each GOI 3 animals with 3 BM measurements) are depicted. *** p < 0.001, ** p < 0.01 by paired t-test
Fig. 3
Fig. 3
ADAM10 is essential for PDX acute leukemia in vivo. A Publicly available data from the BloodSpot databank were analyzed for ADAM10 mRNA expression profile in leukemia samples with the indicated BCP-ALL and AML subtypes compared to healthy donor BM controls (dataset 202603_at; Leukemia MILE study GSE13159). Box indicates median, 25th and 75th percentile; whiskers indicate min/max. **** p < 0.0001, *** p < 0.001 by multiple t-test compared to healthy BM group. ns: not significant, CN: cytogenetically normal. B Flow cytometry analysis of ADAM10 surface expression in ALL (n = 14) and AML (n = 10) PDX samples compared to healthy donor BM (n = 10) samples. Isotype control of representative PDX and BM samples are included for comparison. C Correlation of ADAM10 expression in AML blasts with overall survival in 172 AML patients (dataset for 202603_at; Human AML cells GSE13159). D-F In vivo competitive ADAM10 validation in AML and ALL PDX samples. D ADAM10 surface protein expression in control (CTRL and Isotype) and KO ALL and AML PDX samples transduced with the indicated sgRNAs and re-isolated following 8 weeks of in vivo growth. Histograms of cells transduced with two independent ADAM10-sgRNAs are shown. E Quantification of in vivo competitive validation assay. Percentage of the ADAM10 KO population in the injection mix (Input) and in the corresponding re-isolated PDX from BM (black) or spleen (grey) at advanced leukemia (Output) for ALL-199 (n = 7; 4 animals with 4 BM and 3 spleen measurements), ALL-265 (n = 12; 9 animals with 9 BM and 3 spleen measurements), AML-356 (n = 9; 5 animals with 4 BM and 5 spleen measurements), AML-388 (n = 6, 3 animals with 3 BM and 3 spleen measurements), AML-393 (n = 9; 6 animals with 6 BM and 3 spleen measurements), AML-602 (n = 6; 3 animals with 3 BM and 3 spleen measurements) and AML-661 (n = 14; 7 animals with 7 BM and 7 spleen measurements). **** p < 0.0001, *** p < 0.001, ** p < 0.01 by paired t-test. F Dropout of ADAM10 KO cells is more prominent in spleen compared to BM in some samples. Percentages of ADAM10 KO cells in the BM and spleen derived from E. **** p < 0.0001 by paired t-test. G Quantification of in vitro competitive validation assay for ADAM10. Percentage of the ADAM10 KO population before (Input) and after the in vitro cultivation period (Output) (all PDX samples n = 3, 3 individual sgRNAs). *p < 0.05 by paired t-test, nd (not determined), ns (not significant). H In vivo competitive validation assays for ADAM10 in ALL-199 and ALL-265 after the indicated in vivo growth times. Percentage of the KO populations in the injection mixture and in PDX cells re-isolated from the BM is depicted. Grey dotted line is the interpolation of the data using Pade (1,1) approximant, robust fit
Fig. 4
Fig. 4
Molecular reconstitution confirms essentiality of ADAM10 in PDX ALL in vivo. A Schematic illustration of different ADAM10 expression variants. Upper construct: full-length ADAM10 protein, middle panel: constitutive catalytically active ADAM10 variant (ACT), lower panel: enzymatically inactive ADAM10 variant, lacking the metalloproteinase domain (ΔMP); SP: signal peptide, PRO: prodomain, DI: disintegrin domain, CR: cysteine-rich domain, TM: transmembrane domain, CP: cytoplasmic domain. B Confocal microscopy pictures of expression of recombinant ADAM10. ADAM10 was stained (Alexa Fluor (AF) 647) on fixed un-permeabilized HEK293T control (Plain), ADAM10 KO cells or ADAM10 KO cells with re-expression of the active ADAM10 construct (ADAM10 KO + ACT). DAPI was used for nuclear staining. Representative images of three independent experiments are shown. C Immunoblot of ADAM10 expression in crude cell lysates (cytosol) and membrane fraction (membr.) in HEK293T wildtype or ADAM10 KO cells with or without expression of constitutively active-ADAM10 (ACT). Syntaxin 4 and β-Actin were used as membrane protein marker and loading control, respectively. D Workflow of in vivo competitive ADAM10 reconstitution assays. E Representative flow cytometry analysis of T-Sapphire expression. T-Sapphire expression levels were compared between the ADAM10 KO PDX cells transduced with the iRFP mock vector (CTRL) and the active-ADAM10 (ACT)- or ΔMP-ADAM10 (ΔMP)-expressing cells after isolation from the animals. One representative histogram out of three individual animals per group is shown. F ADAM10 mRNA expression in parental split-Cas9-positive ALL-199 (CTRL), ADAM10 KO ALL-199 cells transduced with the iRFP mock vector (KO + CTRL) and ADAM10 KO reconstituted with the ACT or ΔMP variants was determined by qRT-PCR and normalized to GAPDH. Box indicates median, 25th and 75th percentile; whiskers indicate 25th percentile - 1.5 IQR (inter-quartile distance) and 75th percentile + 1.5 IQR. * p < 0.05 by unpaired t-test. G Distribution of subpopulations of the competitive in vivo ADAM10 reconstitution assay. Percentages of cells expressing the indicated ADAM10 variant from the injection mixture (Input) are compared to PDX cells isolated from murine BM (Output) after a similar in vivo growth period of 8–9 weeks. Violin plot with median indicated by dashed line and 25th and 75th percentile by dotted lines. Data of three animals is shown. ns not significant, * p < 0.05 by paired t-test
Fig. 5
Fig. 5
Molecular profiling and functional analysis reveal a role of ADAM10 in cell cycle progression and apoptosis. A-E Proteome and secretome analysis of ADAM10 KO and control SEM and Nalm-6 cells. A Workflow of mass spectrometry-based secretome and proteome analysis of ADAM10 KO and CTRL cells. B SEM proteome. Heat map of unsupervised hierarchical clustering of significantly regulated proteins of control (n = 4) vs. ADAM10 KO (n = 8) in SEM cells (two-sample test, permutation-based FDR < 0.05). C Pathway enrichment results of the proteome analysis described in B. The five most significantly altered pathways are depicted. FDR: false discovery rate. D SEM secretome. Heat map of unsupervised hierarchical clustering of significantly regulated secreted proteome of control (n = 4) vs. ADAM10 KO (n = 4) in SEM cells (two-sample test, permutation-based FDR < 0.05). E Box plots showing significantly regulated secreted proteins in SEM cells with ADAM10 KO. Plot displays z-scored log 2 protein intensity of selected proteins. F Transcriptome analysis of ADAM10 KO (n = 3) and CTRL PDX (n = 4) samples of ALL-199 and ALL-265. Heatmap of genes differentially expressed between ADAM10 KO and CTRL cells with unadjusted p value of ≤ 0.05 and fold change < 0.5 or > 2 is shown. G Pathway enrichment results of transcriptome analyses described in F were mapped into a network of gene sets (nodes) related by gene overlap (lines). Node size is proportional to the number of genes in each set and the enrichment significance (FDR p value) is represented as a node color gradient. Proportion of shared genes between gene sets is depicted as the thickness of the blue line surrounding the nodes. The major functional groups are annotated. Data analyzed and visualized by GSEA 4.1.0 and Cytoscape 3.9.0. H Gene set enrichment analysis (GSEA) for the KEGG term cell cycle (p < 0.005 and FDR q value < 0.33, Norm p = 0.01). I Proteome of PDX cells. Heatmap of significantly regulated proteins by unsupervised hierarchical clustering of ALL PDX sample with control sgRNA (ALL-199 n = 4, ALL-265 n = 4) vs. ADAM10 KO sgRNA (ALL-199 n = 5, ALL-265 n = 4) (two-sample test, permutation-based FDR < 0.05). J Plot displaying the enriched and de-enriched GO term categories (for panel I) upon ADAM10 KO in ALL PDX samples by Fisher’s exact test. K Cell cycle analysis of ADAM10 inhibitor (GI254023X, 490 µM)- or DMSO-treated ALL-199 PDX cells. Percentage of cells in the indicated cell cycle phase was quantified on day 1, day 2 and day 3 of treatment with the ADAM10 inhibitor or DMSO. Each dot represents the mean of four replicates. G1 = Gap phase 1, S = Synthesis phase, G2/M = Gap phase 2/mitosis. ** p < 0.01, * p < 0.05 by paired t-test. L Apoptosis assay in ALL-199 PDX cells with ADAM10 KO (n = 3) or treated with ADAM10 inhibitor (GI254023X, 490 µM, n = 6). *** p < 0.001, * p < 0.05 by paired t-test
Fig. 6
Fig. 6
Targeting ADAM10 inhibits homing, reduces LSC frequency and sensitizes to chemotherapy in vivo. A Workflow for early engraftment assay. B Quantification of PDX cells homing to the BM. Number of DMSO- (GI group: n = 6, Aderbasib group: n = 5) or inhibitor- (GI: n = 8, Aderbasib 10 µM: n = 5) treated ALL-199 or DMSO- (n = 5) or inhibitor- (n = 5) treated ALL-265 were analyzed. Data were normalized to the mean of the respective DMSO group. Each dot represents one mouse. **** p < 0.0001, *** p < 0.001, *p < 0.05 by paired t-test. C Quantification of the limiting dilution transplantation assay. Mean (solid lines) and 95% confidence interval (CI, dashed line) are depicted (ALL-199 n = 25). Bar graph depicts relative LIC frequency of ADAM10 KO cells normalized to control. D Quantification of colony-forming unit assay with PDX AML-356 or AML-388 cells with or without ADAM10 KO. Each dot represents one replicate. *p < 0.05 by paired t-test. E Quantification of colony-forming unit assay with PDX AML-356 or AML-388 cells treated with the ADAM10 inhibitor GI254023X (GI, 100 µM) or DMSO for 72 h. Each dot represents one replicate. * p < 0.05 by paired t-test. F Quantification of colony-forming unit assay with healthy human CD34 + blood progenitor cells treated with the ADAM10 inhibitor GI254023X (GI, 100 µM), Aderbasib (AD, 10 µM) or DMSO for 72 h. Each dot represents one replicate. ns by Holm-Sidak’s multiple comparisons test vs. DMSO. G Workflow of the competitive in vivo chemotherapy trial. ADAM10 KO cells marked with mTagBFP or CTRL cells marked with T-Sapphire were injected into groups of mice in a 4:1 ratio of ADAM10 KO:CTRL cells to compensate for the disadvantage of ADAM10 KO cells. Tumor growth was monitored by repetitive bioluminescence in vivo imaging. Mice were sacrificed at start of therapy (SOT) or following treatment with chemotherapy or PBS. Percentages of the KO and CTRL populations among the isolated human cells (ADAM10 KO + CTRL cells) were determined by flow cytometry. H Representative in vivo bioluminescence imaging pictures of mice carrying AML-661 PDX cells treated with cytarabine (AraC, n=3, loss of 2 mice due to drug-related toxicities) or PBS (n=4, 1 mouse was removed as extreme value) at the indicated time points. I Quantification of all images taken from mice carrying AML-661 PDX cells over time. J Quantification of human cells in the BM in AML-661. *** p < 0.001, by unpaired t-test. K Quantification of distribution of ADAM10 KO PDX cells in AML-661 at injection, start of therapy (SOT) and after treatment with PBS or AraC. **** p < 0.0001, *** p < 0.001 by unpaired t-test. L In vivo chemotherapy trial with ALL-265 treated with vincristine (VCR, n = 3), Cyclophosphamide (Cyclo, n = 3) or PBS (i.p., n = 4). Quantification of distribution of ADAM10 KO PDX cells in ALL-265 at injection and after treatment with PBS, VCR or Cyclo. *** p < 0.001, * p < 0.05 by unpaired t-test

References

    1. Dohner H, Wei AH, Lowenberg B. Towards precision medicine for AML. Nat Rev Clin Oncol. 2021;18(9):577–590. doi: 10.1038/s41571-021-00509-w. - DOI - PubMed
    1. Douer D, Gokbuget N, Stock W, Boissel N. Optimizing use of L-asparaginase-based treatment of adults with acute lymphoblastic leukemia. Blood Rev. 2022;53:100908. doi: 10.1016/j.blre.2021.100908. - DOI - PubMed
    1. Delahaye MC, Salem KI, Pelletier J, Aurrand-Lions M, Mancini SJC. Toward therapeutic targeting of bone marrow leukemic niche protective signals in B-cell acute lymphoblastic leukemia. Front Oncol. 2020;10:606540. doi: 10.3389/fonc.2020.606540. - DOI - PMC - PubMed
    1. Menter T, Tzankov A. Tumor microenvironment in acute myeloid leukemia: adjusting niches. Front Immunol. 2022;13:811144. doi: 10.3389/fimmu.2022.811144. - DOI - PMC - PubMed
    1. Phan TG, Croucher PI. The dormant cancer cell life cycle. Nat Rev Cancer. 2020;20(7):398–411. doi: 10.1038/s41568-020-0263-0. - DOI - PubMed

Publication types