. 2023 Jul 25;42(7):112783.
doi: 10.1016/j.celrep.2023.112783. Epub 2023 Jul 8.

Cortical regulation of neurogenesis and cell proliferation in the ventral subventricular zone

Affiliations

Cortical regulation of neurogenesis and cell proliferation in the ventral subventricular zone

Moawiah M Naffaa et al. Cell Rep. .

Abstract

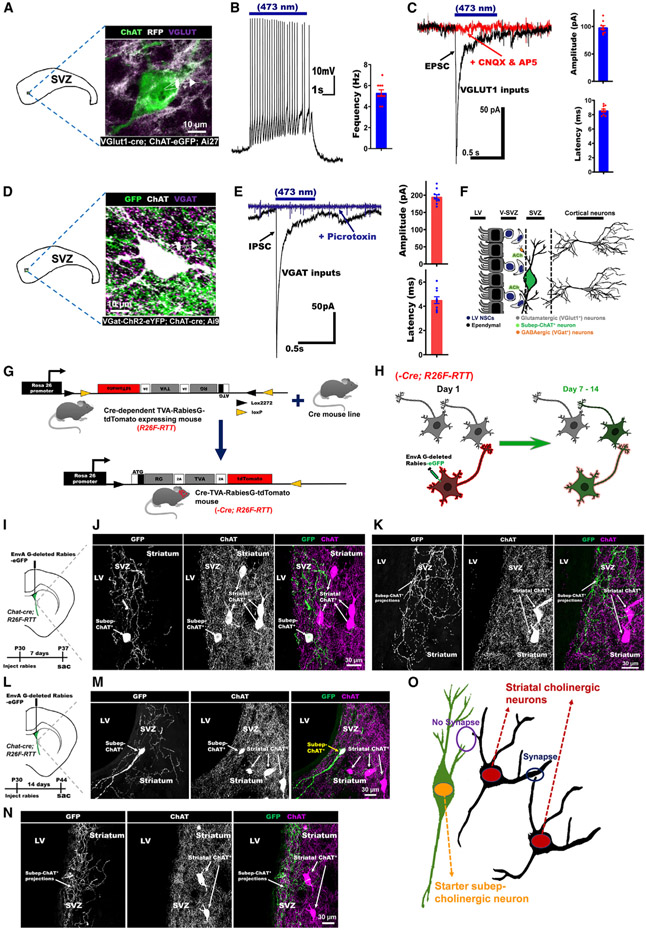
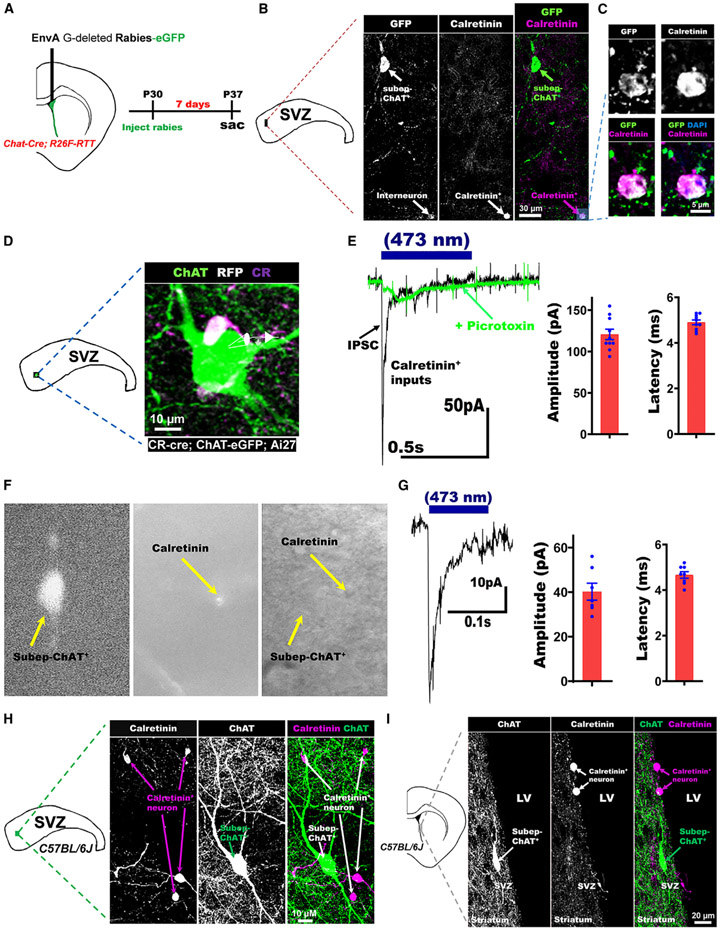
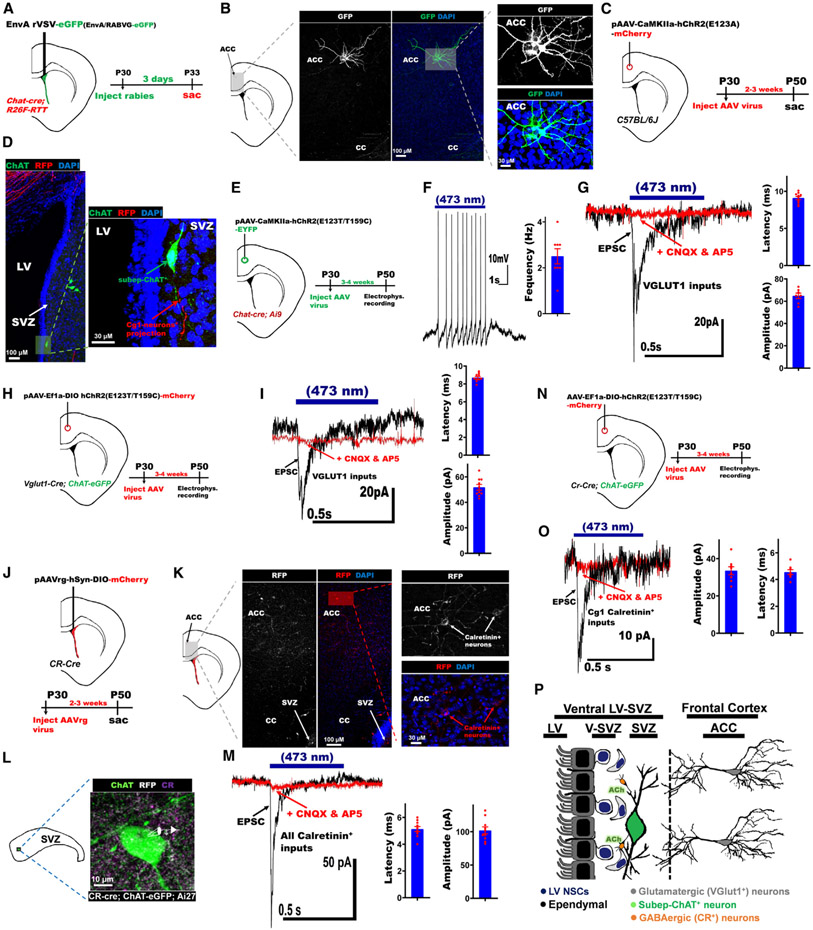
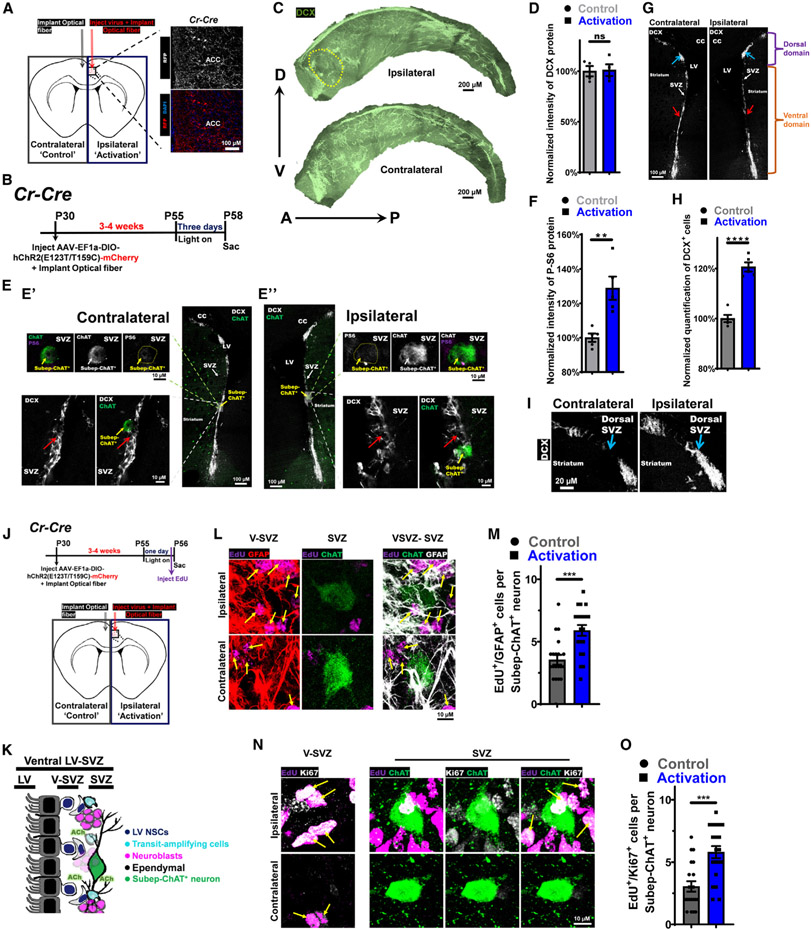
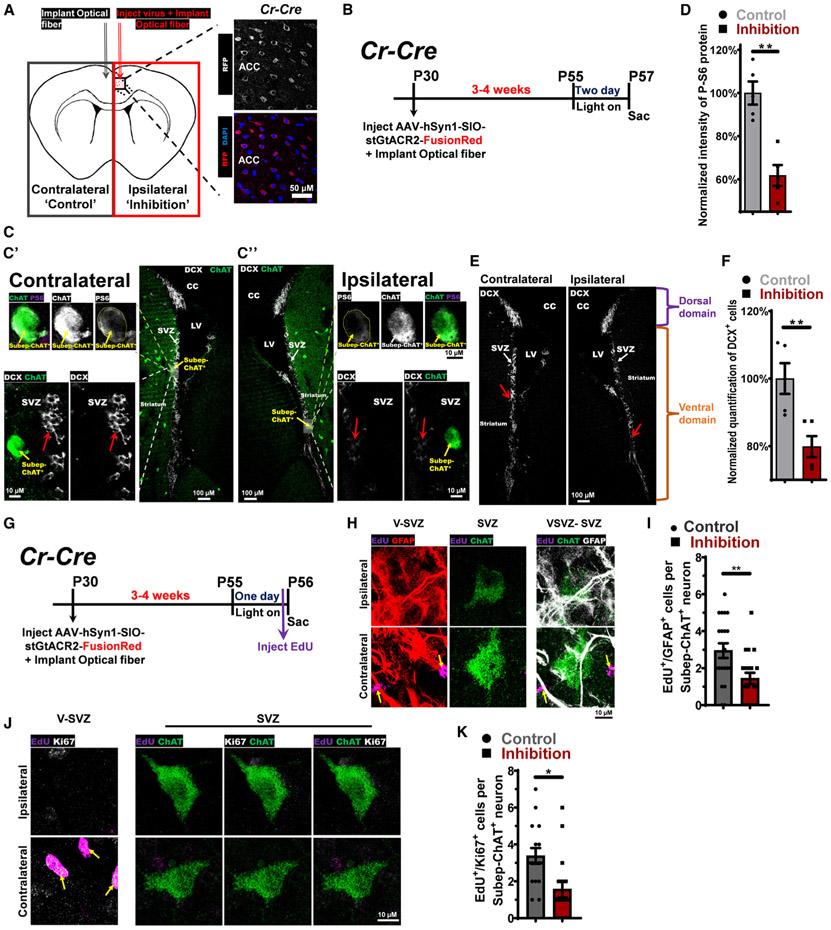
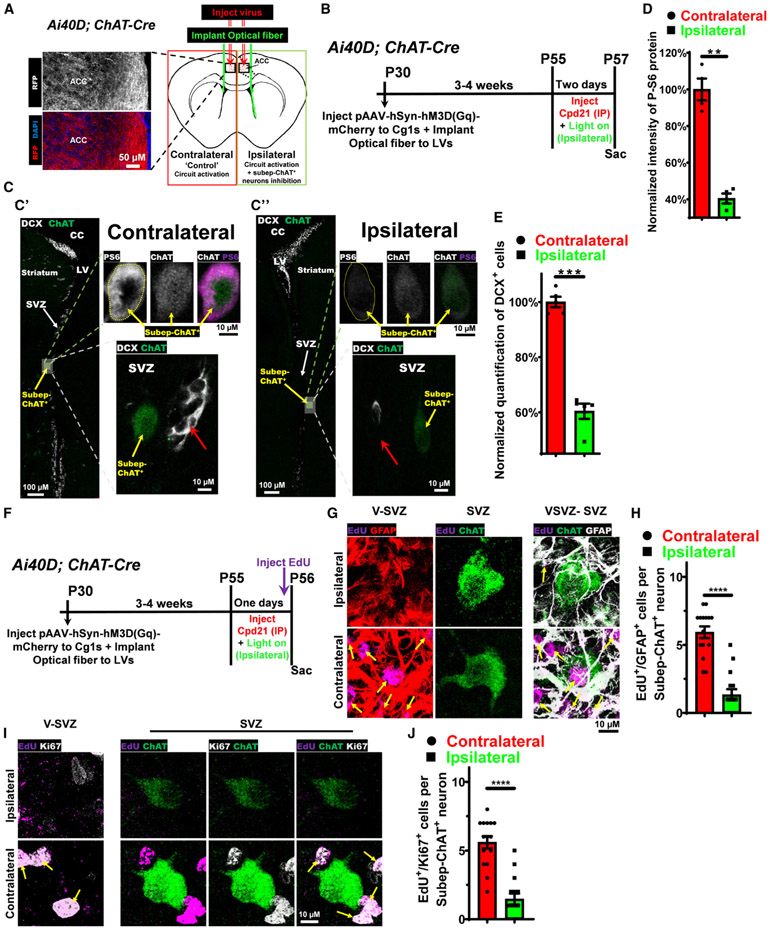
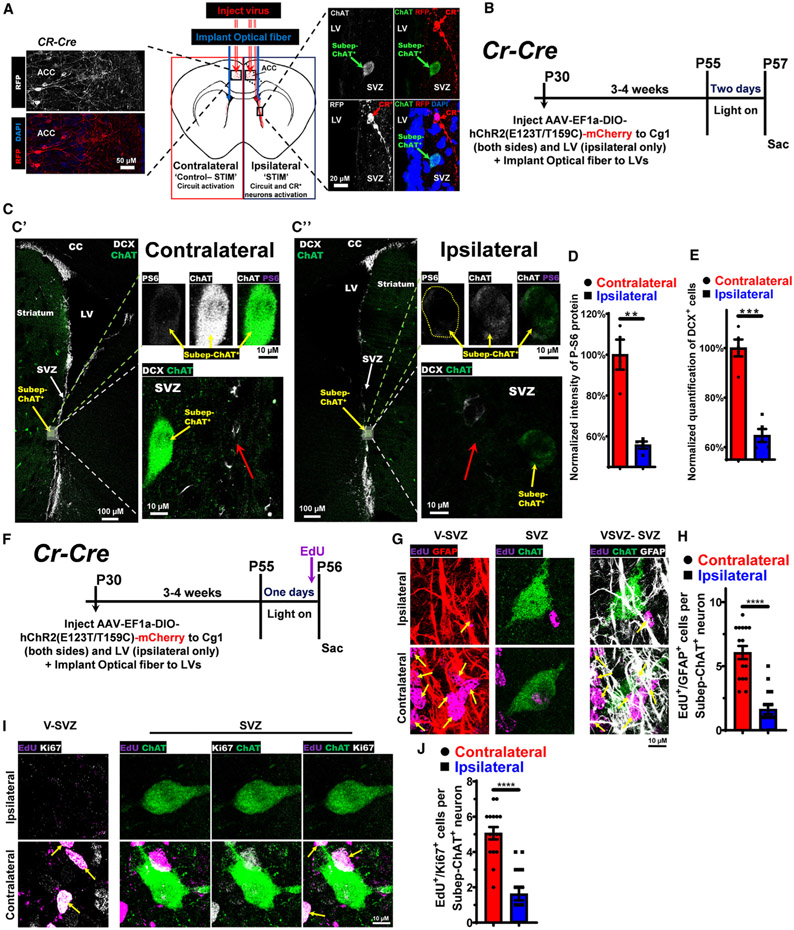
Neurogenesis and differentiation of neural stem cells (NSCs) are controlled by cell-intrinsic molecular pathways that interact with extrinsic signaling cues. In this study, we identify a circuit that regulates neurogenesis and cell proliferation in the lateral ventricle-subventricular zone (LV-SVZ). Our results demonstrate that direct glutamatergic projections from the anterior cingulate cortex (ACC), as well as inhibitory projections from calretinin+ local interneurons, modulate the activity of cholinergic neurons in the subependymal zone (subep-ChAT+). Furthermore, in vivo optogenetic stimulation and inhibition of the ACC-subep-ChAT+ circuit are sufficient to control neurogenesis in the ventral SVZ. Both subep-ChAT+ and local calretinin+ neurons play critical roles in regulating ventral SVZ neurogenesis and LV-SVZ cell proliferation.

Keywords: CP: Neuroscience; anterior cingulate; calretinin; frontal cortex; neural stem cells proliferation; postnatal neurogenesis; subep-ChAT(+); subventricular zone.


Conflict of interest statement

Declaration of interests The authors declare no competing interests.

Figures

Figure 1.
Figure 1.. Glutamatergic and GABAergic inputs to subep-ChAT+ neurons and rabies virus infection of these cholinergic neurons in SVZ
(A) Illustration of electrophysiological recording of excitatory inputs (VGlut1+) to the subep-ChAT+ neuron from the wholemount of P30-50 VGlut1-Cre; ChAT-eGFP; Ai27 mice. Scale bar, 10 μm. (B) Representative trace from whole-cell current clamp recording of evoked action potential (APs) from subep-ChAT+ neurons upon blue (473-nm) light stimulation for 5 s (left). Mean frequency (right). n = 4 (biological replicates), one-sample t test. Each dot represents data from one subep-ChAT+ neuron. (C) Representative trace of EPSCs that were obtained in whole-cell voltage-clamp recordings from subep-ChAT+ neurons after photo-stimulation for 500 ms (black) and the application of AMPA and NMDA receptors antagonists; CNQX and AP-5, respectively (red) (left). Mean evoked EPSC amplitude and latency (right). n = 4 (biological replicates), one-sample t test. Each dot represents the amplitude (upper) and latency (lower) of a single EPSC recorded from subep-ChAT+ neuron. (D) Illustration of electrophysiological recording of inhibitory inputs (VGat+) to the subep-ChAT+ neuron from P30-50 VGat-ChR2-eYFP; ChAT-Cre; Ai9 mice. Scale bar, 10 μm. (E) Representative trace of electrophysiological recordings of IPSCs that were obtained in whole-cell recordings from subep-ChAT+ neurons upon blue (473 nm) light stimulation for 500 ms (black), and the application of GABAAR antagonist; picrotoxin (blue) (left). Mean evoked IPSC amplitude and latency (right). n = 4 (biological replicates), one-sample t test. (F) Schematic representation of presynaptic (excitatory and inhibitory) inputs to the subep-ChAT+ neuron. (G) Schematic representation of R26R-FLEX-TVA-2A-RabiesG-2A-tdTomato-FLEX (R26F-RTT) mice before and after Cre recombinase. (H) Schematic of EnvA G-deleted rabies-eGFP virus injection into the brain of -Cre; R26F-RTT mice. It represents monosynaptic retrograde tracing using R26F-RTT mouse tool. (I) Experimental representation of EnvA G-deleted rabies-eGFP virus injection into lateral ventricle (LV) of P30 Chat-Cre; R26F-RTT mice. Mice were sacrificed 7 days after injection. (J and K) Immunofluorescence staining for GFP (green) and ChAT (purple) in SVZ and striatum of ipsilateral (injected) side of Chat-Cre; R26F-RTT mice (7 days post injection). Scale bar, 30 μm. (L) Experimental representation of EnvA G-deleted rabies-eGFP virus injection into LV of P30 Chat-Cre; R26F-RTT mice. Mice were sacrificed 14 days after injection. (M and N) Immunofluorescence staining for GFP (green) and ChAT (purple) in SVZ and striatum of the ipsilateral (injected) side of Chat-Cre; R26F-RTT mice (14 days post injection). Scale bar, 30 μm. (O) Schematic representation of the connectivity of striatal cholinergic and subep-ChAT+ neurons. All blue bars represent the duration of light stimulation. All data presented as mean ± SEM. See also Figures S1, S2, and S3.
Figure 2.
Figure 2.. Local CR+ GABAergic interneurons provide inhibitory inputs to subep-ChAT+ neurons
(A) Experimental design of EnvA G-deleted rabies-eGFP virus injection into LV of P30 Chat-Cre; R26F-RTT mice. (B and C) Immunofluorescence staining for GFP (green), CR (purple), and DAPI (blue) in ipsilateral SVZ wholemount (injected) of P37 Chat-Cre; R26F-RTT mice. Scale bar, 30 μm (B) and 5 μm (C). (D) Illustration of electrophysiological recording of CR+ inhibitory inputs to the subep-ChAT+ neurons from SVZ wholemount of P30-50 Cr-Cre; ChAT-eGFP;Ai27 mice. Scale bar, 10 μm. (E) Representative trace of evoked IPSCs from subep-ChAT+ neurons upon photo-stimulation for 500 ms (black) and after application of GABAAR antagonist picrotoxin (green) (left). Mean current amplitude and latency of the IPSCs upon stimulation (right). n = 5 (biological replicates), one-sample t test. (F) Representation of subep-ChAT+ neuron recording from SVZ wholemount of P30-50 Cr-Cre; ChAT-eGFP;Ai27 mice. (Left) subep-ChAT+ neuron (473-nm light). (Middle) subep-CR+ neurons (590-nm light). Right: Bright-field image showing both subep-ChAT+ and −CR+ neurons. (G) Representative trace of evoked IPSCs in subep-ChAT+ neurons following photo-stimulation for 100 ms (left). Mean current amplitude and latency of the IPSCs upon stimulation (right). n = 3 (biological replicates), one-sample t test. (H and I) Immunofluorescence staining for CR (purple) and ChAT (green) in the SVZ wholemount (H) and coronal section (I) of P28 C57BL/6J mice. Scale bar, 10 μm (H) and 20 μm (I). All blue bars represent the duration of light stimulation. All data presented as mean ± SEM. See also Figure S4.
Figure 3.
Figure 3.. Anterior cingulate neurons (VGlut1+ and CR+) project directly to subep-ChAT+ neurons
(A) Schematic: EnvA rVSV-eGFP virus injection into LV of P30 Chat-Cre; R26F-RTT mice. (B) Immunofluorescence: GFP (green) in anterior cingulate cortex of injected side of P33 Chat-Cre; R26F-RTT mice. Scale bar, 100 μm (left) and 30 μm (right). (C) Schematic: AAV-CaMKII-hChR2(E123A)-mCherry virus injection into ACC region of P30 C57BL/6J mice. (D) Immunofluorescence: ChAT (green) and infected projections (red) of the ipsilateral ACC neurons in striatum and SVZ (left), and SVZ (right) of mice in (C). Scale bar, 100 μm (left) and 30 μm (right). (E) Experimental design: pAAV-Ef1a-DIO hChR2(E123T/T159C)-EYFP virus injection into ACC region of P30 Chat-Cre; Ai9 mice. (F) Whole-cell recording: evoked APs from subep-ChAT+ neurons upon photo-stimulation for 5 s (left). n = 5 (biological replicates), one-sample t test (right). (G) Whole-cell recordings: evoked EPSCs in response to light stimulation in subep-ChAT+ neurons (black) and after blocking with CNQX and AP-5 (red) (left). Mean current amplitude and latency (right). n = 5 (biological replicates), one-sample t test. (H) Experimental design: pAAV-Ef1a-DIO hChR2(E123T/T159C)-mCherry virus injection into ACC region of P30 VGlut1-Cre; ChAT-eGFP mice. (I) Whole-cell recordings: evoked EPSCs in response to light stimulation in subep-ChAT+ neurons (black) and after blocking with CNQX and AP-5 (red) (left). Mean current amplitude and latency (right). n = 4 (biological replicates), one-sample t test. (J) Schematic: pAAVrg-hSyn-DIO-mCherry virus injection into LV of P28 Cr-Cre mice. (K) Immunofluorescence: RFP (red) in ACC region of injected side in P50 Cr-Cre mice in (J). Scale bar, 100 μm (left) and 30 μm (right). (L) Electrophysiological recording: CR+ excitatory inputs to subep-ChAT+ neurons from SVZ wholemount of P30-50 Cr-Cre; ChAT-eGFP; Ai27 mice. Scale bar, 10 μm. (M) Whole-cell recordings: evoked EPSCs in response to light stimulation in subep-ChAT+ neurons (black) and after blocking (red) (left). Mean EPSC amplitude and latency (right). n = 5 (biological replicates), one-sample t test. (N) Experimental design: AAV-EF1a-DIO-hChR2(E123T/T159C)-mCherry virus injection into ACC of P28 Cr-Cre; ChAT-eGFP mice. (O) Whole-cell recordings: EPSCs specifically evoked by ACC CR+ input were recorded from subep-ChAT+ neurons upon light stimulation (black) and after blocking (red) (left). Mean current amplitude and latency (right). n = 4 (biological replicates), one-sample t test. (P) Schematic summary: ACC-subep-ChAT+ circuit regulation of LV NSCs. All blue bars represent the duration of light stimulation. All data presented as mean ± SEM. See also Figure S5.
Figure 4.
Figure 4.. In vivo optogenetic excitation of the ACC-subep-ChAT+ circuit increases neurogenesis and cell proliferation in the SVZ niche
(A) Schematic representation of in vivo optogenetic stimulation experiment in (B) and (J). Immunofluorescence staining for RFP (red) in the ipsilateral (injected) ACC of Cr-Cre mice. Scale bar, 100 μm (right). (B) Experimental design of in vivo optogenetic stimulation for 3 days post AAV-EF1a-DIO-hChR2(E123T/T159C)-mCherry virus injection into ipsilateral ACC and optical fibers implantation into ACC regions of P28 Cr-Cre mice. (C) DCX (green) immunofluorescence staining of ipsilateral (activation) vs. contralateral (control) of SVZ wholemounts from stimulated mice in (B). The yellow dotted circle represents an area where subep-ChAT+ neurons are found in the ventral SVZ. Scale bar, 200 μm. (D) Analysis of DCX intensity in ipsilateral (activation) vs. contralateral (control) SVZ wholemounts. p = 0.76 (non-significant), t3 = 0.32, n = 4 (biological replicates), paired t test. Each dot represents a normalized total DCX protein per SVZ wholemount. (E) DCX (gray) and ChAT (green) immunofluorescence staining of (E′) contralateral (control) vs. (E″) ipsilateral (activation) sides of SVZ from the coronal sections from mice in (B). Red arrows represent DCX+ neuroblasts around subep-ChAT+ neurons. Scale bar, 10 μm (left and right) and 100 μm (middle). (F) P-S6 intensity analysis of subep-ChAT+ neurons in ipsilateral side (activation) vs. contralateral side (control). p = 0.0097, t4 = 4.65, n = 5 (biological replicates), paired t test. Each dot represents subep-ChAT+ neurons per mouse. (G) DCX (gray) immunofluorescence staining of contralateral SVZ (control) vs. ipsilateral SVZ (activation) from coronal section of mice in (E). Blue arrows show DCX+ neuroblasts in dorsal domains. Red arrow shows DCX+ neuroblasts adjacent to subep-ChAT+ neurons in the ventral SVZ. (H) Analysis of DCX+ neuroblasts where subep-ChAT+ neurons are found on the ipsilateral side (activation) vs. contralateral side (control). ****p < 0.0001, t4 = 16.3, n = 5 (biological replicates), paired t test. Each dot represents a total of DCX+ cells in stimulated coronal sections per mouse. (I) DCX (gray) immunofluorescence staining of contralateral SVZ (control) vs. ipsilateral SVZ (activation) from coronal section of mice in (E) and (G). Blue arrows show DCX+ neuroblasts in dorsal domains of SVZ. Scale bar, 20 μm. (J) Experimental design of in vivo optogenetic stimulation for 1 day post AAV-EF1a-DIO-hChR2(E123T/T159C)-mCherry virus injection into ipsilateral ACC and optical fibers implantation into ACC regions of P28 Cr-Cre mice. (K) Schematic representation of the organization of the LV-SVZ. (L) EdU (purple), ChAT (green), and GFAP (gray) immunofluorescence staining of ipsilateral (activation) vs. contralateral (control) SVZ wholemounts from stimulated mice in (J). Yellow arrows show EdU+/GFAP+ cells surrounding subep-ChAT+ neurons. Scale bar, 10 μm. (M) Analysis of EdU+/GFAP+ cells surrounding subep-ChAT+ neurons in ipsilateral (activation) V-SVZ vs. contralateral (control) of SVZ wholemounts. p = 0.0015, t19 = 3.7, n = 20 (biological replicates), paired t test. Data collected from five stimulated Cr-Cre mice. Each dot represents total EdU+/GFAP+ cells surrounding a subep-ChAT+ neuron. (N) EdU (purple), ChAT (green), and Ki67 (gray) immunofluorescence staining of ipsilateral (activation) vs. contralateral (control) SVZ wholemounts from stimulated mice in (A). Yellow arrows show EdU+/Ki67+ cells surrounding subep-ChAT+ neurons. Scale bar, 10 μm. (O) Analysis of EdU+/Ki67+ cells surrounding subep-ChAT+ neurons in ipsilateral (activation) V-SVZ vs. contralateral (control) of SVZ wholemounts. p = 0.0002, t19 = 4.5, n = 20 (biological replicates), paired t test. Data collected from five stimulated Cr-Cre mice. Each dot represents total EdU+/Ki67+ cells surrounding a subep-ChAT+ neuron. All data presented as mean ± SEM. See also Figures S6 and S7.
Figure 5.
Figure 5.. In vivo optogenetic inhibition of the ACC-subep-ChAT+ circuit reduces SVZ neurogenesis and cell proliferation
(A) Schematic: in vivo optogenetic inhibition experiment in Cr-Cre mice. (B) Experimental design: in vivo optogenetic inhibition for 2 days in Cr-Cre mice. (C) immunofluorescence: DCX (gray) and ChAT (green) staining in control (C′) vs. ipsilateral (C″) sides of SVZ. Red arrows represent DCX+ neuroblasts around subep-ChAT+ neurons. Scale bar, 10 μm (left and right) and 100 μm (middle). (D) P-S6 intensity analysis of ipsilateral vs. control subep-ChAT+ neurons. p = 0.0013, t4 = 8.1, n = 5 (biological replicates), paired t test. (E) DCX (gray) immunofluorescence: ipsilateral vs. contralateral sides of SVZ. The red arrow shows DCX+ cells adjacent to subep-ChAT+ neuronsofthestimulated and control sides. (F) Analysis of DCX+ cells where subep-ChAT+ neurons are found on the ipsilateral vs. control. p = 0.0010, t4 = 8.5, n = 5 (biological replicates), paired t test. (G) Experimental design: in vivo optogenetic inhibition for 1 day in Cr-Cre mice. (H) immunofluorescence: EdU (purple), ChAT (green), and GFAP (red/gray) staining in ipsilateral vs. control SVZ wholemounts. Yellow arrows show EdU+/GFAP+ cells surrounding subep-ChAT+ neurons in SVZ wholemount. Scale bar, 10 μm. (I) Analysis of EdU+/GFAP+ cells in ipsilateral vs. control SVZ wholemounts. p = 0.0035, t19 = 3.3, n = 20 (biological replicates), paired t test. Data collected from five stimulated Cr-Cre mice. (J) Immunofluorescence: EdU (purple), ChAT (green), and Ki67 (red/gray) staining in ipsilateral vs. control SVZ wholemounts. Yellow arrows show EdU+/Ki67+ cells surrounding subep-ChAT+ neurons in SVZ wholemount. Scale bar, 10 μm. (K) Analysis of EdU+/Ki67+ cells in ipsilateral vs. control SVZ wholemounts. p = 0.025, t15 = 2.5, n = 16 (biological replicates), paired t test. Data collected from four stimulated Cr-Cre mice. All data presented as mean ± SEM. See also Figure S8.
Figure 6.
Figure 6.. In vivo chemogenetic stimulation of ACC-subep-ChAT+ circuit and optogenetic inhibition of subep-ChAT+ neurons modulate SVZ neurogenesis and LV NSCs proliferation
(A) Schematic: in vivo chemogenetic ACC-subep-ChAT+ circuit stimulation and optogenetic subep-ChAT+ neurons inhibition experiment in (B) and (F). (B) Experimental design: in vivo chemogenetic ACC-subep-ChAT+ circuit stimulation and optogenetic subep-ChAT+ neurons inhibition for 2 days in Ai40D; ChAT-Cre mice. (C) Immunofluorescence: DCX (gray) and ChAT (green) staining in control (C′) vs. Ipsilateral (C″) sides of SVZ. Red arrows represent DCX+ neuroblasts surrounding subep-ChAT+ neurons. Scale bar, 10 μm (left and right) and 100 μm (middle). (D) P-S6 intensity analysis of ipsilateral vs. control subep-ChAT+ neurons. p = 0.0017, t3 = 10.8, n = 4 (biological replicates), paired t test. (E) Analysis of DCX+ neuroblasts on ipsilateral vs. control sides. p = 0.0008, t4 = 9.2, n = 5 (biological replicates), paired t test. (F) Experimental design: in vivo chemogenetic ACC-subep-ChAT+ circuit stimulation and optogenetic subep-ChAT+ neurons inhibition for 1 day post in Ai40D; ChAT-Cre mice. (G) Immunofluorescence: ChAT (green), EdU (purple), and GFAP (red/gray) staining in ipsilateral vs. control SVZ wholemounts. Yellow arrows show EdU+/GFAP+ cells surrounding subep-ChAT+ neurons. Scale bar, 10 μm. (H) Analysis of EdU+/GFAP+ cells per subep-ChAT+ neuron in SVZ wholemounts of ipsilateral vs. control. ****p < 0.0001, t14 = 7.6, n = 15 (biological replicates), paired t test. Data collected from four stimulated Ai40D; ChAT-Cre mice. (I) Immunofluorescence: ChAT (green), EdU (purple), and Ki67 (gray) staining in ipsilateral and control SVZ wholemounts. Yellow arrows show EdU+/Ki67+ cells surrounding subep-ChAT+ neurons. Scale bar, 10 μm. (J) Analysis of EdU+/Ki67+ cells per subep-ChAT+ neuron in SVZ wholemounts of ipsilateral vs. control. ****p < 0.0001, t14 = 7.2, n = 15 (biological replicates), paired t test; collected from four stimulated Ai40D; ChAT-Cre mice. All data presented as mean ± SEM. See also Figures S9-S11.
Figure 7.
Figure 7.. In vivo optogenetic ACC-subep-ChAT+ circuit and local CR+ neuron stimulation modulate SVZ neurogenesis and LV NSCs proliferation
(A) Schematic representation: in vivo optogenetic ACC-subep-ChAT+ circuit and CR+ neurons stimulations in ipsilateral side experiment in (B) and (F). (B) Experimental design: in vivo optogenetic ACC-subep-ChAT+ circuit and CR+ neurons stimulation for 2 days in CR-Cre mice. (C) Immunofluorescence: DCX (gray) and ChAT (green) staining in control (C′) vs. ipsilateral (C″) sections of SVZ. Red arrows represent DCX+ neuroblasts surrounding subep-ChAT+ neurons. Scale bar, 100 μm (left) and 10 μm (right). (D) P-S6 intensity analysis of ipsilateral vs. control subep-ChAT+ neurons. p = 0.0058, t3 = 7.1, n = 4 (biological replicates), paired t test. (E) Analysis of DCX+ neuroblasts on the ipsilateral vs. control sides. p = 0.0002, t4 = 13.3, n = 5 (biological replicates), paired t test. (F) Experimental design: in vivo optogenetic ACC-subep-ChAT+ circuit and CR+ neurons stimulations for 1 day in CR-Cre mice. (G) Immunofluorescence: ChAT (green), EdU (purple), and GFAP (red/gray) staining in ipsilateral vs. control SVZ wholemounts. Scale bar, 10 μm. (H) Analysis of EdU+/GFAP+ cells per subep-ChAT+ neuron in SVZ wholemounts. ****p < 0.0001, t15 = 8.1, n = 16 (biological replicates), paired t test. Data collected from four stimulated Cr-Cre mice. (I) Immunofluorescence: ChAT (green), EdU (purple), and Ki67 (gray) staining in ipsilateral vs. control SVZ wholemounts. Scale bar, 10 μm. (J) Analysis of EdU+/Ki67+ cells per subep-ChAT+ neuron in SVZ wholemounts. ****p < 0.0001, t15 = 5.95, n = 16 (biological replicates), pairedttest; collected from four stimulated Cr-Cre mice. All data presented as mean ± SEM. See also Figure S12.

Similar articles

Cited by

References

    1. Lim DA, and Alvarez-Buylla A (2016). The Adult Ventricular-Subventricular Zone (V-SVZ) and Olfactory Bulb (OB) Neurogenesis. Cold Spring Harb. Perspect. Biol 8, a018820. 10.1101/cshperspect.a018820. - DOI - PMC - PubMed
    1. Ihrie RA, and Alvarez-Buylla A (2011). Lake-front property: a unique germinal niche by the lateral ventricles of the adult brain. Neuron 70, 674–686. 10.1016/j.neuron.2011.05.004. - DOI - PMC - PubMed
    1. Lazarini F, and Lledo PM (2011). Is adult neurogenesis essential for olfaction? Trends Neurosci. 34, 20–30. 10.1016/j.tins.2010.09.006. - DOI - PubMed
    1. Doetsch F, Caillé I, Lim DA, García-Verdugo JM, and Alvarez-Buylla A (1999). Subventricular zone astrocytes are neural stem cells in the adult mammalian brain. Cell 97, 703–716. 10.1016/s0092-8674(00)80783-7. - DOI - PubMed
    1. Obernier K, Cebrian-Silla A,Thomson M, Parraguez JI, Anderson R, Guinto C, Rodas Rodriguez J, Garcia-Verdugo JM, and Alvarez-Buylla A (2018). Adult Neurogenesis Is Sustained by Symmetric Self-Renewal and Differentiation. Cell Stem Cell 22, 221–234.e8. 10.1016/j.stem.2018.01.003. - DOI - PMC - PubMed

Publication types