

SARS-CoV-2 niches in human placenta revealed by spatial transcriptomics
- PMID: 37423216
- PMCID: PMC10527005
- DOI: 10.1016/j.medj.2023.06.003
SARS-CoV-2 niches in human placenta revealed by spatial transcriptomics
Abstract
Background: Functional placental niches are presumed to spatially separate maternal-fetal antigens and restrict the vertical transmission of pathogens. We hypothesized a high-resolution map of placental transcription could provide direct evidence for niche microenvironments with unique functions and transcription profiles.
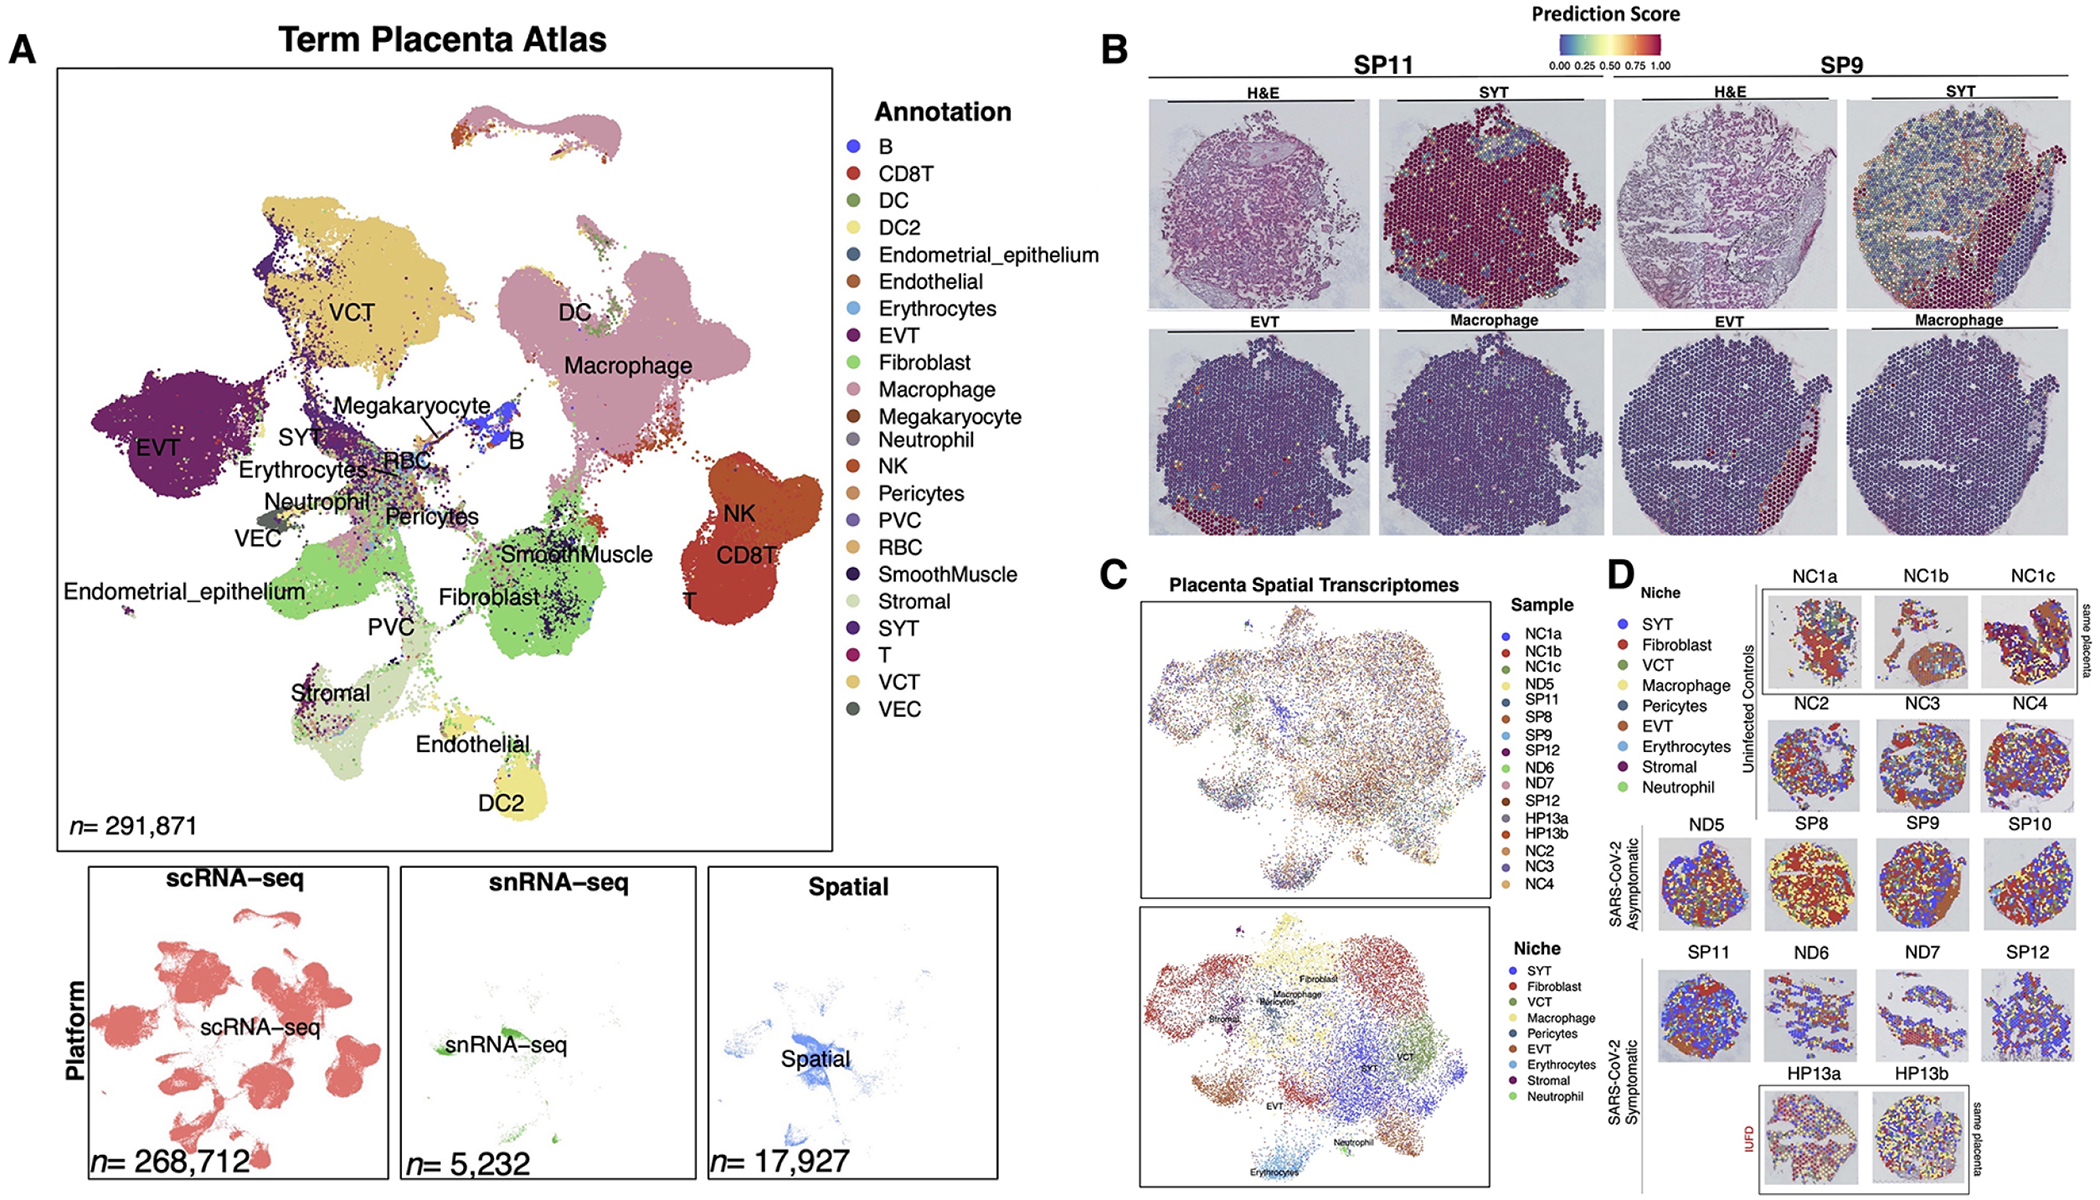
Methods: We utilized Visium Spatial Transcriptomics paired with H&E staining to generate 17,927 spatial transcriptomes. By integrating these spatial transcriptomes with 273,944 placental single-cell and single-nuclei transcriptomes, we generated an atlas composed of at least 22 subpopulations in the maternal decidua, fetal chorionic villi, and chorioamniotic membranes.
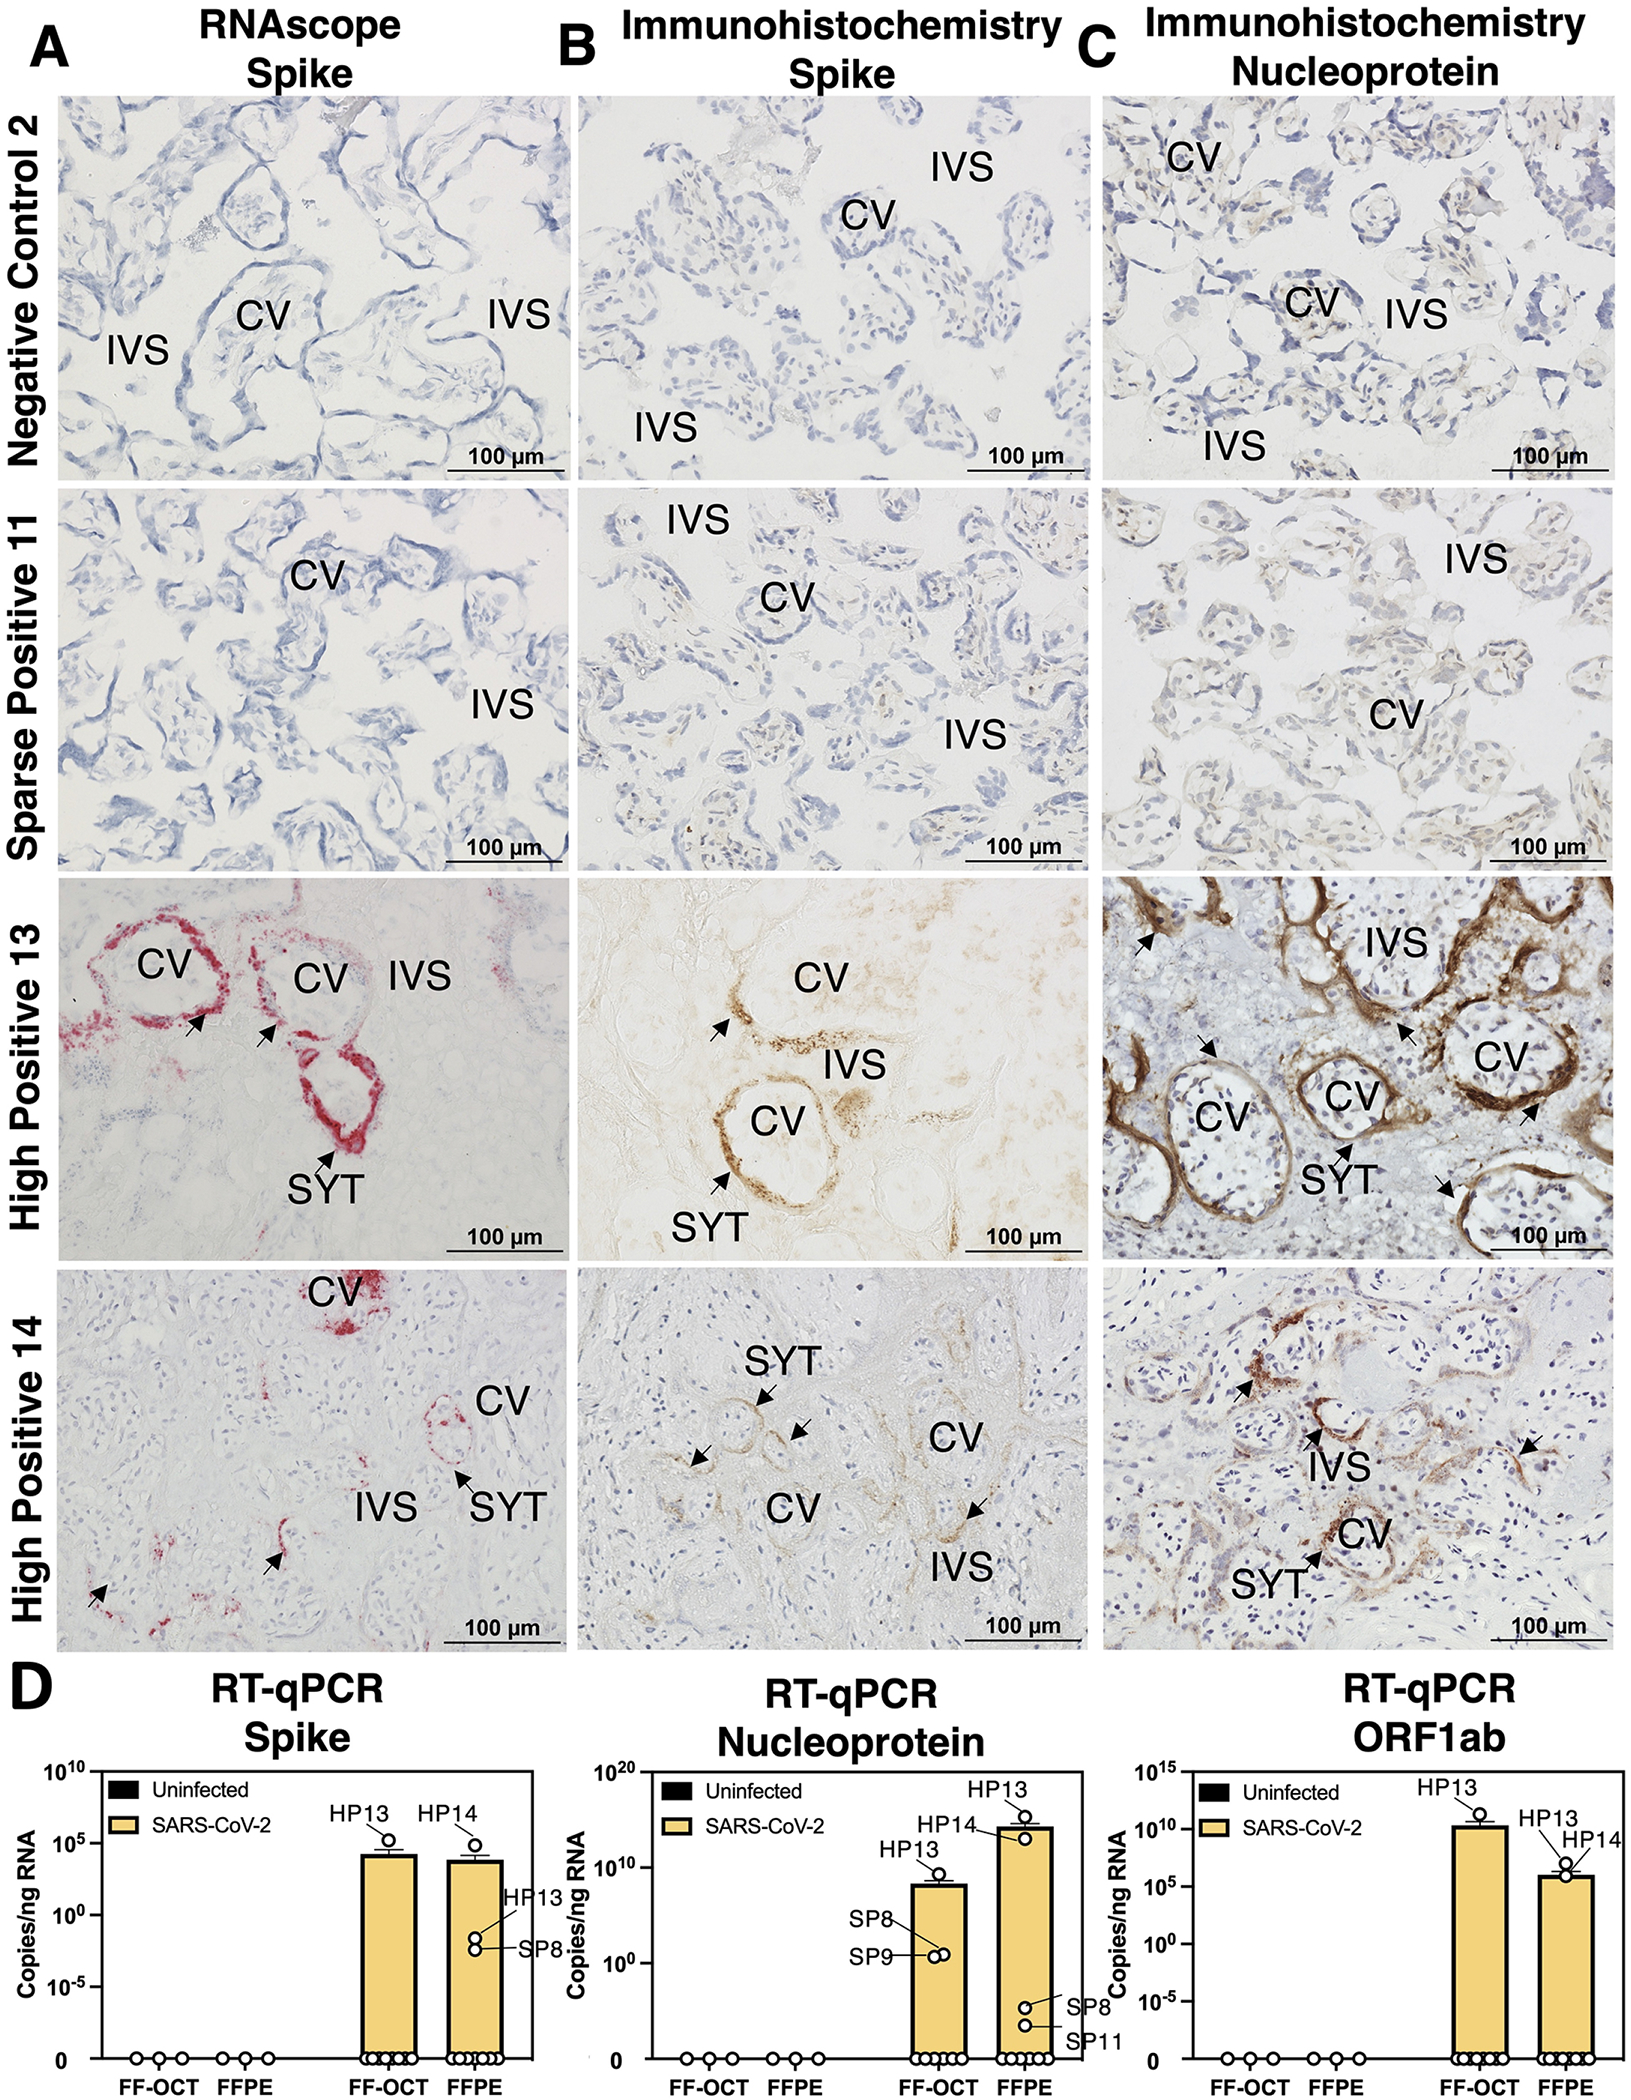
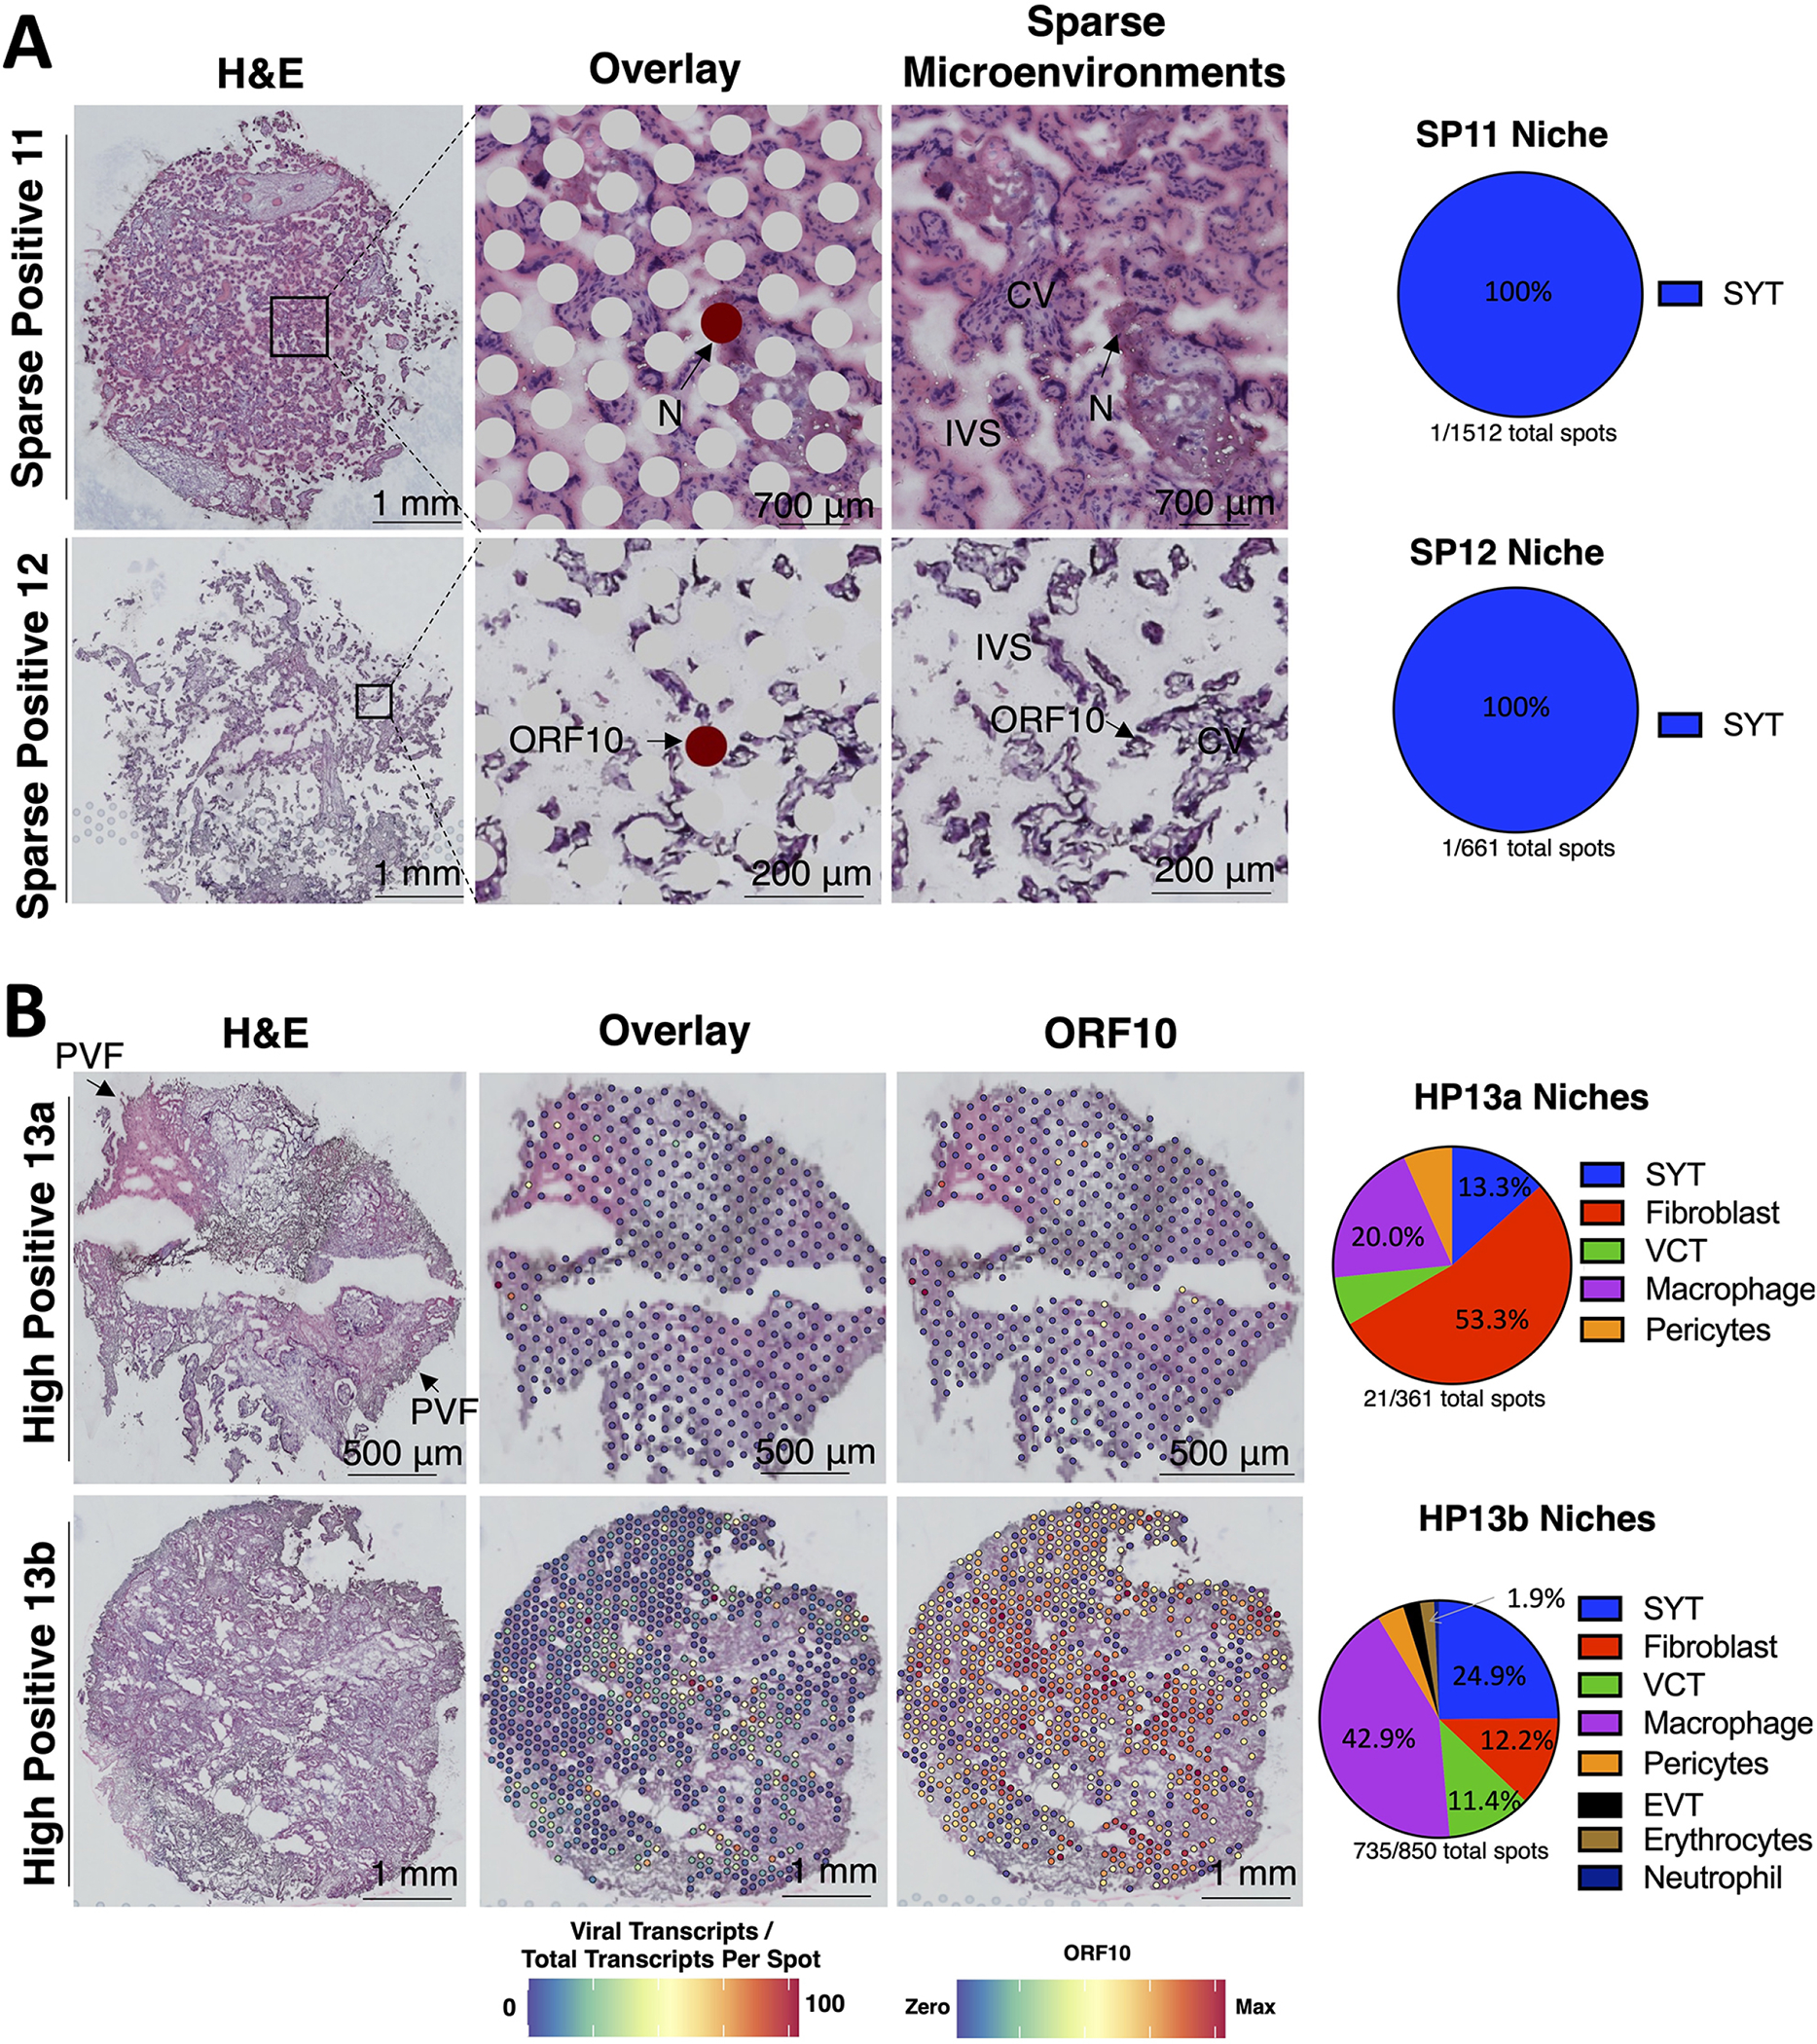
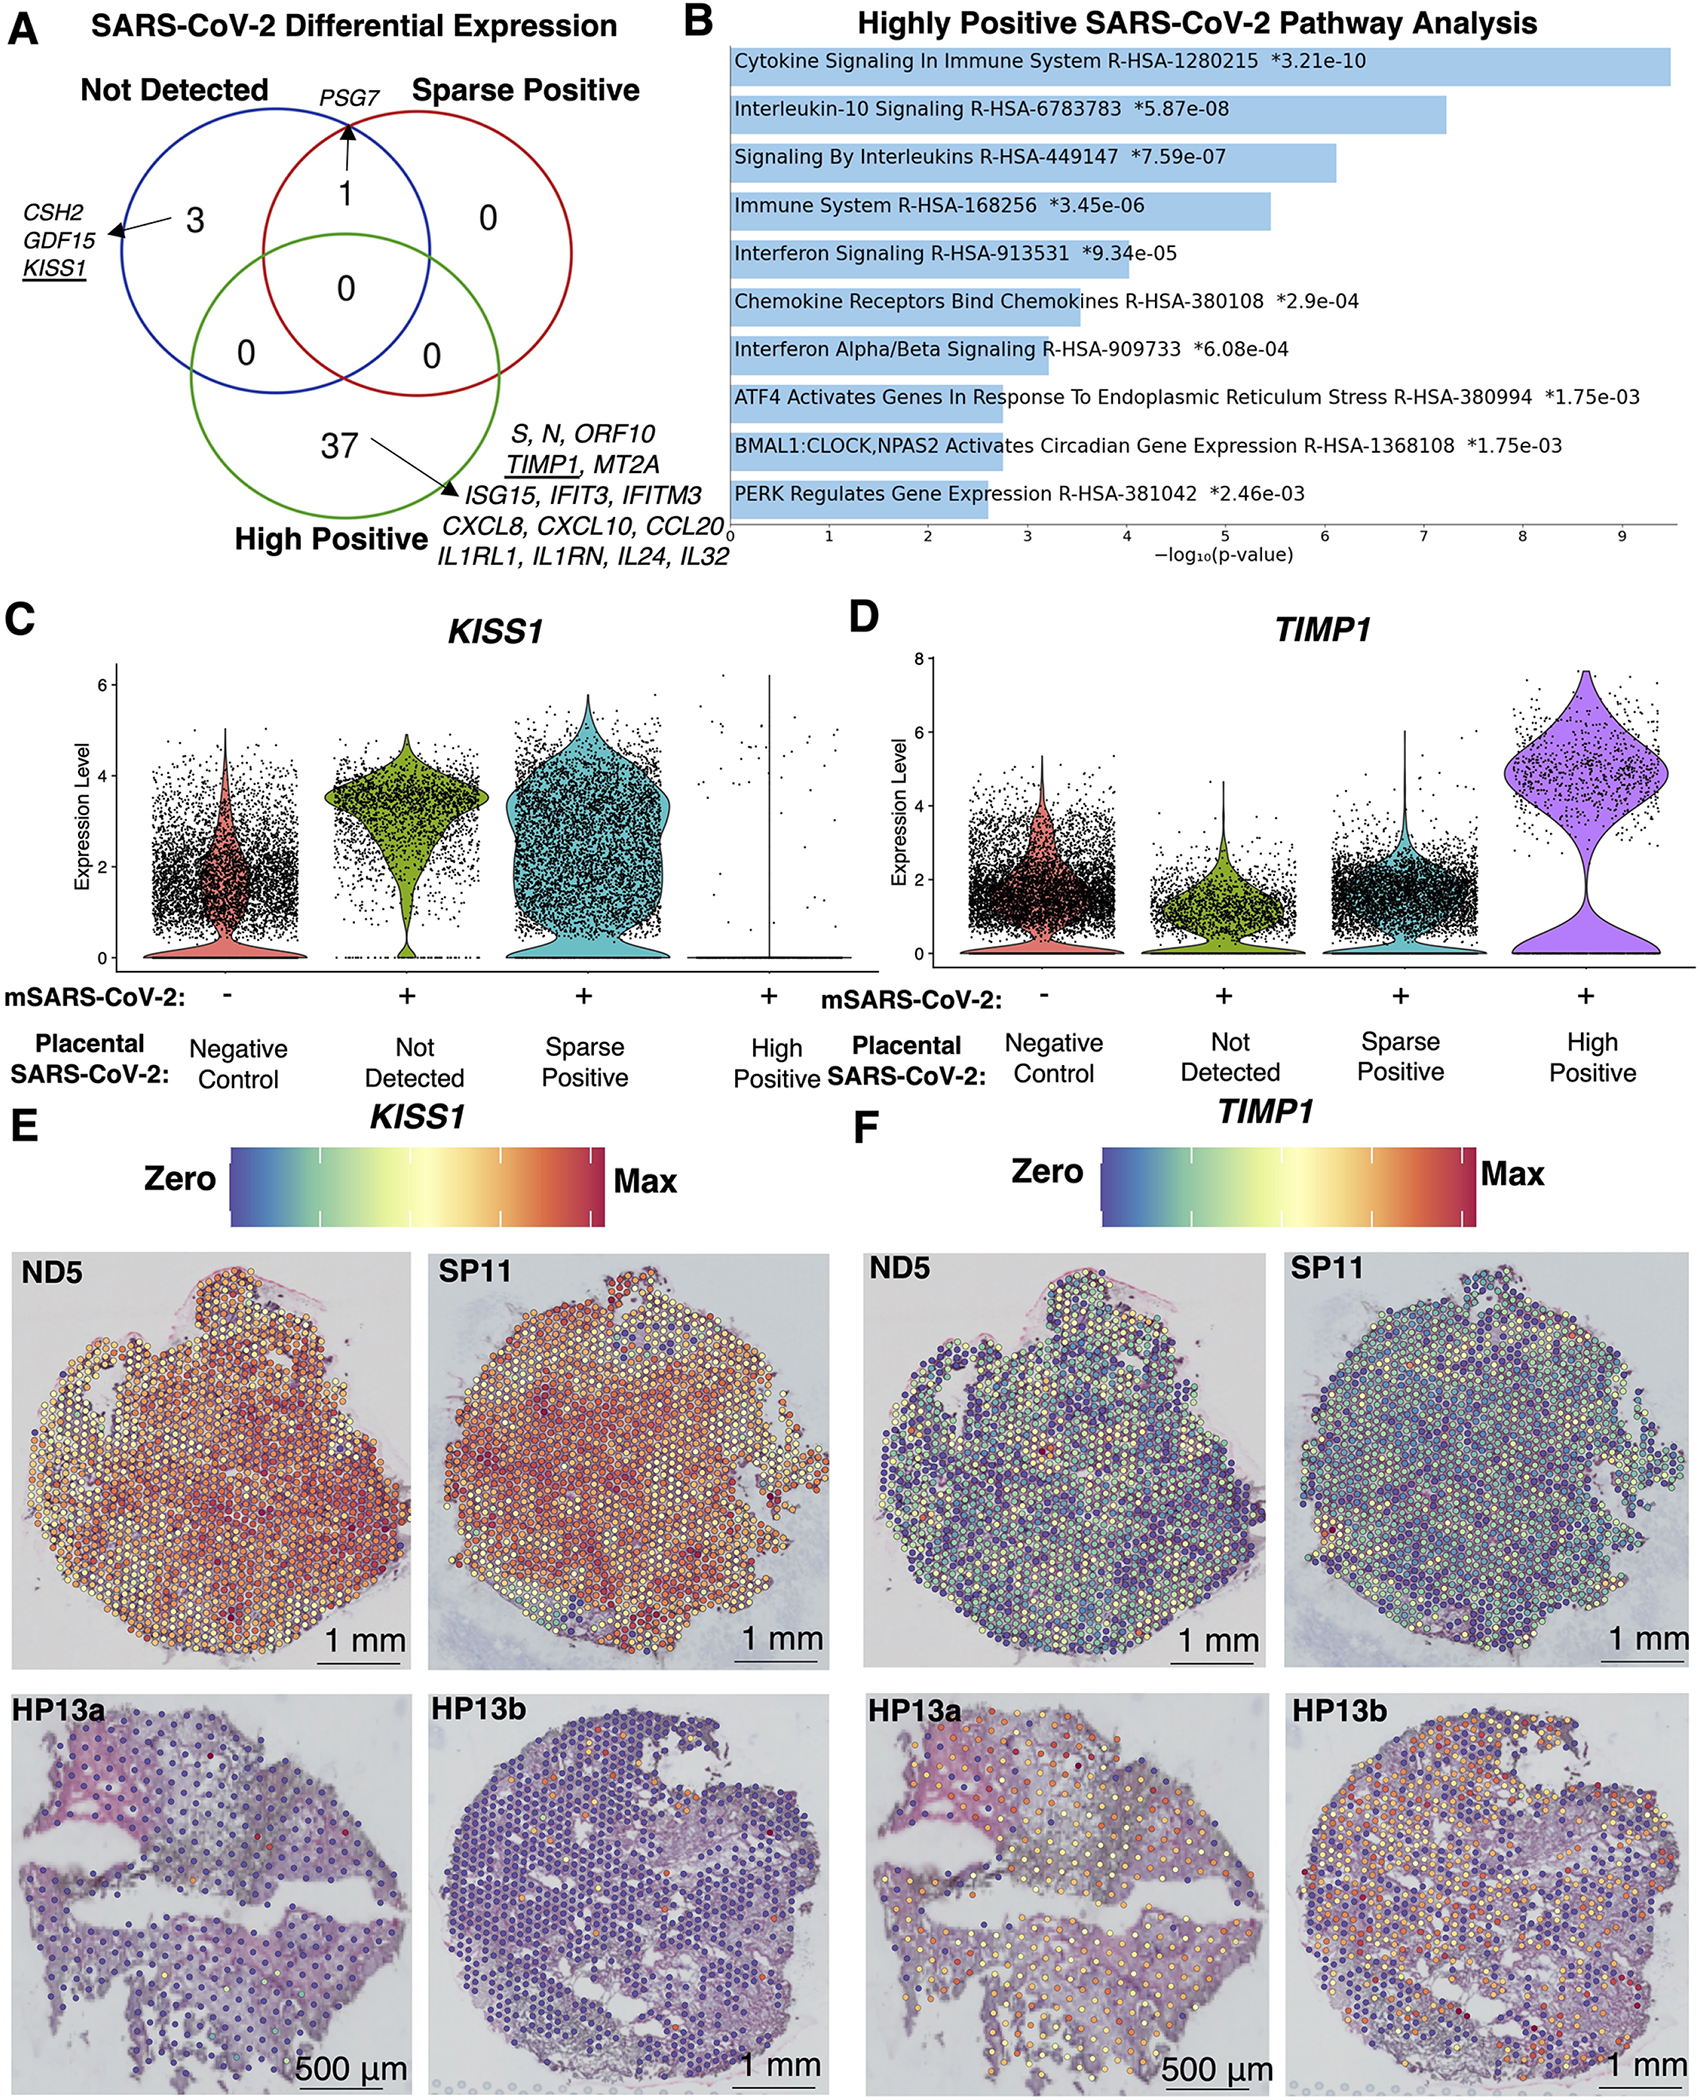
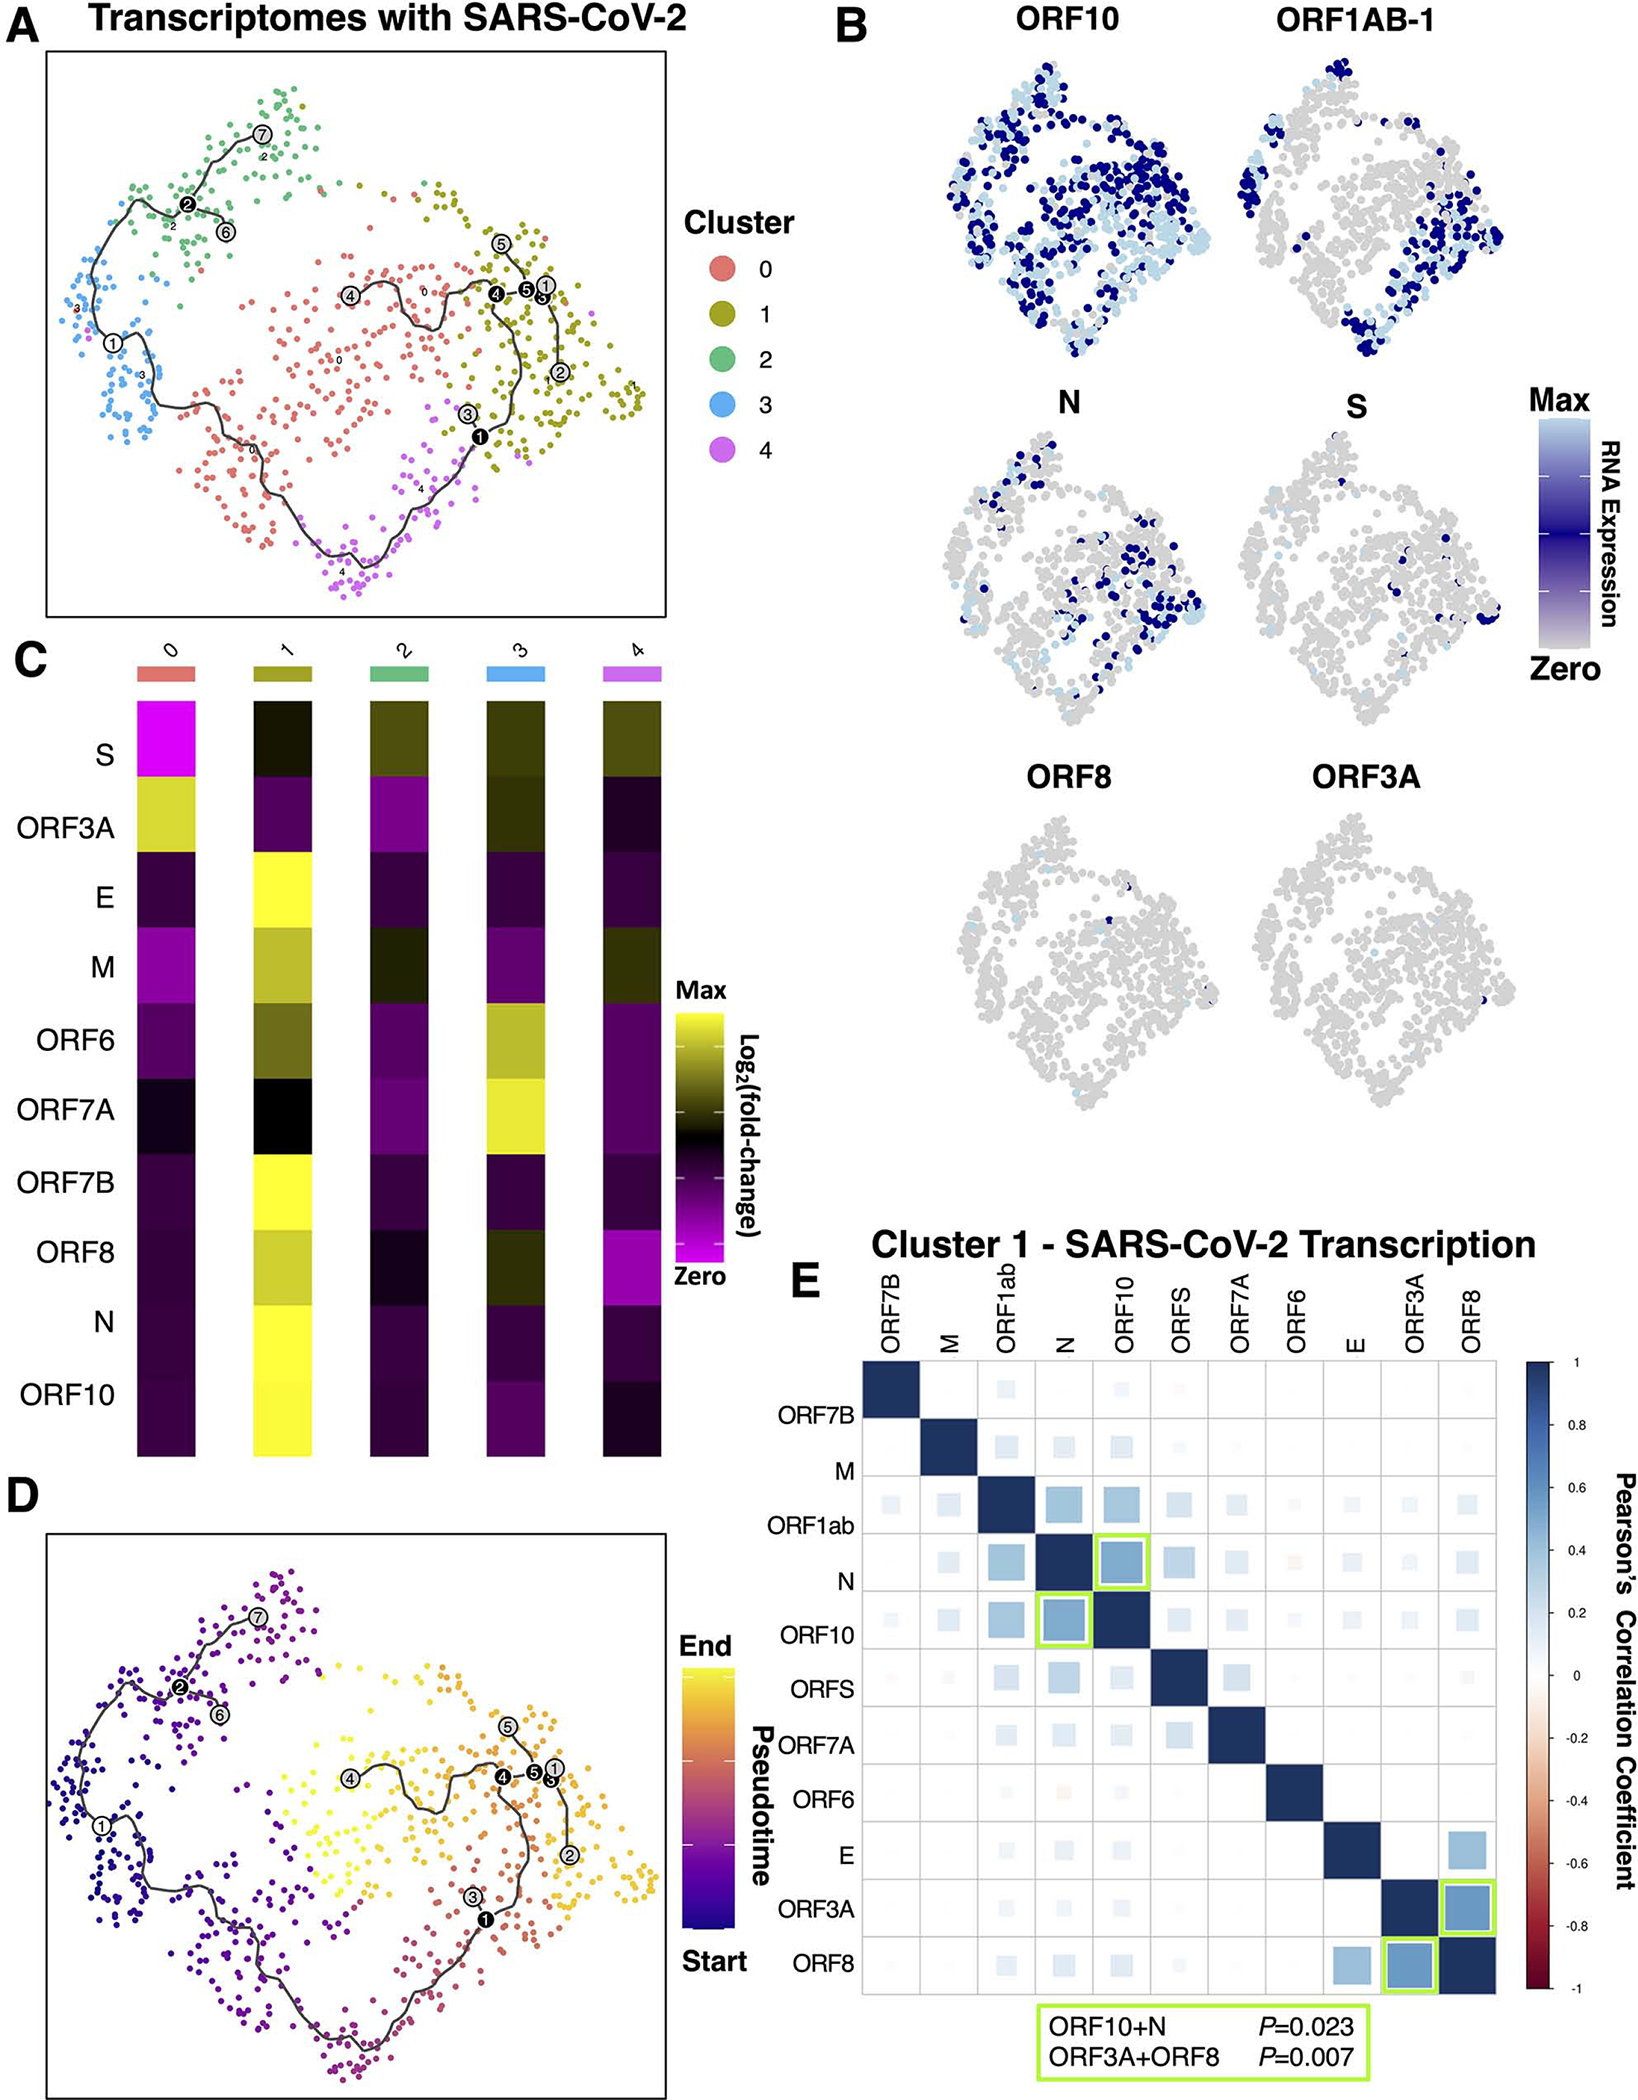
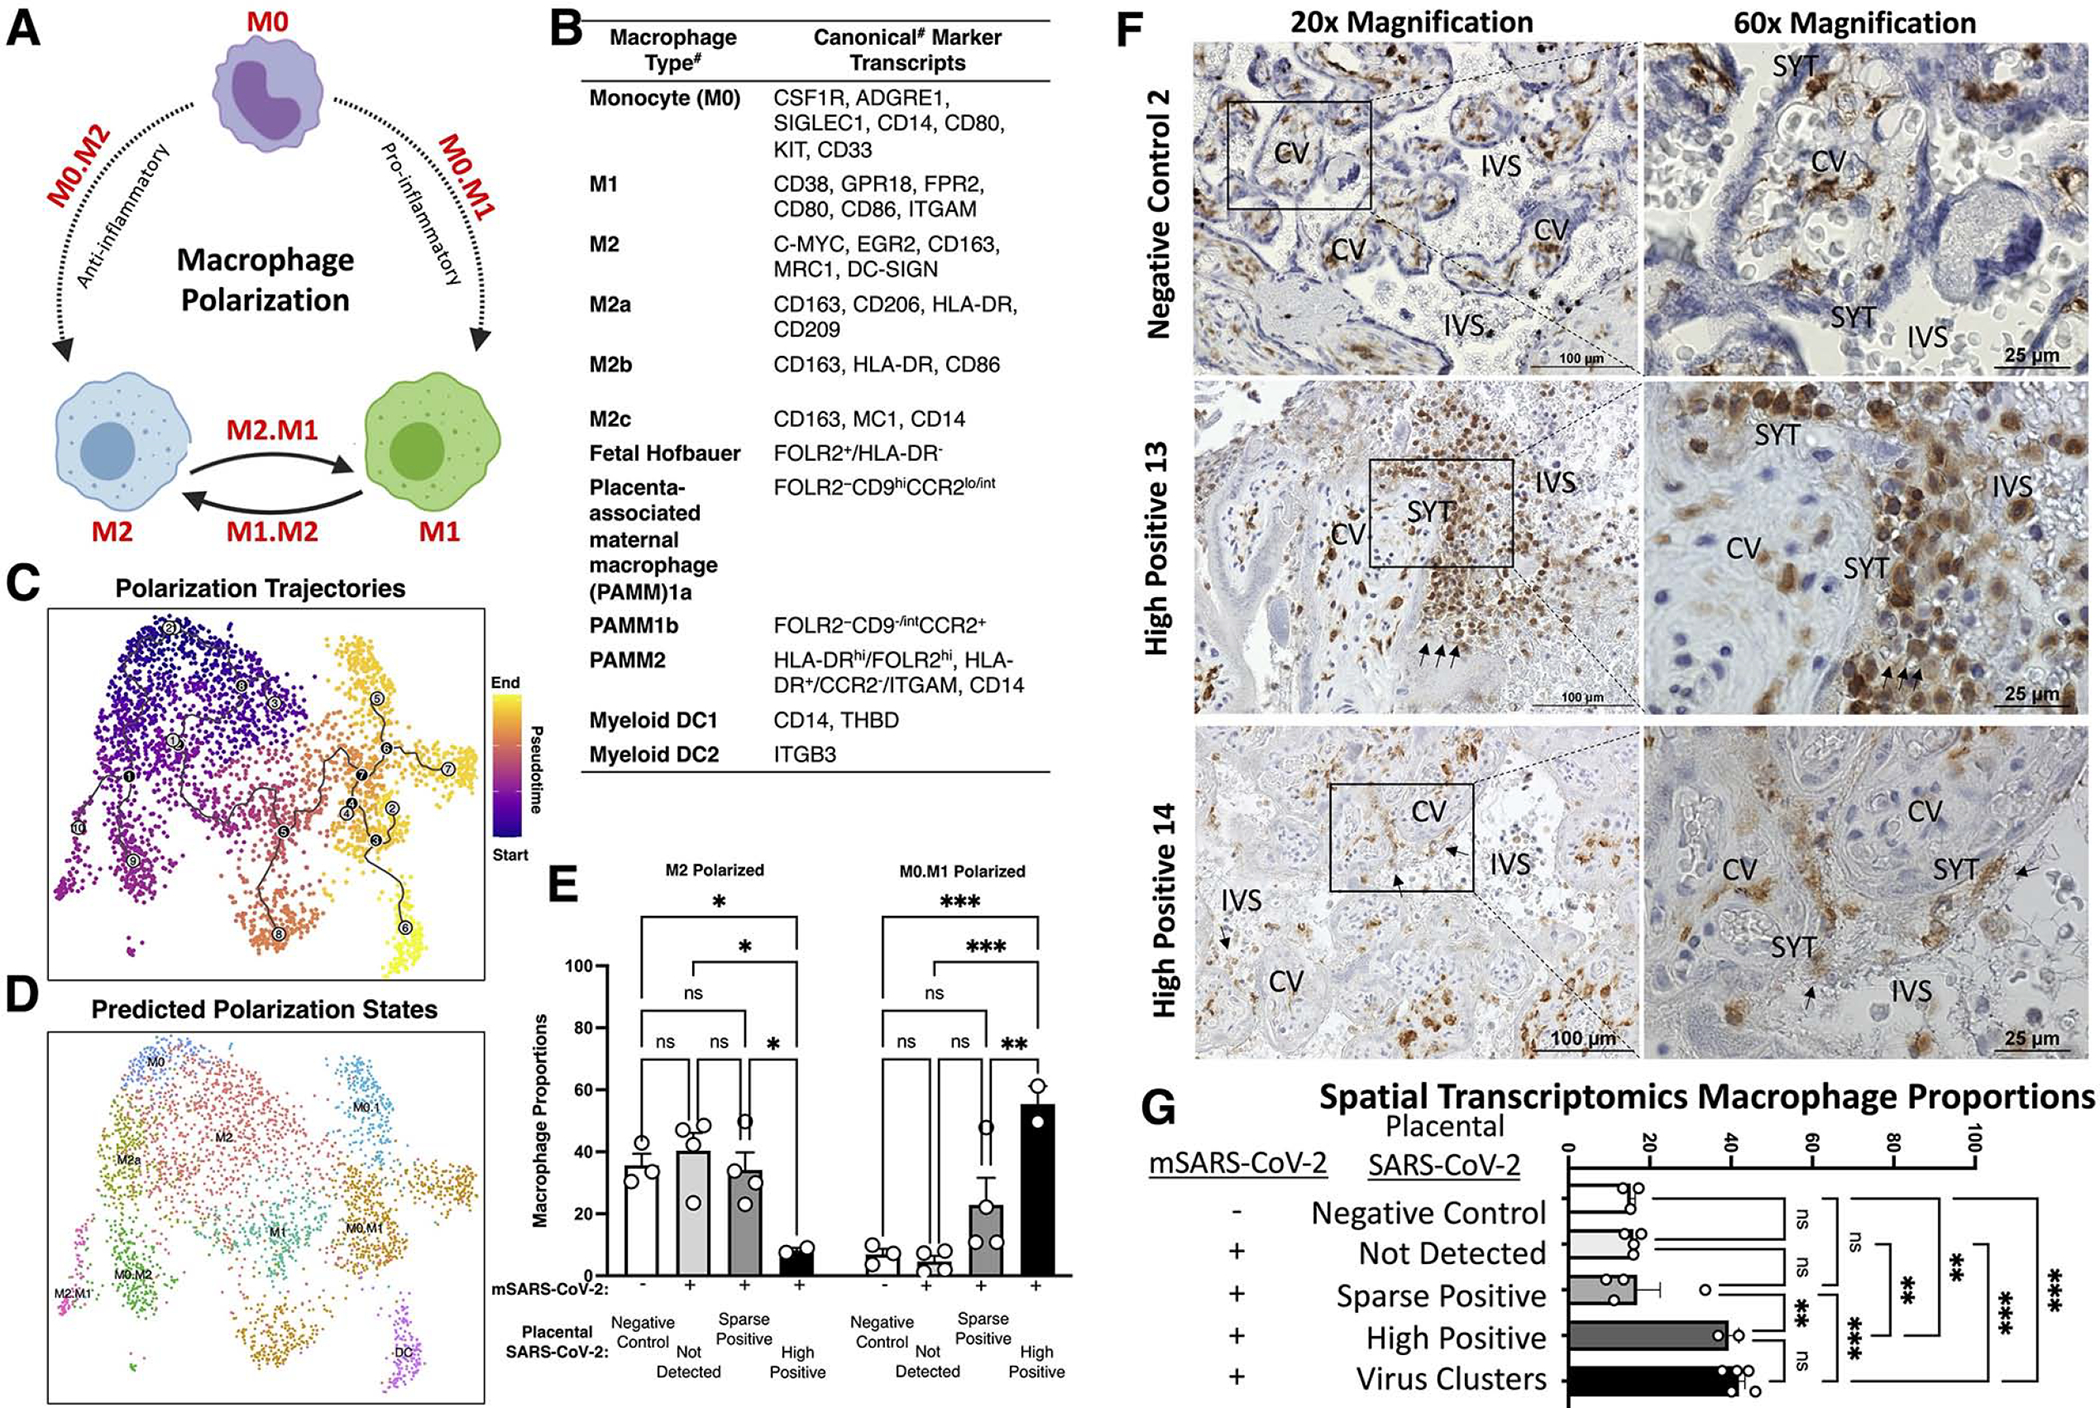
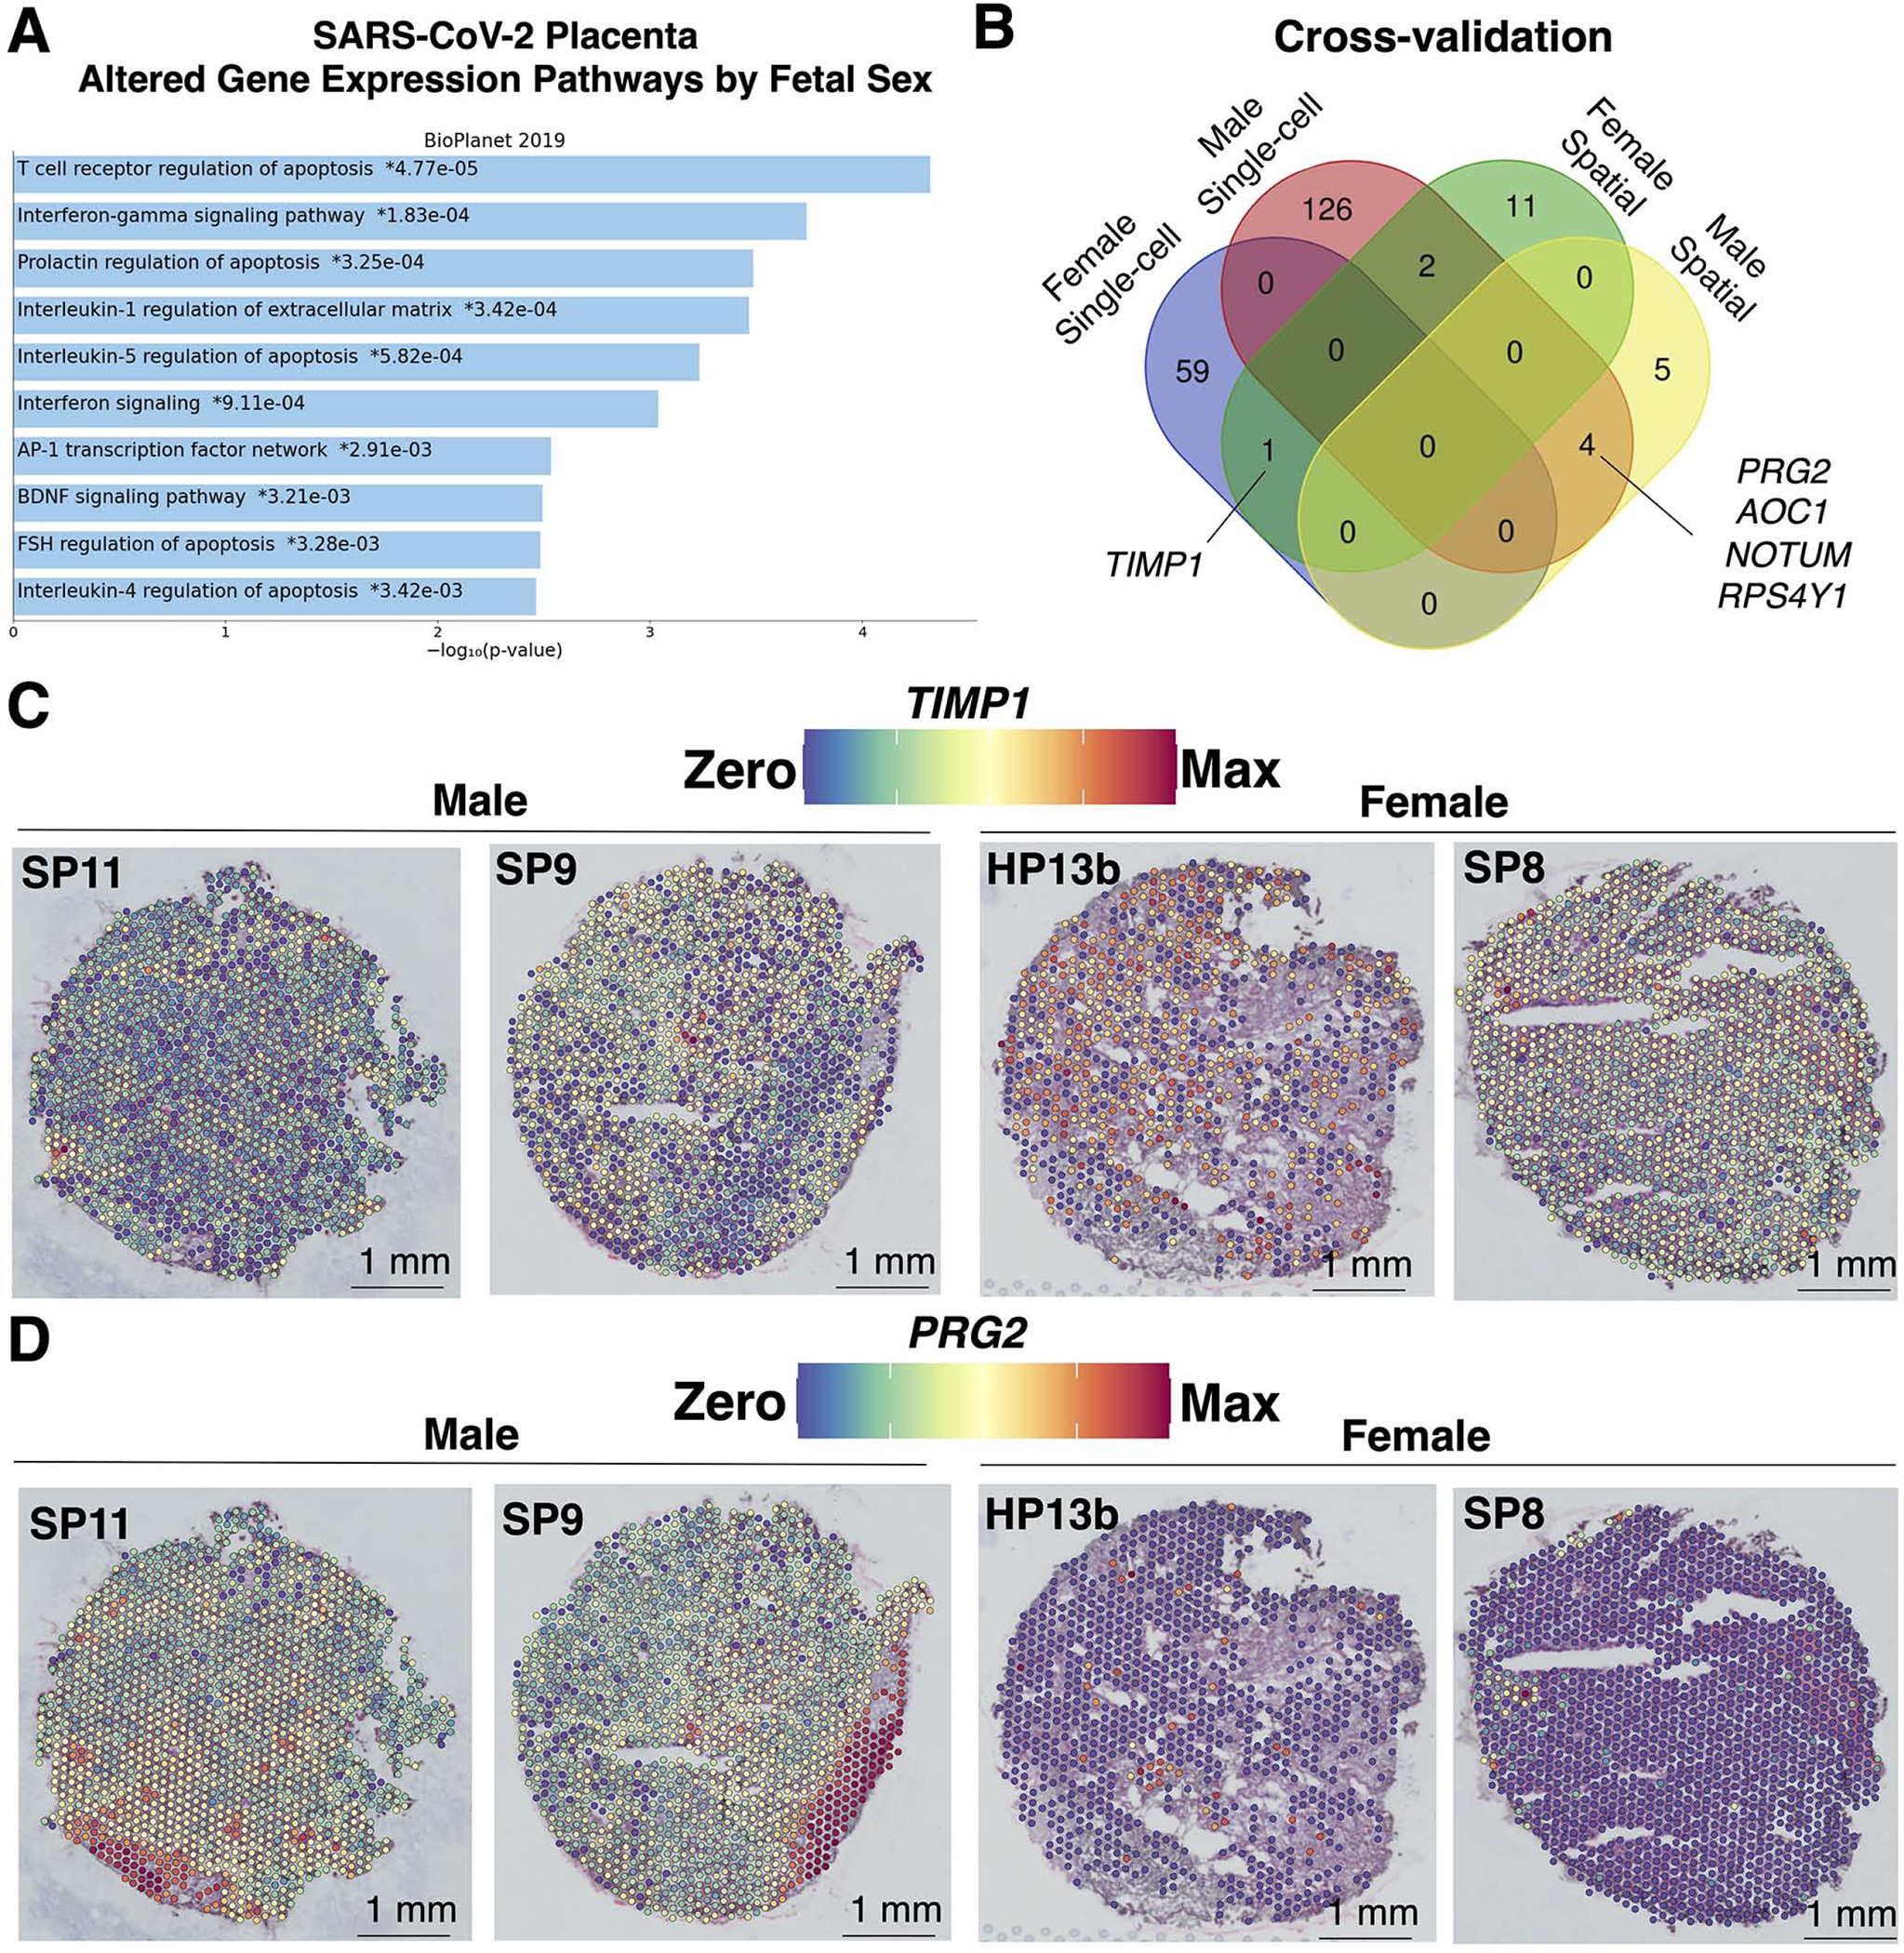
Findings: Comparisons of placentae from uninfected healthy controls (n = 4) with COVID-19 asymptomatic (n = 4) and symptomatic (n = 5) infected participants demonstrated that severe acute respiratory syndrome coronavirus 2 (SARS-CoV-2) detection in syncytiotrophoblasts occurred in both the presence and the absence of maternal clinical disease. With spatial transcriptomics, we found that the limit of detection for SARS-CoV-2 was 1/7,000 cells, and placental niches without detectable viral transcripts were unperturbed. In contrast, niches with high SARS-CoV-2 transcript levels were associated with significant upregulation in pro-inflammatory cytokines and interferon-stimulated genes, altered metallopeptidase signaling (TIMP1), with coordinated shifts in macrophage polarization, histiocytic intervillositis, and perivillous fibrin deposition. Fetal sex differences in gene expression responses to SARS-CoV-2 were limited, with confirmed mapping limited to the maternal decidua in males.
Conclusions: High-resolution placental transcriptomics with spatial resolution revealed dynamic responses to SARS-CoV-2 in coordinate microenvironments in the absence and presence of clinically evident disease.
Funding: This work was supported by the NIH (R01HD091731 and T32-HD098069), NSF (2208903), the Burroughs Welcome Fund and the March of Dimes Preterm Birth Research Initiatives, and a Career Development Award from the American Society of Gene and Cell Therapy.
Keywords: COVID-19; Translation to patients; maternal-fetal; microenvironment; perinatal; visium.
Copyright © 2023 The Author(s). Published by Elsevier Inc. All rights reserved.
Conflict of interest statement
Declaration of interests The authors declare no competing interests.
Figures
Similar articles
-
Zika virus co-opts microRNA networks to persist in placental niches detected by spatial transcriptomics.Am J Obstet Gynecol. 2024 Feb;230(2):251.e1-251.e17. doi: 10.1016/j.ajog.2023.08.012. Epub 2023 Aug 19. Am J Obstet Gynecol. 2024. PMID: 37598997 Free PMC article.
-
Severe Acute Respiratory Syndrome Coronavirus 2 Placental Infection and Inflammation Leading to Fetal Distress and Neonatal Multi-Organ Failure in an Asymptomatic Woman.J Pediatric Infect Dis Soc. 2021 May 28;10(5):556-561. doi: 10.1093/jpids/piaa153. J Pediatric Infect Dis Soc. 2021. PMID: 33367801 Free PMC article.
-
Diminished antiviral innate immune gene expression in the placenta following a maternal SARS-CoV-2 infection.Am J Obstet Gynecol. 2023 Apr;228(4):463.e1-463.e20. doi: 10.1016/j.ajog.2022.09.023. Epub 2022 Sep 17. Am J Obstet Gynecol. 2023. PMID: 36126729 Free PMC article.
-
Impact of SARS-CoV-2 infection during pregnancy on the placenta and fetus.Semin Perinatol. 2024 Jun;48(4):151919. doi: 10.1016/j.semperi.2024.151919. Epub 2024 Jun 6. Semin Perinatol. 2024. PMID: 38897829 Free PMC article. Review.
-
Placental Pathology of COVID-19 with and without Fetal and Neonatal Infection: Trophoblast Necrosis and Chronic Histiocytic Intervillositis as Risk Factors for Transplacental Transmission of SARS-CoV-2.Viruses. 2020 Nov 15;12(11):1308. doi: 10.3390/v12111308. Viruses. 2020. PMID: 33203131 Free PMC article. Review.
Cited by
-
Dual spatial host-bacterial gene expression in Mycobacterium abscessus respiratory infections.Commun Biol. 2024 Oct 9;7(1):1287. doi: 10.1038/s42003-024-06929-5. Commun Biol. 2024. PMID: 39384974 Free PMC article.
-
Transplacental Transmission of SARS-CoV-2: A Narrative Review.Medicina (Kaunas). 2024 Sep 18;60(9):1517. doi: 10.3390/medicina60091517. Medicina (Kaunas). 2024. PMID: 39336558 Free PMC article. Review.
-
Remodeling of the chromatin landscape in peripheral blood cells in patients with severe Delta COVID-19.Front Immunol. 2024 Dec 6;15:1415317. doi: 10.3389/fimmu.2024.1415317. eCollection 2024. Front Immunol. 2024. PMID: 39712003 Free PMC article.
-
Maternal SARS-CoV-2 infection in pregnancy disrupts gene expression in Hofbauer cells with limited impact on cytotrophoblasts.PLoS Pathog. 2024 Feb 7;20(2):e1011990. doi: 10.1371/journal.ppat.1011990. eCollection 2024 Feb. PLoS Pathog. 2024. PMID: 38324589 Free PMC article.
-
Zika virus co-opts microRNA networks to persist in placental niches detected by spatial transcriptomics.Am J Obstet Gynecol. 2024 Feb;230(2):251.e1-251.e17. doi: 10.1016/j.ajog.2023.08.012. Epub 2023 Aug 19. Am J Obstet Gynecol. 2024. PMID: 37598997 Free PMC article.
References
-
- Vousden N, Bunch K, Morris E, Simpson N, Gale C, O’Brien P, Quigley M, Brocklehurst P, Kurinczuk JJ, and Knight M (2021). The incidence, characteristics and outcomes of pregnant women hospitalized with symptomatic and asymptomatic SARS-CoV-2 infection in the UK from March to September 2020: A national cohort study using the UK Obstetric Surveillance System (UKOSS). PLoS One 16, e0251123. 10.1371/journal.pone.0251123. - DOI - PMC - PubMed
-
- Cruz-Lemini M, Ferriols Perez E, de la Cruz Conty ML, Cano Aguilar A, Encinas Pardilla MB, Prats Rodriguez P, Muner Hernando M, Forcen Acebal L, Pintado Recarte P, Medina Mallen MDC, et al. (2021). Obstetric Outcomes of SARS-CoV-2 Infection in Asymptomatic Pregnant Women. Viruses 13. 10.3390/v13010112. - DOI - PMC - PubMed
Publication types
MeSH terms
Grants and funding
LinkOut - more resources
Full Text Sources
Medical
Molecular Biology Databases
Research Materials
Miscellaneous
