

Comparative evaluation of glomerular morphometric techniques reveals differential technical artifacts between focal segmental glomerulosclerosis and normal glomeruli
- PMID: 37423891
- PMCID: PMC10329935
- DOI: 10.14814/phy2.15688
Comparative evaluation of glomerular morphometric techniques reveals differential technical artifacts between focal segmental glomerulosclerosis and normal glomeruli
Abstract
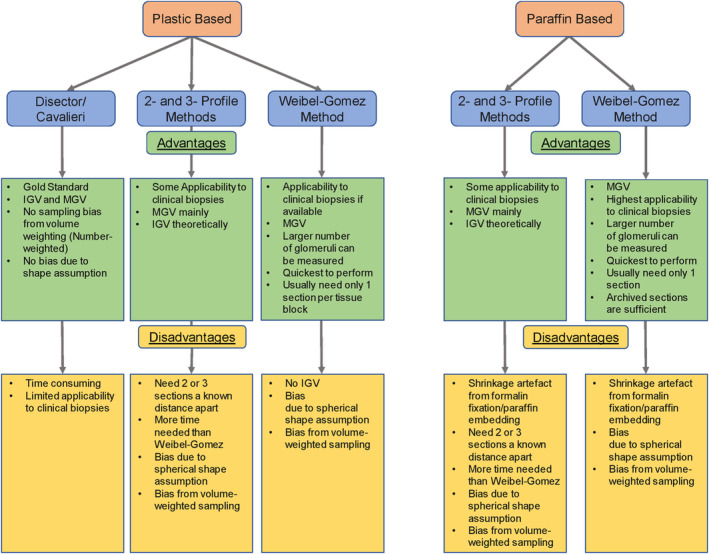
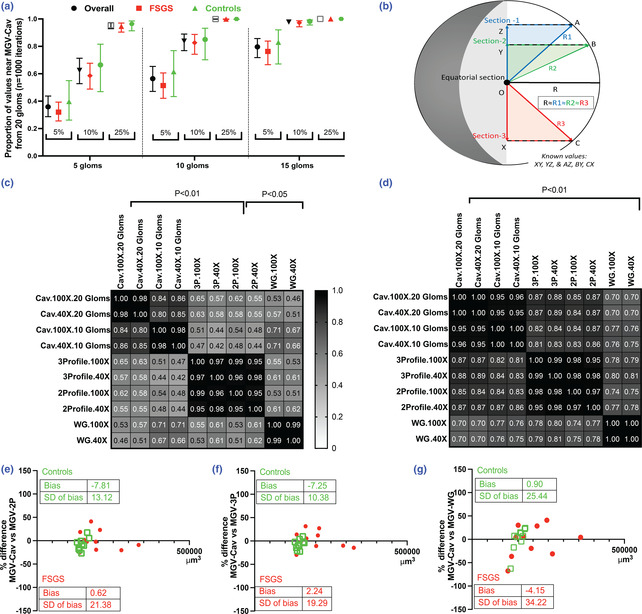
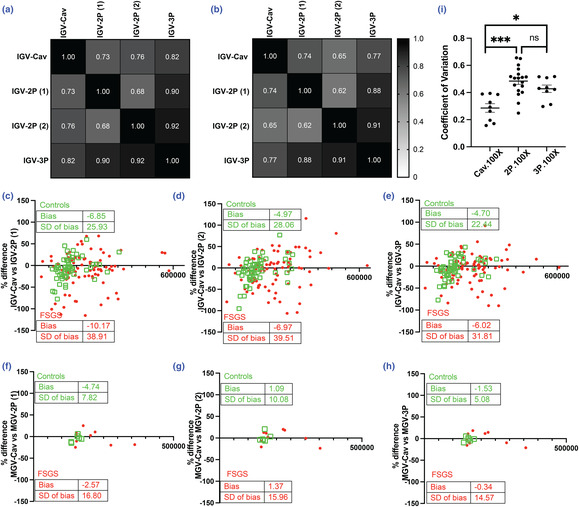
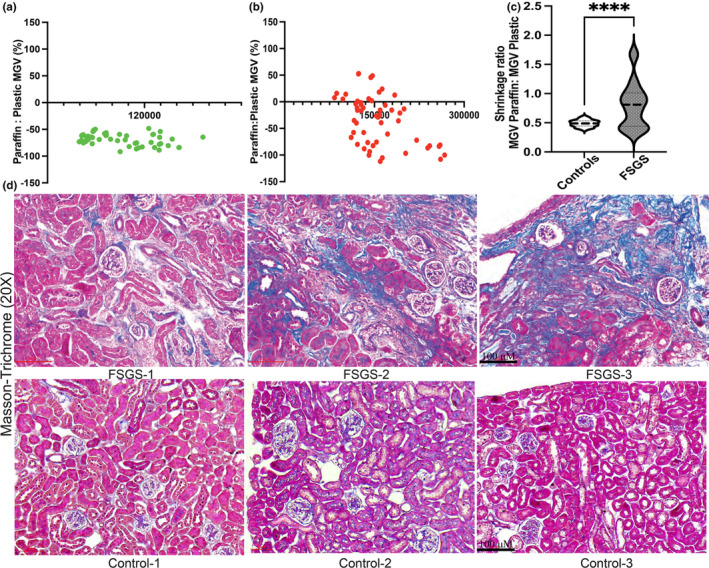
Morphometric estimates of mean or individual glomerular volume (MGV, IGV) have biological implications, over and above qualitative histologic data. However, morphometry is time-consuming and requires expertise limiting its utility in clinical cases. We evaluated MGV and IGV using plastic- and paraffin-embedded tissue from 10 control and 10 focal segmental glomerulosclerosis (FSGS) mice (aging and 5/6th nephrectomy models) using the gold standard Cavalieri (Cav) method versus the 2-profile and Weibel-Gomez (WG) methods and a novel 3-profile method. We compared accuracy, bias and precision, and quantified results obtained when sampling differing numbers of glomeruli. In both FSGS and controls, we identified an acceptable precision for MGV of 10-glomerular sampling versus 20-glomerular sampling using the Cav method, while 5-glomerular sampling was less precise. In plastic tissue, 2- or 3-profile MGVs showed greater concordance with MGV when using Cav, versus MGV with WG. IGV comparisons using the same glomeruli reported a consistent underestimation bias with both 2- or 3-profile methods versus the Cav method. FSGS glomeruli showed wider variations in bias estimation than controls. Our 3-profile method offered incremental benefit to the 2-profile method in both IGV and MGV estimation (improved correlation coefficient, Lin's concordance and reduced bias). In our control animals, we quantified a shrinkage artifact of 52% from tissue processed for paraffin-embedded versus plastic-embedded tissue. FSGS glomeruli showed overall reduced shrinkage albeit with variable artifact signifying periglomerular/glomerular fibrosis. A novel 3-profile method offers slightly improved concordance with reduced bias versus 2-profile. Our findings have implications for future studies using glomerular morphometry.
Keywords: 3-Profile method; Cavalieri method; Weibel-Gomez method; glomerular morphometry.
© 2023 The Authors. Physiological Reports published by Wiley Periodicals LLC on behalf of The Physiological Society and the American Physiological Society.
Conflict of interest statement
No conflicts of interest, financial or otherwise, are declared by the authors.
Figures
Similar articles
-
Glomerular growth in childhood focal segmental glomerulosclerosis.Pediatr Nephrol. 1998 Feb;12(2):108-12. doi: 10.1007/s004670050415. Pediatr Nephrol. 1998. PMID: 9543366 Clinical Trial.
-
Estimating mean glomerular volume using two arbitrary parallel sections.J Am Soc Nephrol. 2002 Nov;13(11):2697-705. doi: 10.1097/01.asn.0000033381.53882.25. J Am Soc Nephrol. 2002. PMID: 12397039
-
Morphometric study of arterioles and glomeruli in the aging kidney suggests focal loss of autoregulation.Kidney Int. 2003 Mar;63(3):1027-36. doi: 10.1046/j.1523-1755.2003.00831.x. Kidney Int. 2003. PMID: 12631084
-
Segmental sclerosing glomerular lesions.Pediatr Nephrol. 1993 Aug;7(4):370-4. doi: 10.1007/BF00857541. Pediatr Nephrol. 1993. PMID: 8398644 Review.
-
[Focal segmental glomerulosclerosis--the disease entity or histological type of glomerular injury?].Pol Merkur Lekarski. 2010 Jun;28(168):482-5. Pol Merkur Lekarski. 2010. PMID: 20642110 Review. Polish.
Cited by
-
Label-free multimodal optical biopsy reveals biomolecular and morphological features of diabetic kidney tissue in 2D and 3D.Nat Commun. 2025 May 15;16(1):4509. doi: 10.1038/s41467-025-59163-w. Nat Commun. 2025. PMID: 40374604 Free PMC article.
-
Label-Free Optical Biopsy Reveals Biomolecular and Morphological Features of Diabetic Kidney Tissue in 2D and 3D.bioRxiv [Preprint]. 2024 Oct 29:2024.10.27.620507. doi: 10.1101/2024.10.27.620507. bioRxiv. 2024. Update in: Nat Commun. 2025 May 15;16(1):4509. doi: 10.1038/s41467-025-59163-w. PMID: 39553929 Free PMC article. Updated. Preprint.
References
-
- Banu, K. , Lin, Q. , Basgen, J. M. , Planoutene, M. , Wei, C. , Reghuvaran, A. C. , Tian, X. , Shi, H. , Garzon, F. , Garzia, A. , Chun, N. , Cumpelik, A. , Santeusanio, A. D. , Zhang, W. , Das, B. , Salem, F. , Li, L. , Ishibe, S. , Cantley, L. G. , … Menon, M. C. (2021). AMPK mediates regulation of glomerular volume and podocyte survival. JCI Insight, 6, e150004. - PMC - PubMed
-
- Barisoni, L. , Nast, C. C. , Jennette, J. C. , Hodgin, J. B. , Herzenberg, A. M. , Lemley, K. V. , Conway, C. M. , Kopp, J. B. , Kretzler, M. , Lienczewski, C. , AVILA‐Casado, C. , Bagnasco, S. , Sethi, S. , Tomaszewski, J. , Gasim, A. H. , & Hewitt, S. M. (2013). Digital pathology evaluation in the multicenter nephrotic Syndrome study network (NEPTUNE). Clinical Journal of the American Society of Nephrology, 8, 1449–1459. - PMC - PubMed
-
- Dean, N. , & Pagano, M. (2015). Evaluating confidence interval methods for binomial proportions in clustered surveys. Journal of Survey Statistics and Methodology, 3, 484–503.
-
- Denic, A. , Ricaurte, L. , Lopez, C. L. , Narasimhan, R. , Lerman, L. O. , Lieske, J. C. , Thompson, R. H. , Kremers, W. K. , & Rule, A. D. (2019). Glomerular volume and glomerulosclerosis at different depths within the human kidney. Journal of the American Society of Nephrology, 30, 1471–1480. - PMC - PubMed
-
- Dorph‐Petersen, K. A. , Nyengaard, J. R. , & Gundersen, H. J. (2001). Tissue shrinkage and unbiased stereological estimation of particle number and size. Journal of Microscopy, 204, 232–246. - PubMed
Publication types
MeSH terms
Grants and funding
LinkOut - more resources
Full Text Sources
Medical
