. 2023 Nov;19(11):2997-3013.
doi: 10.1080/15548627.2023.2234797. Epub 2023 Jul 13.

Tethering ATG16L1 or LC3 induces targeted autophagic degradation of protein aggregates and mitochondria

Affiliations

Tethering ATG16L1 or LC3 induces targeted autophagic degradation of protein aggregates and mitochondria

Ligang Mei et al. Autophagy. 2023 Nov.

Abstract

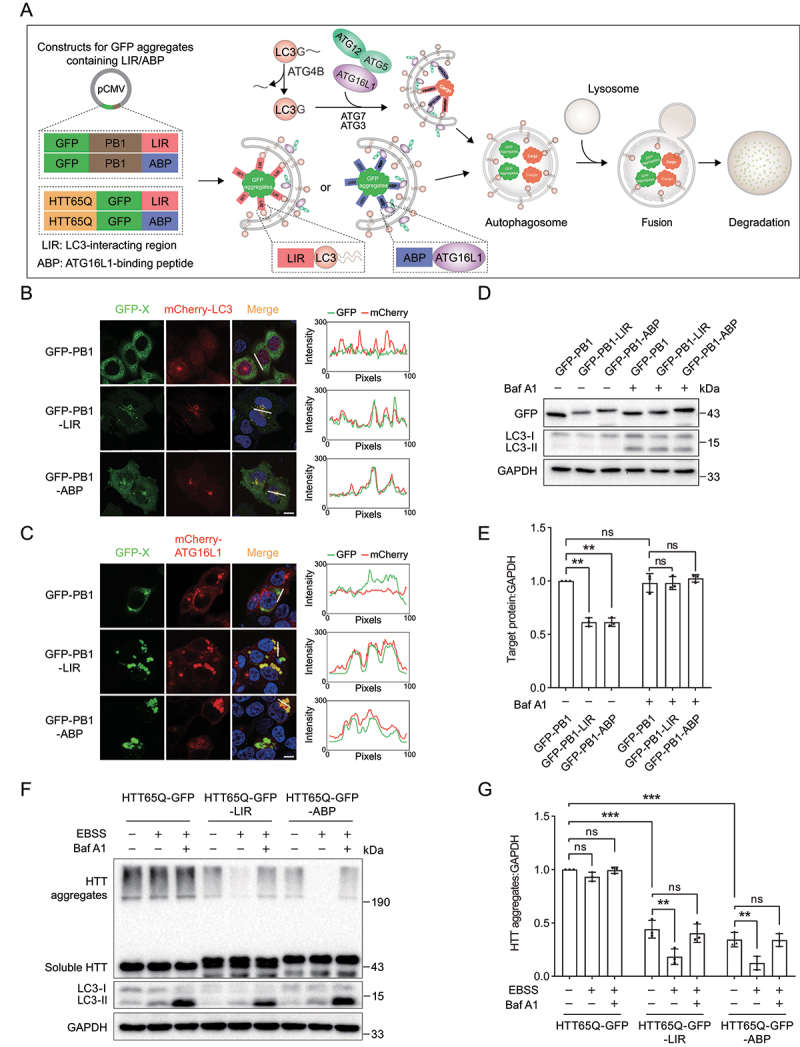
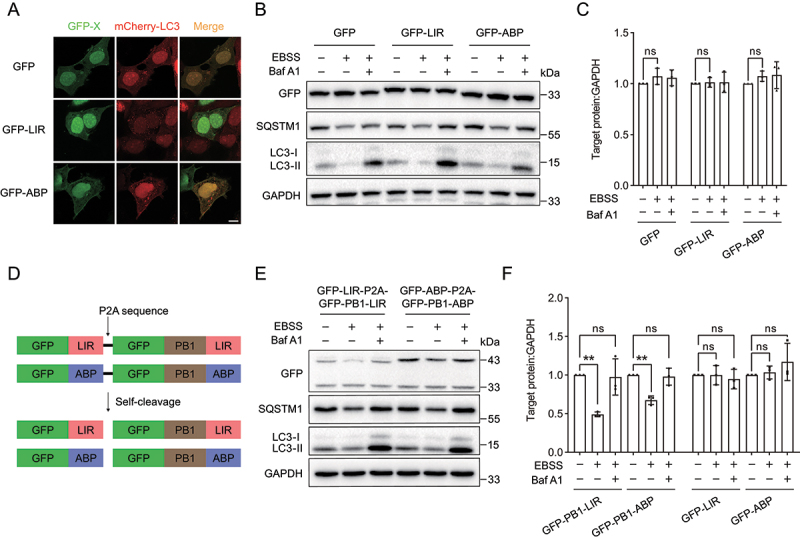
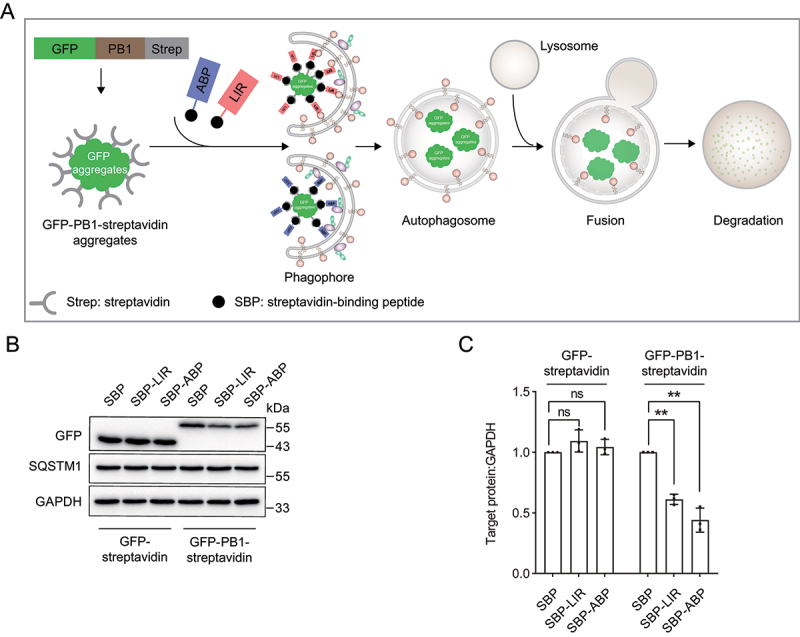
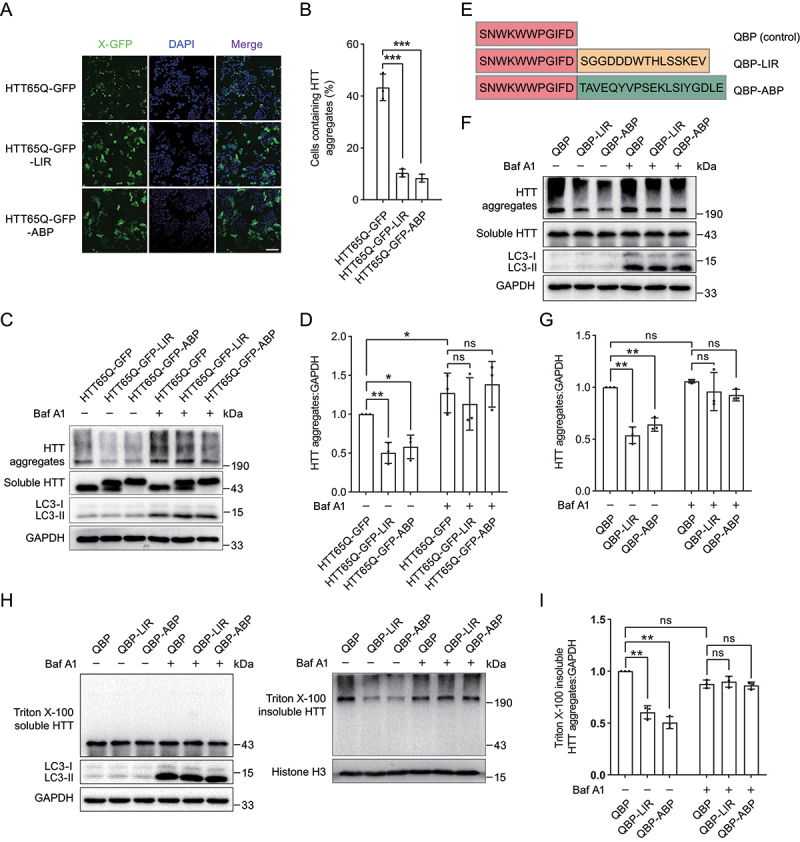
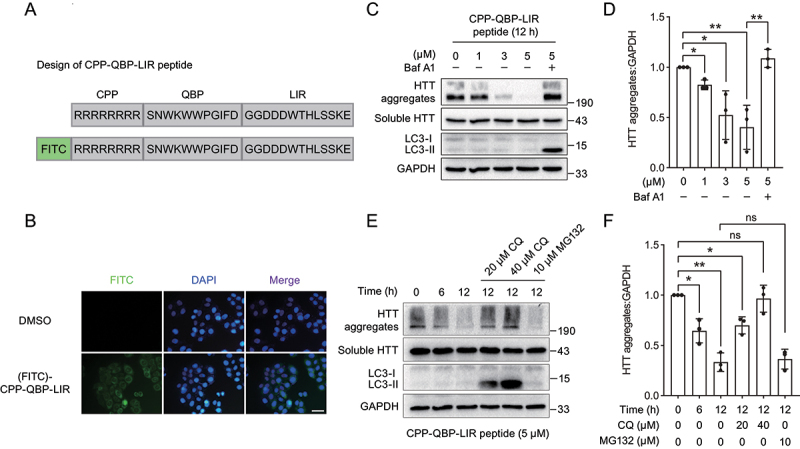
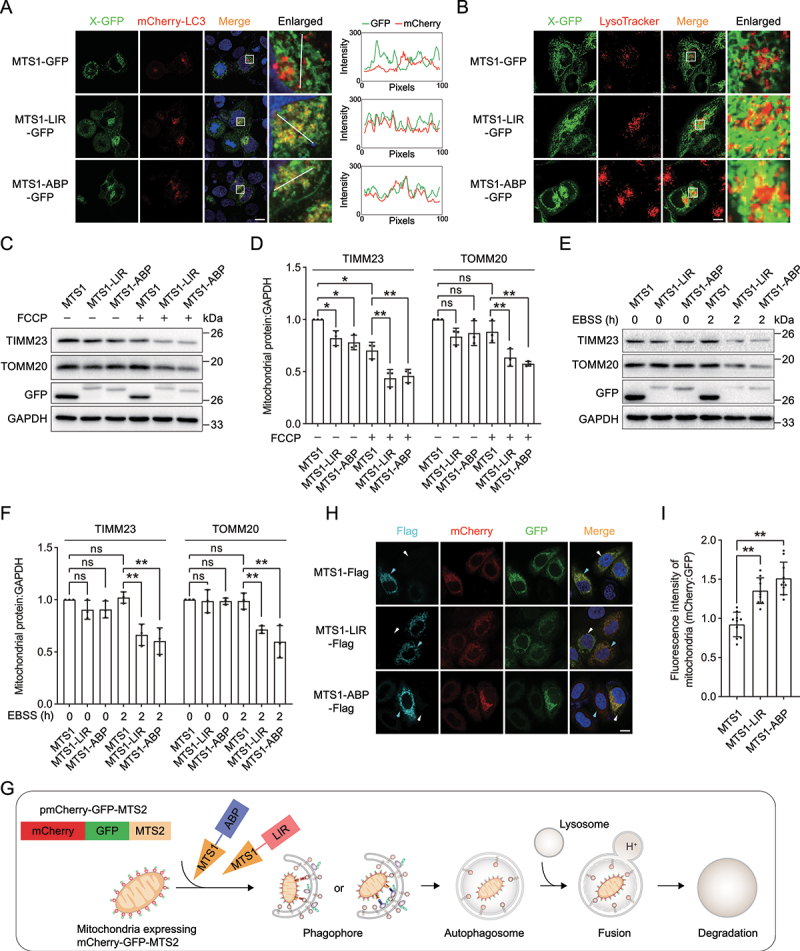
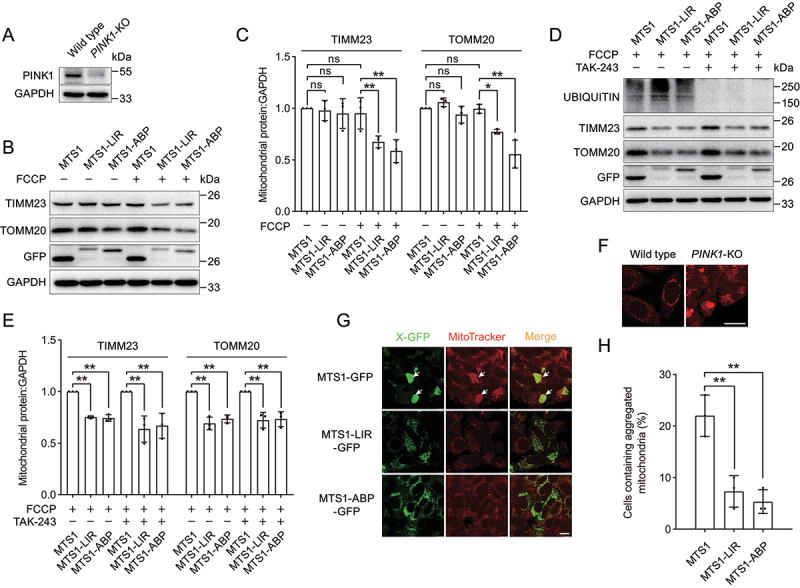
Proteolysis-targeting chimeras (PROTACs) based on the ubiquitin-proteasome system have made great progress in the field of drug discovery. There is mounting evidence that the accumulation of aggregation-prone proteins or malfunctioning organelles is associated with the occurrence of various age-related neurodegenerative disorders and cancers. However, PROTACs are inefficient for the degradation of such large targets due to the narrow entrance channel of the proteasome. Macroautophagy (hereafter referred to as autophagy) is known as a self-degradative process involved in the degradation of bulk cytoplasmic components or specific cargoes that are sequestered into autophagosomes. In the present study, we report the development of a generalizable strategy for the targeted degradation of large targets. Our results suggested that tethering large target models to phagophore-associated ATG16L1 or LC3 induced targeted autophagic degradation of the large target models. Furthermore, we successfully applied this autophagy-targeting degradation strategy to the targeted degradation of HTT65Q aggregates and mitochondria. Specifically, chimeras consisting of polyQ-binding peptide 1 (QBP) and ATG16L1-binding peptide (ABP) or LC3-interacting region (LIR) induced targeted autophagic degradation of pathogenic HTT65Q aggregates; and the chimeras consisting of mitochondria-targeting sequence (MTS) and ABP or LIR promoted targeted autophagic degradation of dysfunctional mitochondria, hence ameliorating mitochondrial dysfunction in a Parkinson disease cell model and protecting cells from apoptosis induced by the mitochondrial stress agent FCCP. Therefore, this study provides a new strategy for the selective proteolysis of large targets and enrich the toolkit for autophagy-targeting degradation.Abbreviations: ABP: ATG16L1-binding peptide; ATG16L1: autophagy related 16 like 1; ATTEC: autophagy-tethering compound; AUTAC: autophagy-targeting chimera; AUTOTAC: autophagy-targeting chimera; Baf A1: bafilomycin A1; BCL2: BCL2 apoptosis regulator; CALCOCO2/NDP52: calcium binding and coiled-coil domain 2; CASP3: caspase 3; CPP: cell-penetrating peptide; CQ: chloroquine phosphate; DAPI: 4',6-diamidino-2-phenylindole; DCM: dichloromethane; DMF: N,N-dimethylformamide; DMSO: dimethyl sulfoxide; EBSS: Earle's balanced salt solution; FCCP: carbonyl cyanide 4-(trifluoromethoxy)phenylhydrazone; FITC: fluorescein-5-isothiocyanate; GAPDH: glyceraldehyde-3-phosphate dehydrogenase; GFP: green fluorescent protein; HEK293: human embryonic kidney 293; HEK293T: human embryonic kidney 293T; HPLC: high-performance liquid chromatography; HRP: horseradish peroxidase; HTT: huntingtin; LIR: LC3-interacting region; MAP1LC3/LC3: microtubule associated protein 1 light chain 3; MFF: mitochondrial fission factor; MTS: mitochondria-targeting sequence; NBR1: NBR1 autophagy cargo receptor; NLRX1: NLR family member X1; OPTN: optineurin; P2A: self-cleaving 2A peptide; PB1: Phox and Bem1p; PBS: phosphate-buffered saline; PE: phosphatidylethanolamine; PINK1: PTEN induced kinase 1; PRKN: parkin RBR E3 ubiquitin protein ligase; PROTACs: proteolysis-targeting chimeras; QBP: polyQ-binding peptide 1; SBP: streptavidin-binding peptide; SDS-PAGE: sodium dodecyl sulfate-polyacrylamide gel electrophoresis; SPATA33: spermatogenesis associated 33; TIMM23: translocase of inner mitochondrial membrane 23; TMEM59: transmembrane protein 59; TOMM20: translocase of outer mitochondrial membrane 20; UBA: ubiquitin-associated; WT: wild type.

Keywords: ATG16L1; HTT65Q aggregates; LC3; autophagy-targeting degradation; mitochondria; proteolysis-targeting chimeras.


Conflict of interest statement

No potential conflict of interest was reported by the authors.

Figures

Figure 1.
Figure 1.
Tethering PB1 or HTT65Q aggregates to LC3 or ATG16L1 induces selective autophagy. (A) Scheme of autophagy-targeting degradation using LIR and ABP. Large targets exposing multivalent autophagy-targeting ligands (LIR or ABP) are recognized by the autophagy machineries LC3 and ATG16L1. (B) Representative images of mCherry-LC3 with GFP-PB1, GFP-PB-LIR or GFP-PB1-ABP in HeLa cells. Cells were transiently cotransfected with mCherry-LC3 and GFP-PB1, GFP-PB-LIR or GFP-PB1-ABP. The colocalization of mCherry-LC3 with GFP-PB1, GFP-PB-LIR or GFP-PB1-ABP was determined by calculating fluorescence intensity of the areas marked with white lines. (C) Representative images of mCherry-ATG16L1 with GFP-PB1, GFP-PB-LIR or GFP-PB1-ABP in HEK293T cells. The colocalization of mCherry-ATG16L1 with GFP-PB1, GFP-PB-LIR or GFP-PB1-ABP was determined by calculating fluorescence intensity of the areas marked with white lines. (D) Immunoblot analysis of GFP-PB1, GFP-PB-LIR and GFP-PB1-ABP expressed in HEK293 cells. Cells were transiently transfected with GFP-PB1, GFP-PB-LIR or GFP-PB1-ABP for 24 h and then treated with Baf A1 (1 μM) for 12 h. (E) Quantification of the levels of target proteins as in (D). (F) Immunoblot analysis of HTT65Q-GFP, HTT65Q-GFP-LIR and HTT65Q-GFP-ABP under starvation condition or Baf A1 treatment. HTT65Q-GFP, HTT65Q-GFP-LIR and HTT65Q-GFP-ABP were transiently transfected into HeLa cells for 24 h, followed by incubation in EBSS for 2 h. The autophagy inhibition group was treated with EBSS containing 1 µM Baf A1. (G) Quantification of the levels of target proteins as in (F). Data in (E) and (G) are presented as the mean ± SEM of three independent experiments. “ns”, no significant difference; *P < 0.05, **P < 0.01, Student’s t test. Scale bar: 10 μm.
Figure 2.
Figure 2.
The autophagy-targeting degradation strategy shows high selectivity for large protein aggregates. (A) Representative images of mCherry-LC3 with GFP, GFP-LIR or GFP-ABP in HEK293 cells. mCherry-LC3 was transiently cotransfected with GFP, GFP-LIR or GFP-ABP in HEK293 cells. (B) Immunoblot analysis of GFP, GFP-LIR and GFP-ABP under starvation condition. GFP, GFP-LIR and GFP-ABP were transiently transfected into HeLa cells for 24 h, followed by incubation in EBSS for 12 h. The autophagy inhibition group was treated with EBSS containing 1 µM Baf A1. (C) Quantification of the levels of target proteins as in (B). (D) Scheme of GFP-LIR-P2A-GFP-PB1-LIR and GFP-ABP-P2A-GFP-PB1-ABP constructs. The self-cleavage sequence P2A enables the same amounts of soluble and PB1-generated protein aggregates. (E) Immunoblot analysis of GFP-LIR-P2A-GFP-PB1-LIR and GFP-ABP-P2A-GFP-PB1-ABP under starvation condition. The constructs were transiently transfected into HeLa cells for 24 h, followed by incubation in EBSS for 12 h. The autophagy inhibition group was treated with EBSS containing 1 µM Baf A1. (F) Quantification of the levels of target proteins as in (E). Data in (C) and (F) are presented as the mean ± SEM of three independent experiments. “ns”, no significant difference; **p < 0.01, ***p < 0.001, Student’s t test. Scale bar: 10 μm.
Figure 3.
Figure 3.
Tethering PB1 aggregates to ATG16L1 or LC3 induces targeted autophagic degradation of PB1-streptavidin aggregates using streptavidin system. (A) The concept of streptavidin system. The streptavidin system consisting of the ligand SBP for streptavidin and the autophagy-targeting ligand LIR or ABP are expected to induce targeted degradation of PB1-streptavidin aggregates. (B) Immunoblot analysis of GFP-PB1-streptavidin and GFP-streptavidin upon streptavidin system expression. HEK293 cells stably expressing GFP-PB1-streptavidin and GFP-streptavidin were transiently transfected with streptavidin system SBP-LIR and SBP-ABP constructs. (C) Quantification of the protein levels of GFP-PB1-streptavidin and GFP-streptavidin as in (B). Data in (B) are presented as the mean ± SEM of three independent experiments. “ns”, no significant difference; **p < 0.01, Student’s t test.
Figure 4.
Figure 4.
Tethering ATG16L1 or LC3 induces targeted autophagic degradation of pathogenic HTT aggregates. (A) Representative images of HTT65Q-GFP-LIR and HTT65Q-GFP-ABP puncta in HEK293 cells. (B) Quantification of the number of cells containing HTT65Q-GFP puncta as in (B). (C) Immunoblot analysis of HTT65Q-GFP-LIR and HTT65Q-GFP-ABP in HEK293 cells. (D) Quantification of the protein levels of HTT65Q-GFP-LIR and HTT65Q-GFP-ABP aggregates as in (C). (E) Scheme of QBP-LIR and QBP-ABP constructs. (F) Immunoblot analysis of HTT65Q-GFP in HEK293 cells upon expression of QBP-LIR and QBP-ABP. HEK293 cells stably expressing HTT65Q-GFP were transiently transfected with plasmids encoding QBP-LIR and QBP-ABP for 48 h. The autophagy inhibition group was treated with 1 µM Baf A1 for 12 h. (G) Quantification of the protein levels of HTT65Q-GFP aggregates as in (F). (H) Immunoblot analysis of Triton X-100 soluble (left panel) and insoluble fractions (right panel) of different HTT65Q proteins. (I) Quantification of the protein levels of Triton X-100 insoluble HTT65Q-GFP aggregates as in right panel of (H). Data in (B), (D), (G) and (I) are presented as the mean ± SEM of three independent experiments. **p < 0.01, Student’s t test. Scale bar: 100 μm.
Figure 5.
Figure 5.
The chimeric peptide induces targeted degradation of HTT aggregates. (A) Scheme of the chimeric peptide for targeted degradation of HTT65Q aggregates. The chimeric peptide consists of CPP, QBP and LIR. (B) Representative images of HeLa cells treated with the FITC-linked chimeric peptide. Cells were treated with 5 µM the FITC-linked chimeric peptide for 6 h, followed by fluorescence analysis. (C) Immunoblot analysis of HTT65Q-GFP in HEK293 cells upon treatment with different concentrations of the chimeric peptide. HEK293 cells stably expressing HTT65Q-GFP were treated with different concentrations of the chimeric peptide (0, 1, 3 and 5 µM) for 12 h. The autophagy inhibition group was treated with 5 µM peptide accompanied by 1 µM Baf A1. (D) Quantification of the protein level of HTT65Q-GFP aggregates as in (C). (E) Immunoblot analysis of HTT65Q-GFP in HEK293 cells upon treatment with the chimeric peptide at different time points. HEK293 cells stably expressing HTT65Q-GFP were treated with the chimeric peptide (5 µM) at the indicated time points (0, 6 and 12 h). The autophagy inhibition group was treated with 5 µM peptide accompanied by 10 µM or 20 µM CQ for 12 h while the proteasome inhibition group was treated with 5 µM peptide accompanied by 10 µM MG132 for 12 h. (F) Quantification of the protein level of HTT65Q-GFP aggregates as in (E). Data in (D) and (F) are presented as the mean ± SEM of three independent experiments. *p < 0.05, **p < 0.01, ***p < 0.001, Student’s t test. Scale bar: 40 μm.
Figure 6.
Figure 6.
Tethering ATG16L1 or LC3 induces targeted degradation of mitochondria. (A) Representative images of MTS1-LIR-GFP and MTS1-ABP-GFP with mCherry-LC3 in HeLa cells. HeLa cells stably expressing mCherry-LC3 were transiently transfected with MTS1-GFP, MTS1-LIR-GFP or MTS1-ABP-GFP. The colocalization of mCherry-LC3 with MTS1-LIR-GFP or MTS1-ABP-GFP was determined by calculating fluorescence intensity of the areas marked with white lines. (B) Representative images of MTS1-LIR-GFP and MTS1-ABP-GFP with lysosomes in HeLa cells. MTS1-GFP, MTS1-LIR-GFP and MTS1-ABP-GFP were transiently transfected into HeLa cells, followed by lysosome staining with LysoTracker. (C) Immunoblot analysis of the mitochondrial proteins TIMM23 and TOMM20 upon the expression of MTS1-LIR and MTS1-ABP in HeLa cells in response to FCCP-induced mitochondrial dysfunction. MTS1-LIR and MTS1-ABP were transiently transfected into HeLa cells for 36 h, followed by treatment with 20 µM FCCP for 12 h. (D) Quantification of the levels of the mitochondrial proteins TIMM23 and TOMM20 as in (C). (E) Immunoblot analysis of the mitochondrial proteins TIMM23 and TOMM20 upon the expression of MTS1-LIR and MTS1-ABP in HeLa cells in response to starvation condition. (F) Quantification of the levels of the mitochondrial proteins TIMM23 and TOMM20 as in (E). (G) Scheme of mitophagy biosensor mCherry-GFP-MTS2. (H) Representative images of mCherry-GFP-MTS2 upon MTS1-LIR- and MTS1-ABP-induced mitophagy. Cells expressing mCherry-GFP-MTS2 were transiently transfected with MTS1-Flag, MTS1-LIR-Flag or MTS1-ABP-Flag for 24 h, followed by treatment with 20 µM FCCP for 6 h. The cyan arrows indicate cells that express MTS1, MTS1-LIR or MTS1-ABP, whereas the white arrows indicate cells that have no expression of these constructs. (I) Quantification of the relative fluorescence intensity as in (H) (n = 50). The fluorescence intensity of cells with the expression of MTS, MTS1-LIR or MTS1-ABP (indicated by the cyan arrows in (H)) was measured by ImageJ. Data in (d) and (F) are presented as the mean ± SEM of three independent experiments. *p < 0.05, **p < 0.01, Student’s t test. Scale bar: 10 μm.
Figure 7.
Figure 7.
Targeted degradation of mitochondria ameliorates mitochondria dysfunction in a Parkinson disease cell model. (A) Immunoblot analysis of PINK1 in HEK293 WT or PINK1-KO cells. (B) Immunoblot analysis of the mitochondrial proteins TIMM23 and TOMM20 upon the expression of MTS1-LIR and MTS1-ABP in PINK1-KO HEK293 cells. MTS1-LIR and MTS1-ABP were transiently transfected into PINK1-KO HEK293 cells for 36 h, followed by treatment with 20 µM FCCP for 12 h. (C) Quantification of the levels of the mitochondrial proteins TIMM23 and TOMM20 as in (B). (D) Immunoblot analysis of the mitochondrial proteins TIMM23 and TOMM20 upon the expression of MTS1-LIR and MTS1-ABP in HeLa cells in response to FCCP-induced mitochondrial dysfunction in the presence of E1 inhibitor TAK-243. The MTS1-LIR and MTS1-ABP were transiently transfected into HeLa cells for 36 h. Following by pre-treatment with 1 µM TAK-243 for 4 h, cells were treated with 20 µM FCCP for 12 h. (E) Quantification of the levels of the mitochondrial proteins TIMM23 and TOMM20 as in (D). (F) Representative images of aggregated mitochondria in PINK1-KO HEK293 cells. Mitochondria were stained with MitoTracker. The aggregated mitochondria in PINK1-KO HEK293 cells were indicated by white arrows. Scale bar: 25 μm. (G) Representative images of mitochondria upon expression of MTS1-LIR and MTS1-ABP in PINK1-KO HEK293 cells. PINK1-KO HEK293 cells were transiently transfected with MTS1-LIR and MTS1-ABP for 72 h, followed by staining of mitochondria with MitoTracker. The aggregated mitochondria in PINK1-KO HEK293 cells were indicated by white arrows. Scale bar: 10 μm. (H) Quantification of the numbers of cells containing aggregated mitochondria as in (G). Data in (C) and (E) are presented as the mean ± SEM of three independent experiments. “ns”, no significant difference, **p < 0.01, Student’s t test.
Figure 8.
Figure 8.
Targeted degradation of mitochondria protects cells from apoptosis. (A) Workflow for MTS1-LIR- and MTS1-ABP-mediated autophagic clearance of mitochondria in response to mitochondrial damage. (B) Immunoblot analysis of CASP3 upon FCCP treatment at different time points. (C) Immunoblot analysis of CASP3 upon the expression of MTS1-LIR and MTS1-ABP in response to FCCP-induced cell apoptosis. HeLa cells were transiently transfected with MTS1-LIR and MTS1-ABP for 36 h, followed by treatment with 40 µM FCCP for 12 h. After removal of FCCP compounds, cells were incubated in fresh medium for 4 h. (D) Quantification of the protein levels of activated CASP3 as in (C). (E) Scheme of targeted degradation of mitochondria induced by MTS1-LIR and MTS1-ABP.

References

    1. Wu T, Yoon H, Xiong Y, et al. Targeted protein degradation as a powerful research tool in basic biology and drug target discovery. Nat Struct Mol Biol. 2020. Jul;27(7):605–614. doi: 10.1038/s41594-020-0438-0 - DOI - PMC - PubMed
    1. Samarasinghe KTG, Crews CM.. Targeted protein degradation: a promise for undruggable proteins. Cell Chem Biol. 2021 Jul 15;28(7):934–951. doi: 10.1016/j.chembiol.2021.04.011 - DOI - PMC - PubMed
    1. Chamberlain PP, Hamann LG. Development of targeted protein degradation therapeutics. Nat Chem Biol. 2019. Oct;15(10):937–944. doi: 10.1038/s41589-019-0362-y - DOI - PubMed
    1. Ding Y, Fei Y, Lu B. Emerging new concepts of degrader technologies. Trends Pharmacol Sci. 2020. Jul;41(7):464–474. doi: 10.1016/j.tips.2020.04.005 - DOI - PMC - PubMed
    1. Alabi SB, Crews CM. Major advances in targeted protein degradation: PROTACs, LYTACs, and MADTACs. J Biol Chem. 2021. Jan-Jun;296:100647. doi: 10.1016/j.jbc.2021.100647 - DOI - PMC - PubMed

Publication types

MeSH terms