

The inhibitory receptor Siglec-G controls the severity of chronic lymphocytic leukemia
- PMID: 37424400
- PMCID: PMC10398647
- DOI: 10.15252/embr.202256420
The inhibitory receptor Siglec-G controls the severity of chronic lymphocytic leukemia
Abstract
Chronic Lymphocytic Leukemia (CLL) is the most common leukemia in adults in the Western world. B cell receptor (BCR) signaling is known to be crucial for the pathogenesis and maintenance of CLL cells which develop from mature CD5+ B cells. BCR signaling is regulated by the inhibitory co-receptor Siglec-G and Siglec-G-deficient mice have an enlarged CD5+ B1a cell population. Here, we determine how Siglec-G expression influences the severity of CLL. Our results show that Siglec-G deficiency leads to earlier onset and more severe course of the CLL-like disease in the murine Eμ-TCL1 model. In contrast, mice overexpressing Siglec-G on the B cell surface are almost completely protected from developing CLL-like disease. Furthermore, we observe a downmodulation of the human ortholog Siglec-10 from the surface of human CLL cells. These results demonstrate a critical role for Siglec-G in disease progression in mice, and suggest that a similar mechanism for Siglec-10 in human CLL may exist.
Keywords: BCR signaling; CLL; Siglec-10; Siglec-G overexpressing mice; Siglecs.
© 2023 The Authors. Published under the terms of the CC BY 4.0 license.
Conflict of interest statement
The authors declare that they have no conflict of interest.
Figures

Representative FACS plots show examples of stainings of B220low CD5+ B cells. (CLL‐like cells) and the selected gate for (B).
The diagram displays the percentage of CLL‐like cells in relation to all lymphocytes over a period of 60 weeks. Shown are mean values with ± SD. Significant differences between groups were determined by one‐way ANOVA with Kruskal–Wallis test (no normal distribution) and corrected for multiple comparison with Dunn's test, **P < 0.01, ***P < 0.001. Summarized data from more than 40 independent experiments for individual time points, comprising n = 4–75 animals per time point and genotype. X = no surviving TCL1 × Siglecg −/− animals at the age of 60 weeks. + indicates that in these groups only 4 animals were used for the analysis and therefore no calculation of significance was possible.

- A, B
Shown are percentages of B220low CD5+ cells in the blood of individual mice over time in (A) comparison of TCL1 and TCL1 × Siglecg−/− mice and in (B) TCL1 × Siglecg‐R26ki/ki and TCL1 × Siglecg‐R26ki/ki mb1cre control mice. To distinguish different mice different symbols were used to represent individual mice that are connected by lines. N = 15 TCL1; n = 15 TCL1 × Siglecg −/−; n = 22 TCL1 × Siglecg‐R26ki/ki; n = 17 TCL1 × Siglecg‐R26ki/ki mb1cre.

- A–D
For hematological analysis of blood cells (A) the leukocyte count (B) the lymphocyte count (C) the platelet count and (D) the red blood cell count were determined with an Advia 120 hematology analysis machine. The mean values are shown with SD. Significant differences between groups were determined by one‐way ANOVA with Kruskal–Wallis and corrected for multiple comparison with Dunn's test, *P < 0.05, **P < 0.01, ***P < 0.001. n = 5–16 animals per time point and genotype, summarized from at least five independent experiments.

Depicted are representative photographs of the spleen on graph paper of the different genotypes at 36 and 48 weeks of age. The spleen weight was determined and the mean values with ± SD are shown for every time point. Significant differences between groups were tested by one‐way ANOVA with Kruskal–Wallis test and corrected for multiple comparison with Dunn's test.
The absolute cell numbers of B220low CD5+ lymphocytes at different time points in the spleen are shown as mean values with ± SD. Significant differences between groups were tested by one‐way ANOVA with Kruskal–Wallis test and corrected for multiple comparison with Dunn's test. The different time points were tested separately. Alongside representative dot plots show selection and percentages of B220low CD5+ cells in the spleen pre‐gated on single cells, living cells and lymphocytes.
The percentage of B220low CD5+ leukocytes in the liver at different time points is illustrated. Besides representative dot plots show the selection of B220low CD5+ cells in the liver. Cells were pre‐gated on single cells, living cells and CD45+ leukocytes. Shown are mean values with ± SD. Significant differences between groups were tested by ordinary one‐way ANOVA with Šídák's post‐hoc test.
The survival of TCL1 × Siglecg −/− mice compared to TCL1 mice is illustrated with the Kaplan–Meier survival curve (n = 81 for TCL1, n = 101 for TCL1 × Siglecg −/−). The groups were compared for significant differences via log‐rank test.


Representative FACS plots show examples of stainings of B220low CD5+ B cells. (CLL‐like cells) and the selected gate for (B).
The diagram displays the percentage of B220low CD5+ cells in respect to lymphocytes over a time period of 48 weeks. Shown are mean values with ± SD. Significant differences between groups were determined by one‐way ANOVA with Kruskal–Wallis test (no normal distribution) and corrected for multiple comparison with Dunn's test. All time points were tested separately. *P < 0.05, **P < 0.01, ***P < 0.001. Summarized data from more than 20 independent experiments with n = 5–20 animals per time point and genotype are shown.

For the generation of Siglec‐G overexpressing mice the cDNA of Siglec‐G was cloned into the target vector, between the short (SA) and the long arm (LA) of the ROSA26 (R26) locus. Overexpression was facilitated by the CAG enhancer cassette, which contains the chicken ß‐actin promoter and the early enhancer element of cytomegalovirus. A transcriptional stop cassette flanked by two loxP sites ensured B cell‐specific expression by mating with the mb1cre mouse strain. The cre recombinase specifically removes the stop cassette so that the enhancer cassette is brought in front of the cDNA and transcription of the Siglec‐G cDNA occurs.
Siglecg‐R26ki/ki mb1cre mice showed a five to eightfold overexpression of Siglec‐G on the surface of mature B cells in the spleen and peritoneal cavity, respectively. The histograms represent the expression of Siglec‐G on conventional B2 cells of the spleen.
In the peritoneal cavity a reduction of B1a cells was observed in Siglecg‐R26ki/ki mb1cre mice in contrast to the enlargement of this population in Siglecg−/− mice. Shown are the mean values of the absolute cell counts. Cells were pre‐gated for single, living lymphocytes subsequently, B1a cells were identified as B220low and CD5+. Significant differences between groups were determined with Kruskal–Wallis and corrected for multiple comparison with Dunn's test, *P < 0.05. n = 6–14 animals per genotype; every dot represents a mouse. Data are summarized from 5 independent experiments.

- A–D
For hematological analysis of blood cells (A) the leukocyte count (B) the lymphocyte count (C) the platelet count and (D) the red blood cell count were determined with an Advia 120 hematology analysis machine. The mean values are shown with ± SD. Significant differences between groups were determined by one‐way ANOVA with Kruskal–Wallis and corrected for multiple comparison with Dunn's test, *P < 0.05, **P < 0.01. n = 5 animals per time point and genotype, summarized from at least 5 independent experiments.

Depicted are representative photographs of the spleen on graph paper of the different genotypes at 36 and 48 weeks of age.
The spleen weight in g was determined and the mean values with ± SD are shown for every time point. Significant differences between groups were tested by one‐way ANOVA with Kruskal–Wallis test and corrected for multiple comparison with Dunn's test. n = 8–15 animals per time point and genotype.
Absolute cell numbers of B220low CD5+ lymphocytes at 36 and 48 weeks of age in the spleen are shown as mean values with ± SD. Significant differences between groups were tested by one‐way ANOVA with Kruskal–Wallis test and corrected for multiple comparison with Dunn's test. The different time points were tested separately. n = 8–13 animals per time point and genotype.
Representative dot plots show selection and percentages of B220low CD5+ B cells in the spleen pre‐gated on single cells, living cells and lymphocytes.
The percentage of B220low CD5+ lymphocytes in the liver at 36 and 48 weeks of age is illustrated. Shown are mean values with ± SD. Significant differences between groups were tested by ordinary one‐way ANOVA with Šídák's post‐hoc test. n = 7–14 animals per time point and genotype.
Representative dot plots for the selection of B220low CD5+ cells in the liver. Cells were pre‐gated on single cells, living cells and CD45+ leukocytes.
The differences in survival are shown as Kaplan–Meier plots and log‐rank test n = 59 for TCL1 × Siglecg‐R26ki/ki, n = 57 for TCL1 × Siglecg‐R26ki/ki mb1cre.


Shown is a representative dot plot for the selection strategy for CLL‐like B cells from the spleen of TCL1 × Siglecg−/− mice. For the analysis of all B cells (B220+ and B220low cells), conventional B2 cells plus the B220low CD5+ population was used. Cells were pre‐gated for single cells and lymphocytes.
To measure calcium influx cells were loaded with Indo‐1. Shown is the mean calcium concentration as ratio of bound to unbound Indo‐1 versus time in s. First the basal level was monitored for 50 s in Krebs–Ringer solution. Subsequently, the BCR was stimulated with 13 μg/ml anti‐IgM F(ab)2 (shown by the black arrow). Shown is one representative result of four independent experiments. Mice were between 36 and 48 weeks of age. To measure intracellular signaling splenic cells were pre‐gated on single, living cells and lymphocytes, then B220+ cells, including B220low CD5+ lymphocytes were selected.
TCL1 and TCL1 × Siglecg −/− B cells were analyzed by intracellular staining with phopho‐specific antibodies (or total protein detecting antibody Bcl2).
TCL1 × Siglecg‐R26ki/ki or TCL1 × Siglecg‐R26ki/ki mb1‐cre B cells were analyzed by intracellular staining with phopho‐specific antibodies (or total protein detecting antibody Bcl2).

Peripheral blood B cells of CLL patients are pre‐gated on single, living B lymphocytes (CD19+). The mean fluorescence intensity (MFI) of surface Siglec‐10 is given from 35 IgV‐mutated (left) and 18 IgV‐unmutated CLL cases (right), always including tumor cells (CD20lowCD5high) and normal residual B cells (CD20highCD5−) as paired samples.
The transcript expression (normalized counts from bulk mRNA sequencing) of SIGLEC10 is given from five healthy donors, discriminating naïve CD5− (5 donors), mature CD5+ (86 donors), and CD27+ memory B‐cell (8 donors) subsets, from CLL tumor cells (n = 9) and from five paired normal residual B (NRB) cells (n = 5).
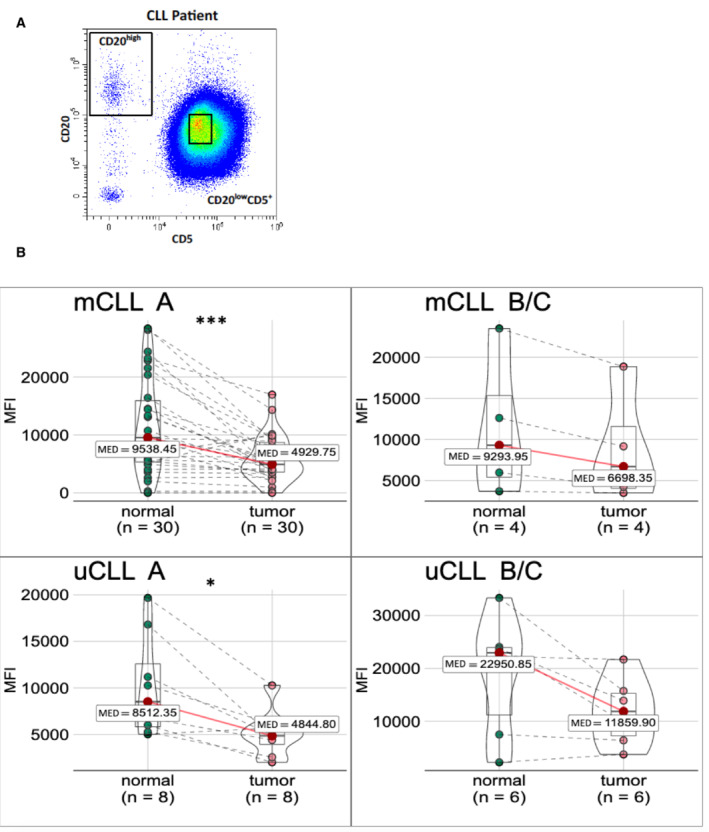
Peripheral blood B cells, pre‐gated on single, living B lymphocytes (CD19+). One representative plot for the gating of CLL cells (CD20lowCD5high) and normal residual (NRB) cells (CD20highCD5−) is given.
Data as in Fig 8A, separated by IgV‐mutation status (mCLL and uCLL, top and bottom row, respectively) and Binet A versus Binet B or C stage of the patient (left versus right column).
Similar articles
-
Accelerated progression of chronic lymphocytic leukemia in Eμ-TCL1 mice expressing catalytically inactive RAG1.Blood. 2013 May 9;121(19):3855-66, S1-16. doi: 10.1182/blood-2012-08-446732. Epub 2013 Mar 15. Blood. 2013. PMID: 23502221 Free PMC article.
-
The role of Siglec-G on B cells in autoimmune disease and leukemia.Semin Arthritis Rheum. 2024 Feb;64S:152328. doi: 10.1016/j.semarthrit.2023.152328. Epub 2023 Nov 22. Semin Arthritis Rheum. 2024. PMID: 38042621
-
Identification of Distinct Unmutated Chronic Lymphocytic Leukemia Subsets in Mice Based on Their T Cell Dependency.Front Immunol. 2018 Sep 13;9:1996. doi: 10.3389/fimmu.2018.01996. eCollection 2018. Front Immunol. 2018. PMID: 30271400 Free PMC article.
-
Lessons learned from the Eµ-TCL1 mouse model of CLL.Semin Hematol. 2024 Jun;61(3):194-200. doi: 10.1053/j.seminhematol.2024.05.002. Epub 2024 May 10. Semin Hematol. 2024. PMID: 38839457 Review.
-
B Cell Siglecs-News on Signaling and Its Interplay With Ligand Binding.Front Immunol. 2018 Dec 3;9:2820. doi: 10.3389/fimmu.2018.02820. eCollection 2018. Front Immunol. 2018. PMID: 30559744 Free PMC article. Review.
Cited by
-
Phosphatidylcholine-specific B cells are enriched among atypical CD11chigh and CD21low memory B cells in antiphospholipid syndrome.Front Immunol. 2025 Jun 3;16:1585953. doi: 10.3389/fimmu.2025.1585953. eCollection 2025. Front Immunol. 2025. PMID: 40529352 Free PMC article.
References
-
- Baumgarth N (2011) The double life of a B‐1 cell: self‐reactivity selects for protective effector functions. Nat Rev Immunol 11: 34–46 - PubMed
-
- Bökers S, Urbat A, Daniel C, Amann K, Smith KG, Espeli M, Nitschke L (2014) Siglec‐G deficiency leads to more severe collagen‐induced arthritis and earlier onset of lupus‐like symptoms in MRL/lpr mice. J Immunol 192: 2994–3002 - PubMed
-
- Bosch F, Dalla‐Favera R (2019) Chronic lymphocytic leukaemia: from genetics to treatment. Nat Rev Clin Oncol 16: 684–701 - PubMed
-
- Budeus B, Kibler A, Brauser M, Homp E, Bronischewski K, Ross JA, Gorgens A, Weniger MA, Dunst J, Kreslavsky T et al (2021) Human cord blood B cells differ from the adult counterpart by conserved Ig repertoires and accelerated response dynamics. J Immunol 206: 2839–2851 - PubMed
Publication types
MeSH terms
Substances
Associated data
- Actions
LinkOut - more resources
Full Text Sources
Molecular Biology Databases
