

Glucose Alterations, Insulin Resistance, Arterial Hypertension, and Renin are Strictly Associated in Pediatric Obesity
- PMID: 37424701
- PMCID: PMC10326241
- DOI: 10.1210/jendso/bvad088
Glucose Alterations, Insulin Resistance, Arterial Hypertension, and Renin are Strictly Associated in Pediatric Obesity
Abstract
Context: Insulin resistance, glucose alterations, arterial hypertension (HTN), and the renin-angiotensin-aldosterone system (RAAS) are related in adult obesity. This crosstalk is still unexplored in childhood.
Objective: Characterize the relationships of fasting and postload glucose and insulin levels with new American Academy of Pediatrics classification of HTN and RAAS in pediatric obesity.
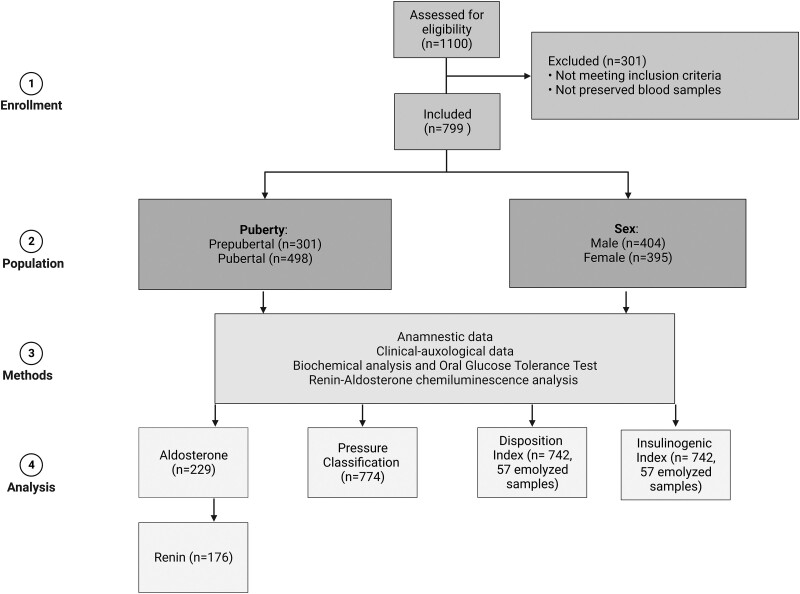
Methods: This was a retrospective observational study; 799 pediatric outpatients (11.4 ± 3.1 years) at a tertiary center who were overweight or obese and not yet on diet were included. The main outcome measures were mean and correlations among parameters of a complete clinical and metabolic screening (body mass index, blood pressure, and glucose and insulin levels during an oral glucose tolerance test, and renin and aldosterone levels and their ratio).
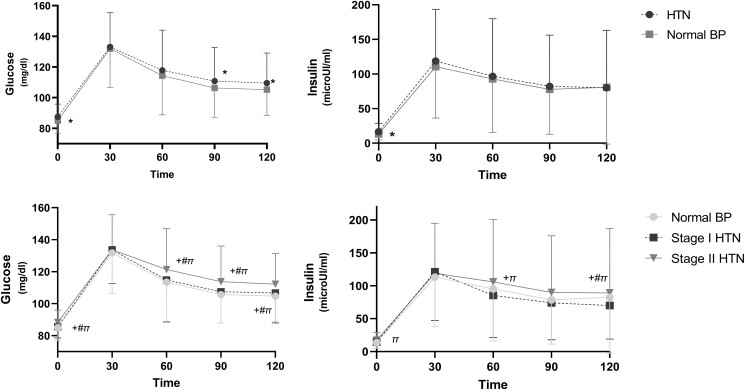
Results: 774 subjects had all the parameters, of whom 87.6% had HTN (5% elevated blood pressure, 29.2% stage I HTN, and 53.4% stage II HTN). Eighty subjects had 1 or more glucose alterations, and more frequently presented HTN. Blood pressure levels were higher in subjects with glucose alterations than in those with normal glucose levels. Fasting and stimulated glucose and insulin levels were directly related to the HTN stages, and insulin sensitivity was lower in HTN than in normal blood pressure. Aldosterone, renin, and aldosterone-renin ratio (ARR) were similar in sexes, whereas aldosterone was higher in prepubertal individuals. Subjects with impaired glucose tolerance (IGT) had higher renin and lower ARR. Renin was positively correlated with postload glucose, and ARR was negatively correlated with the Homeostatic Model Assessment for Insulin Resistance index.
Conclusion: A close relationship exists among insulin resistance, glucose alterations, HTN, and renin in childhood obesity. Specific categories of risk could provide indicators for strict clinical surveillance.
Keywords: aldosterone; glucose tolerance; hypertension; insulin resistance; obesity; renin.
© The Author(s) 2023. Published by Oxford University Press on behalf of the Endocrine Society.
Figures
References
-
- Abarca-Gómez L, Abdeen ZA, Hamid ZA, et al. Worldwide trends in body-mass index, underweight, overweight, and obesity from 1975 to 2016: a pooled analysis of 2416 population-based measurement studies in 128·9 million children, adolescents, and adults. Lancet. 2017;390(10113):2627‐2642. - PMC - PubMed
-
- Dhull RS, Baracco R, Jain A, Mattoo TK. Pharmacologic treatment of pediatric hypertension. Curr Hypertens Rep. 2016;18(4):32. - PubMed
-
- Stępniewska A, Wójcik M, Starzyk JB. Arterial hypertension is associated with an increased risk of metabolic complications in pediatric patient with obesity. J Pediat Endocrinol Metabol. 2022;35(8):1028‐1032. - PubMed
-
- Karaca Ü, Schram MT, Houben AJHM, Muris DMJ, Stehouwer CDA. Microvascular dysfunction as a link between obesity, insulin resistance and hypertension. Diabetes Res Clin Pract. 2014;103(3):382‐387. - PubMed
LinkOut - more resources
Full Text Sources