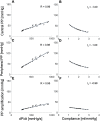
Cardiac contractility is a key factor in determining pulse pressure and its peripheral amplification
- PMID: 37424904
- PMCID: PMC10326904
- DOI: 10.3389/fcvm.2023.1197842
Cardiac contractility is a key factor in determining pulse pressure and its peripheral amplification
Abstract
Background: Arterial stiffening and peripheral wave reflections have been considered the major determinants of raised pulse pressure (PP) and isolated systolic hypertension, but the importance of cardiac contractility and ventricular ejection dynamics is also recognised.
Methods: We examined the contributions of arterial compliance and ventricular contractility to variations in aortic flow and increased central (cPP) and peripheral (pPP) pulse pressure, and PP amplification (PPa) in normotensive subjects during pharmacological modulation of physiology, in hypertensive subjects, and in silico using a cardiovascular model accounting for ventricular-aortic coupling. Reflections at the aortic root and from downstream vessels were quantified using emission and reflection coefficients, respectively.
Results: cPP was strongly associated with contractility and compliance, whereas pPP and PPa were strongly associated with contractility. Increased contractility by inotropic stimulation increased peak aortic flow (323.9 ± 52.8 vs. 389.1 ± 65.1 ml/s), and the rate of increase (3193.6 ± 793.0 vs. 4848.3 ± 450.4 ml/s2) in aortic flow, leading to larger cPP (36.1 ± 8.8 vs. 59.0 ± 10.8 mmHg), pPP (56.9 ± 13.1 vs. 93.0 ± 17.0 mmHg) and PPa (20.8 ± 4.8 vs. 34.0 ± 7.3 mmHg). Increased compliance by vasodilation decreased cPP (62.2 ± 20.2 vs. 45.2 ± 17.8 mmHg) without altering , pPP or PPa. The emission coefficient changed with increasing cPP, but the reflection coefficient did not. These results agreed with in silico data obtained by independently changing contractility/compliance over the range observed in vivo.
Conclusions: Ventricular contractility plays a key role in raising and amplifying PP, by altering aortic flow wave morphology.
Keywords: aortic flow; arterial compliance; cardiac contractility; hypertension; pulse pressure.
© 2023 Piccioli, Li, Valiani, Caleffi, Chowienczyk and Alastruey.
Conflict of interest statement
The authors declare that the research was conducted in the absence of any commercial or financial relationships that could be construed as a potential conflict of interest.
Figures


Similar articles
-
Novel Pressure Wave Separation Analysis for Cardiovascular Function Assessment Highlights Major Role of Aortic Root.IEEE Trans Biomed Eng. 2022 May;69(5):1707-1716. doi: 10.1109/TBME.2021.3127799. Epub 2022 Apr 21. IEEE Trans Biomed Eng. 2022. PMID: 34767501 Free PMC article.
-
Estimating Central Pulse Pressure From Blood Flow by Identifying the Main Physical Determinants of Pulse Pressure Amplification.Front Physiol. 2021 Feb 23;12:608098. doi: 10.3389/fphys.2021.608098. eCollection 2021. Front Physiol. 2021. PMID: 33708133 Free PMC article.
-
Systolic hypertension mechanisms: effect of global and local proximal aorta stiffening on pulse pressure.Ann Biomed Eng. 2012 Mar;40(3):742-9. doi: 10.1007/s10439-011-0443-x. Epub 2011 Oct 21. Ann Biomed Eng. 2012. PMID: 22016326
-
Haemodynamic basis for the development of left ventricular failure in systolic hypertension and for its logical therapy.J Hypertens. 1995 Sep;13(9):943-52. doi: 10.1097/00004872-199509000-00002. J Hypertens. 1995. PMID: 8586828 Review.
-
Angiotensin II, mechanotransduction, and pulsatile arterial hemodynamics in hypertension.Am J Physiol Heart Circ Physiol. 2009 Nov;297(5):H1567-75. doi: 10.1152/ajpheart.00622.2009. Epub 2009 Sep 4. Am J Physiol Heart Circ Physiol. 2009. PMID: 19734358 Review.
Cited by
-
Effect of Acute Resistance Exercise and Resistance Exercise Training on Central Pulsatile Hemodynamics and Large Artery Stiffness: Part I.Pulse (Basel). 2025 Feb 7;13(1):31-44. doi: 10.1159/000543313. eCollection 2025 Jan-Dec. Pulse (Basel). 2025. PMID: 39991443
-
Editorial: Advanced invasive hemodynamics: pressure-volume maneuvers to obtain load-independent indices.Front Cardiovasc Med. 2024 Aug 12;11:1468811. doi: 10.3389/fcvm.2024.1468811. eCollection 2024. Front Cardiovasc Med. 2024. PMID: 39188321 Free PMC article. No abstract available.
References
-
- Lim SS, Vos T, Flaxman AD, Danaei G, Shibuya K, Adair-Rohani H, et al. A comparative risk assessment of burden of disease and injury attributable to 67 risk factors and risk factor clusters in 21 regions, 1990–2010: a systematic analysis for the global burden of disease study 2010. Lancet. (2012) 380(9859):2224–60. 10.1016/S0140-6736(12)61766-8 - DOI - PMC - PubMed
Grants and funding
LinkOut - more resources
Full Text Sources
Miscellaneous

