. 2023 Jun;13(6):2645-2662.
doi: 10.1016/j.apsb.2023.03.025. Epub 2023 Mar 31.

The suppression of cervical cancer ferroptosis by macrophages: The attenuation of ALOX15 in cancer cells by macrophages-derived exosomes

Affiliations

The suppression of cervical cancer ferroptosis by macrophages: The attenuation of ALOX15 in cancer cells by macrophages-derived exosomes

Yanlin Luo et al. Acta Pharm Sin B. 2023 Jun.

Abstract

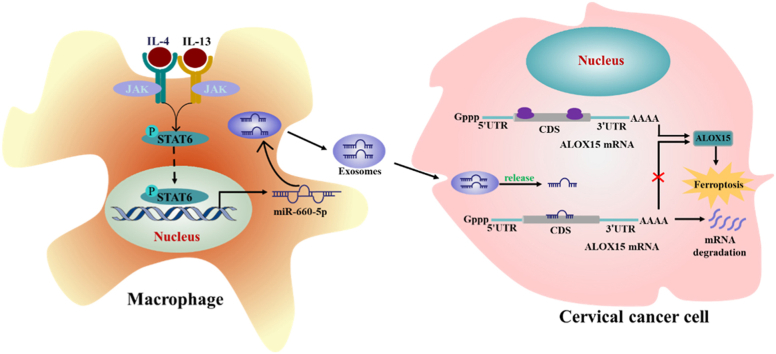
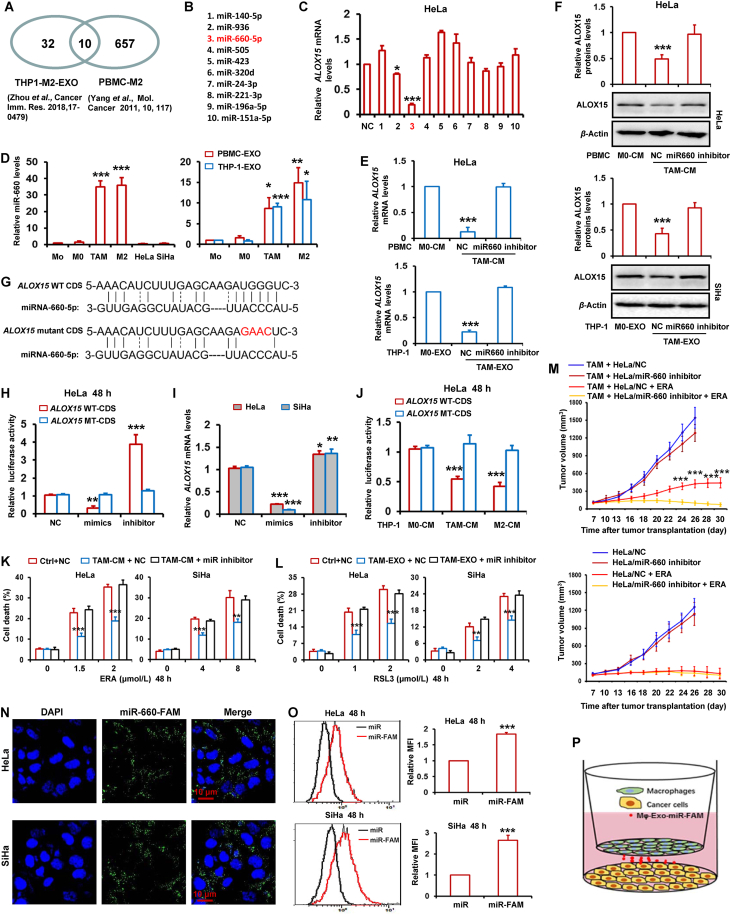
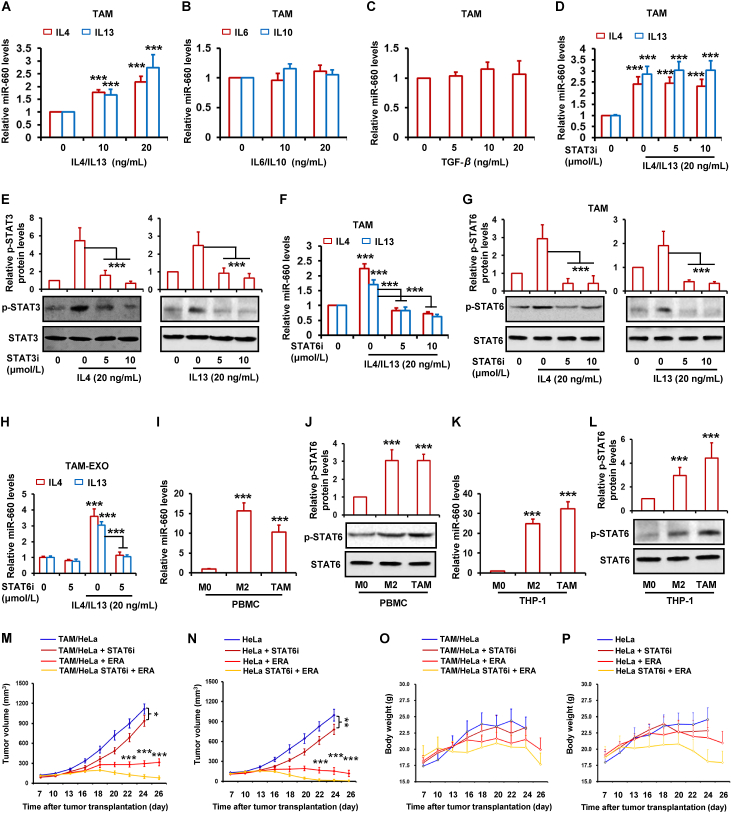
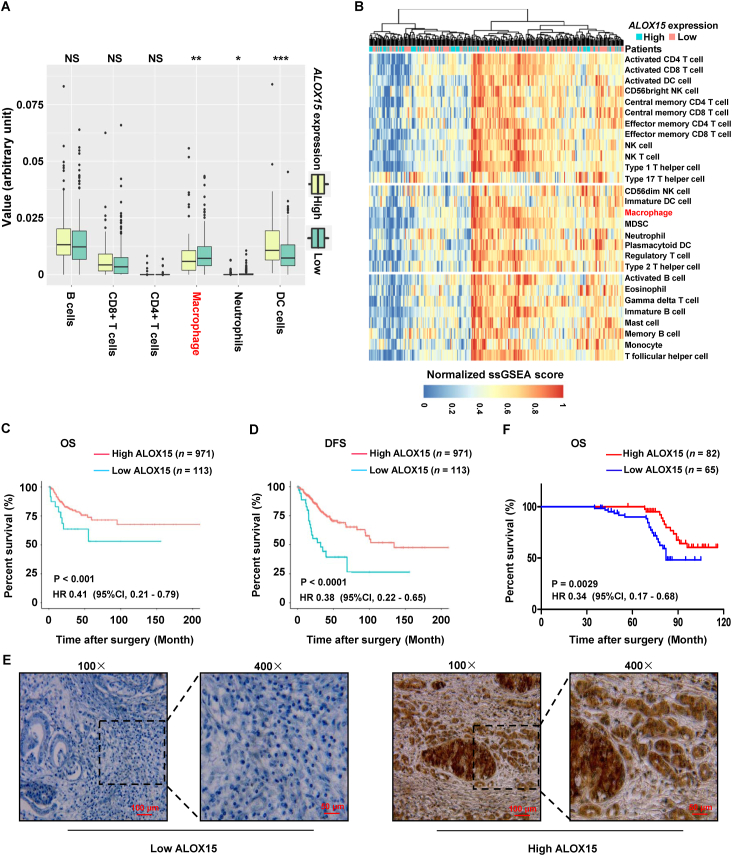
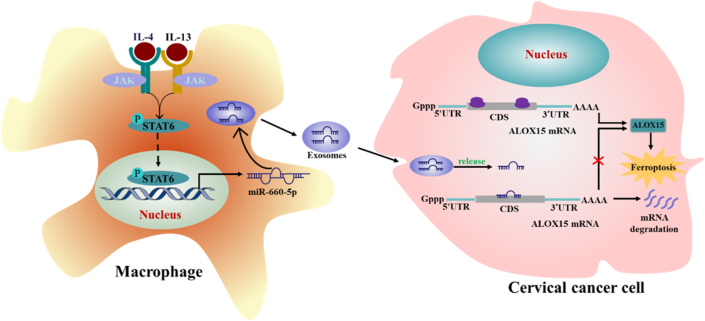
Induction of cancer cell ferroptosis has been proposed as a potential treatment in several cancer types. Tumor-associated macrophages (TAMs) play a key role in promoting tumor malignant progression and therapy resistance. However, the roles and mechanisms of TAMs in regulating tumor ferroptosis is still unexplored and remains enigmatic. This study shows ferroptosis inducers has shown therapeutic outcomes in cervical cancer in vitro and in vivo. TAMs have been found to suppress cervical cancer cells ferroptosis. Mechanistically, macrophage-derived miRNA-660-5p packaged into exosomes are transported into cancer cells. In cancer cells, miRNA-660-5p attenuates ALOX15 expression to inhibit ferroptosis. Moreover, the upregulation of miRNA-660-5p in macrophages depends on autocrine IL4/IL13-activated STAT6 pathway. Importantly, in clinical cervical cancer cases, ALOX15 is negatively associated with macrophages infiltration, which also raises the possibility that macrophages reduce ALOX15 levels in cervical cancer. Moreover, both univariate and multivariate Cox analyses show ALOX15 expression is independent prognostic factor and positively associated with good prognosis in cervical cancer. Altogether, this study reveals the potential utility of targeting TAMs in ferroptosis-based treatment and ALOX15 as prognosis indicators for cervical cancer.

Keywords: ALOX15; Cervical cancer; Exosome; Ferroptosis; Macrophages infiltration; STAT6; Tumor-associated macrophage; miRNA-660-5p.


Conflict of interest statement

The authors declare no conflicts of interests.

Figures

Image 1
Graphical abstract
Figure 1
Figure 1
Tumor-associated macrophages suppress ferroptosis in cervical cancer. (A) HeLa cells were treated with condition medium (CM) from human monocytes (Mo), PBMC-derived M0 macrophages, tumor-associated macrophage (TAM) and growth media (Control, Ctrl). And then cells were treated with indicated dose of erastin (ERA) for 48 h, and cell death was detected by PI staining using flow cytometer. (B, C) HeLa and/or SiHa cells were treated with CM from PBMC-derived M0 macrophages (Control) and TAM. And then cells were treated with indicated dose of ERA and/or RSL3 for 48 h. Inhibition ratio of cell viability was detected by CCK-8 assay (B). Cell staining PI was observed by confocal microscope (C). (D–F) HeLa cells were treated with TAM-CM. And then cells were treated with indicated dose of ERA and RSL3 for 48 h, lipid ROS was detected by staining C11-BODIPY 581/591 using flow cytometer (D, E), GSSG levels were detected by using a GSH/GSSG Ratio Detection Assay Kit (F). (G) The relative mRNA levels of CD206, CD163 and IL10 were detected in human PBMC-derived M0 macrophage, IL4-induced M2 and TAM. (H) HeLa cells were treated with CM from human monocyte, PBMC-derived IL4-induced M2 macrophages. And then cells were treated with indicated dose of ERA for 48 h, and cell death were detected. (I) HeLa and SiHa cells were treated with CM from human PBMC-derived M0 and M2 macrophages. And then inhibition ratio of cell viability was detected. (J, K) HeLa and SiHa cells were treated with M2-CM. And then cells were treated with ERA or RSL3 for 48 h, lipid ROS was detected by staining C11-BODIPY 581/591 using confocal microscope (J), GSSG levels were detected (K). (L–N) TAM decreased anti-tumor effects of ERA in mouse xenograft cervical cancer model. Representative images of xenograft tumors and tumor growth curve from different groups (L, M). Change in mice body weight was displayed (N). Data represented the mean ± SEM of at least three times biological replicates. ∗P < 0.05, ∗∗P < 0.01, ∗∗∗P < 0.001 compared to control.
Figure 2
Figure 2
TAMs suppress cervical cancer ferroptosis by exosomes. (A) Exosomes (EXO) secreted from TAM and M0 macrophages were collected and observed with an electron microscope. Scale bars are as indicated. (B) The intensity of exosomes of different sizes were quantified. (C) The diameter of exosomes derived from TAMs were quantified. Data are averages of exosomes from each group. (D) Exosomal markers were detected in the exosomes isolated from PBMC-derived M0, M2 macrophage and TAM by Western blot. (E) HeLa cells were treated with exosomes derived from human monocytes (Mo), PBMC-derived M0, M2 macrophages and TAM. And then cells were treated with ERA for 48 h, cell death were detected. (F, G) HeLa and SiHa cells were treated with exosomes from PBMC-derived M0, M2 macrophages and TAM. And then cells were treated with ERA and RSL3 for 48 h, the inhibition ratio of cell viability were detected. (H, I) SiHa cells were treated with exosomes from PBMC-derived M0 macrophages and TAM. And then cells were treated with ERA and RSL3 for 48 h, and then lipid ROS was detected. (J–M) HeLa and SiHa cells were treated with CM-Dil-labeled exosomes from PBMC-derived TAM and M2 macrophages for the indicated times. The internalization of fluorescently labeled exosomes in the two cells was detected by flow cytometer (J, K) and confocal microscopy (L, M). Scale bars are as indicated. Data represented the mean ± SEM of at least three times biological replicates. ∗∗∗P < 0.001, compared to control.
Figure 3
Figure 3
Attenuation of cervical cancer ferroptosis by TAM is involved in downregulation of ALOX15. (A–C) HeLa and SiHa cells were treated with CM from M0 macrophage and TAM for 48 h. Ferroptosis-associated gene was detected by RT-PCR. The ratio of genes expressions in cells treated with TAMs-CM relative to M0-CM were shown in the heatmap (A). Volcano map indicated the relationship between the observed fold change in gene expression and the P value significance of such changes in cells treated with CM. The horizontal dotted lines represented the P = 0.05, and vertical dotted line represented the 2-fold change cut-offs, the red dots represented the selected ALOX15 gene (B, C). (D, E) HeLa cells were treated with CM or exosome (EXO) from PBMC or THP-1-derived M0, M2 macrophage and TAM for 48 h. ALOX15 mRNA levels was detected by RT-PCR. (F) HeLa cells were treated with CM or EXO from PBMC or THP-1-derived M0, M2 macrophage and TAM for 48 h. ALOX15 protein levels was detected by Western blot. The relative quantification of protein was analyzed by scanning densitometry using Image J software and β-actin was used as the loading control. (G) TAM (THP-1) and HeLa in combination or HeLa alone were inoculated subcutaneously in nude mice. And then, the ALOX15 and macrophage marker CD68 expression was detected by immunofluorescence. (H, I) HeLa and SiHa cells were transfected with ALOX15 siRNAs for 48 h. Cell death induced by ERA was detected (H). ALOX15 protein levels were detected by Western blot. The relative quantification of protein was analyzed by scanning densitometry using Image J software and β-actin was used as the loading control (I). (J, K) HeLa and SiHa cells were transfected with ALOX15 siRNAs and treated by TAM-CM for 48 h. Cell death induced by ERA was detected. Data represented the mean ± SEM of at least three times biological replicates. NS, not significant; ∗∗∗P < 0.001, compared to control.
Figure 4
Figure 4
TAMs-derived exosomal miR-660-5p attenuates ALOX15 expression to inhibit ferroptosis in cervical cancer cells. (A, B) Flowchart for the selection of ten miRNAs. (C) HeLa cells were transfected with the ten miRNAs mimics, and then ALOX15 mRNA levels were detected by RT-PCR. (D) The miR-660-5p levels were detected by RT-PCR in PBMC-derived monocytes (Mo), M0, TAM, M2, HeLa, SiHa cells and exosomes (EXO) from PBMC and THP-1-derived Mo, M0, TAM, M2. (E, F) HeLa cells were transfected with miR-660-5p inhibitor, and then treated with CM and EXO from M0 and TAM. ALOX15 mRNA levels were detected by RT-PCR (E). ALOX15 protein levels were detected by Western blot. The relative quantification of protein was analyzed by scanning densitometry using Image J software and β-actin was used as the loading control (F). (G) The predicted miR-660-5p target sites in the coding sequence (CDS) of ALOX15 mRNA and the mutated version. (H) HeLa cells were co-transfected with pGL3 vector containing the wild type (WT) or mutated (MT) CDS of ALOX15, or pGL3-control vector, along with miR-660-5p mimics and inhibitor. After 48 h, luciferase activity was detected. Data were normalized to luciferase activity in the corresponding cells transfected with NC. (I) HeLa and SiHa cells were transfected with miR-660-5p mimics and inhibitor. ALOX15 mRNA levels were detected by RT-PCR. (J) HeLa cells were co-transfected with pGL3 vector containing the WT or MT CDS of ALOX15, and then cells were treated with CM from THP-1 derived M0, M2 macrophages and TAM. After 48 h, luciferase activity was detected. (K, L) HeLa and SiHa cells were transfected with miR-660-5p inhibitor, and then treated with TAM-CM or TAM-EXO and indicated dose of ERA or RSL3 for 48 h. Cell death was detected. (M) HeLa cells stably expressing miR-660-5p inhibitor alone or mixed with TAM were injected into nude mice. Nude mice were administered with ERA as indicated at each time point. Tumor volume was measured once per 2–3 days by using calipers for 30 days. (N–P) HeLa and SiHa cells were co-cultured with TAM transfected with miR-660-5p-FAM for 48 h. And then the capture of TAM-exosome delivered miR-660-5p-FAM by HeLa or SiHa cells were observed by confocal microscope (N), and quantitatively analyzed by flow cytometry (O). Schematic diagram for the cell co-culture model of TAM and HeLa or SiHa cells (P). Data are represented as the mean ± SEM of three replicates. For mice model studying, data are represented as the mean ± SEM of 5 mice. ∗P < 0.05, ∗∗P < 0.01, ∗∗∗P < 0.001 compared to control.
Figure 5
Figure 5
IL4/IL13 induces miR-660-5p expression by activating STAT6 pathway. (A–C) THP-1-derived TAM was treated with indicated dose of IL4, IL13, IL6, IL10 and TGF-β for 48 h. RT-PCR was performed to detect the expression of miR-660-5p. (D–H) THP-1-derived TAM was treated with indicated dose of STAT3 inhibitor (STAT3i) or STAT6 inhibitor (STAT6i) for 2 h, and then treated with 20 ng/mL of IL4 or IL13 for 48 h. RT-PCR was performed to detect the expression of miR-660-5p in TAM (D, F) and TAM-exosome (H). STAT3, p-STAT3, STAT6 and p-STAT6 protein levels were detected by Western blot (E, G). (I–L) miR-660-5p levels were detected in PBMC or THP-1-derived M0, M2 and TAM by RT-PCR (I, K). STAT6 and p-STAT6 protein levels were detected by Western blot (J, L). (M–P) HeLa alone or mixed with TAM cells were injected into nude mice (n = 5). Nude mice were administered with ERA and STAT6i as indicated at each time point. Tumor volume was measured once per 2–3 days by using calipers for 30 days (M, N). Change in mice body weight was displayed (O, P). The relative quantification of protein was analyzed by scanning densitometry using Image J software and β-actin was used as the loading control. Data are represented as the mean ± SEM of three replicates. For mice model studying, data are represented as the mean ± SEM of 5 mice. ∗P < 0.05, ∗∗P < 0.01, ∗∗∗P < 0.001 compared to control.
Figure 6
Figure 6
ALOX15 is associated with macrophages infiltration and good prognosis. (A) Infiltration of immune cells including TAMs in cervical cancer tissues with high or low expression of ALOX15 by using ssGSEA and CIBERSORT. The relative numerical values corresponding to the height of the histogram indicated the different levels of abundance and the proportions. NS, not significant; ∗P < 0.05; ∗∗P < 0.01; ∗∗∗P < 0.001, high expression of ALOX15 compared to low expression. (B) Single-sample GSEA analysis identifying the relative infiltration of immune cell populations for 311 cervical cancer samples with available RNA-sequencing data in TCGA. The relative infiltration of each cell type is normalized into a z-score. (C, D) Association of ALOX15 mRNA expression with the disease-free survival (DFS) and overall survival (OS) in cervical cancer patients, respectively. These data of cervical cancer samples were acquired from TCGA. (E) Representative immunohistochemical staining for high and low expression of ALOX15 in human cervical cancer sample. (F) Association of ALOX15 protein expression with the OS in 147 cervical cancer patients.
Figure 7
Figure 7
Schematic diagram that TAM enhanced cervical cancer resistance to ferroptosis. A proposed model illustrating the role of TAM-derived exosomal miR-660-5p in regulating ALOX15-induced ferroptosis in cervical cancer cells.

References

    1. Cohen P.A., Jhingran A., Oaknin A., Denny L. Cervical cancer. Lancet. 2019;393:169–182. - PubMed
    1. Rose P.G., Bundy B.N., Watkins E.B., Thigpen J.T., Deppe G., Maiman M.A., et al. Concurrent cisplatin-based radiotherapy and chemotherapy for locally advanced cervical cancer. N Engl J Med. 1999;340:1144–1153. - PubMed
    1. Ferrandina G., Lauriola L., Distefano M.G., Zannoni G.F., Gessi M., Legge F., et al. Increased cyclooxygenase-2 expression is associated with chemotherapy resistance and poor survival in cervical cancer patients. J Clin Oncol. 2002;20:973–981. - PubMed
    1. Leisching G., Loos B., Botha M., Engelbrecht A.M. Bcl-2 confers survival in cisplatin treated cervical cancer cells: circumventing cisplatin dose-dependent toxicity and resistance. J Transl Med. 2015;13:328. - PMC - PubMed
    1. Jiang X., Stockwell B.R., Conrad M. Ferroptosis: mechanisms, biology and role in disease. Nat Rev Mol Cell Biol. 2021;22:266–282. - PMC - PubMed