. 2023 Jun 23:10:1146291.
doi: 10.3389/fmed.2023.1146291. eCollection 2023.

Influencing factors associated with high myopia in Chinese college students

Affiliations

Influencing factors associated with high myopia in Chinese college students

Weiran Zhang et al. Front Med (Lausanne). .

Abstract

Background: High myopia (HM) may elicit irreversible pathological changes in the fundus and severely impair visual quality, thereby becoming a major public health issue in China. However, the influencing factors associated with HM remain unknown in Chinese college students, whose visual quality is crucial to country development.

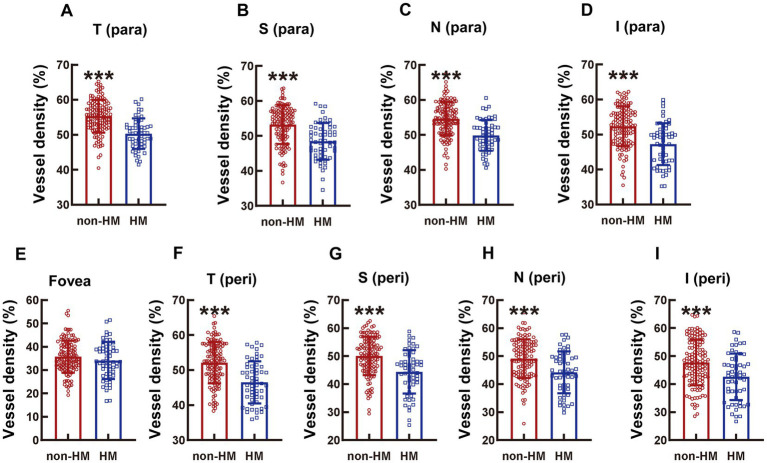
Methods: This is a cross-sectional observational study. Two thousand three hundred and fifteen undergraduate and graduate students were initially recruited from various majors in 3 universities in Tianjin, China. Under the principle of voluntary participation and informed consent, simple random sampling was conducted in the recruited subjects while maintaining balanced number of subjects from each major. After screening with inclusion and exclusion criteria, 96 undergraduate and graduate students (186 eyes) were finally included and divided into non-HM and HM groups. The eyes of subjects were examined by optical coherence tomography angiography (OCTA) for vessel density and structure thickness at the macula and optic disc, and the subjects were surveyed by an itemized questionnaire on lifestyles and study habits.

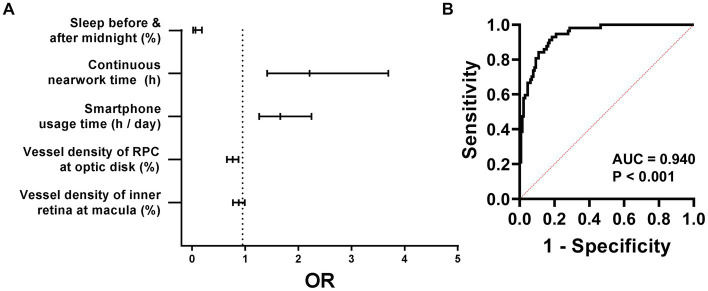
Results: The OCTA and questionnaire results revealed 10 factors, including hemodynamic and anatomic parameters and lifestyle metrics, with statistical significance between the non-HM and HM groups. Receiver operating characteristic curve analysis showed that vessel density of the inner retina at the macula, vessel density of the radial peripapillary capillary at the optic disc, smartphone usage time, continuous near work time, and sleeping after midnight had superior values of area under the curve (AUC > 0.700). Therefore, these 5 factors were selected for univariant and multivariant logistic regression analyses. A prediction model comprising the 5 influencing factors had an AUC of 0.940 and 95% CI of 0.908-0.972.

Conclusion: This study for the first time identified the vessel density of the inner retina at the macula, the vessel density of the radial peripapillary capillary at the optic disc, smartphone usage time, continuous near work time, and sleeping after midnight as influencing factors associated with HM in Chinese college students. A prediction model comprising the 5 influencing factors was proposed for calculating likelihood of a Chinese college student developing HM, based on which lifestyle improvement and medical intervention might be recommended.

Keywords: habits; influencing factor; lifestyles; myopia; retinal thickness; vessel density.


Conflict of interest statement

The authors declare that the research was conducted in the absence of any commercial or financial relationships that could be construed as a potential conflict of interest.

Figures

Figure 1
Figure 1
Comparison of the vessel densities of different parts of the macula at the SCP level between the non-HM and HM groups. The compartmentalization of the macula is shown at an enface image of the OCTA (A). The macular compartments, the SCP and DCP levels were illustrated in a cross-sectional image automatically acquired by the built-in software (B). The green and red lines indicate the upper (ILM) and lower (IPL) boundaries of the SCP, respectively; The red and yellow lines indicate the upper (IPL) and lower (OPL) boundaries of the DCP, respectively. The green arrow indicates the direction from the temporal to the nasal. The blue arrow indicates the direction from the superior to the inferior. The vessel densities at the T para (C), S para (D), N para (E), I para (F), fovea (G), T peri (H), S peri (I), N peri (J), and I peri (K) parts at the SCP level were compared between the non-HM and HM groups. ***p < 0.001. SCP, superficial capillary plexus; DCP, deep capillary plexus; T para, temporal parafovea; S para, superior parafovea; N para, nasal parafovea; I para, inferior parafovea; T peri, temporal perifovea; S peri, superior perifovea; N peri, nasal perifovea; and I peri, inferior perifovea; ILM, internal limiting membrane; IPL, inner plexiform layer; RPE, retinal pigmented epithelium; non-HM, nonhigh myopia; HM, high myopia.
Figure 2
Figure 2
Comparison of the RPC vessel densities of different parts of the optic disc between the non-HM and HM groups. The compartmentalization of the optic disc is illustrated in an en face image of OCTA (A). A cross-sectional image was automatically obtained by the built-in software (B). The red and blue lines indicate the upper (ILM) and lower (NFL) boundaries of the RPC. The green arrow represents the direction from the temporal to the nasal. The RPC vessel densities at the TS (C), ST (D), SN (E), NS (F), NI (G), IN (H), IT (I), and TI (J) parts of the optic disc were compared between the non-HM and HM groups. ***p < 0.001. NS, nasal superior; NI, nasal inferior; IN, inferior nasal; IT, inferior temporal; TI, temporal inferior; TS, temporal superior; ST, superior temporal; SN, superior nasal; ILM, internal limiting membrane; NFL, nerve fiber layer; non-HM, nonhigh myopia; HM, high myopia.
Figure 3
Figure 3
Flowchart for the current study. AL, axis length; SER, spherical equivalent refraction; BCVA, best-corrected visual acuity; OCTA, optical coherence tomography angiography.
Figure 4
Figure 4
Comparison of the vessel densities of different parts of the macula at the DCP level between the non-HM and HM groups. The vessel densities at the T para (A), S para (B), N para (C), I para (D), fovea (E), T peri (F), S peri (G), N peri (H), and I peri (I) parts at the DCP level were compared between the non-HM and HM groups. ***p < 0.001. T para, temporal parafovea; S para, superior parafovea; N para, nasal parafovea; I para, inferior parafovea; T peri, temporal perifovea; S peri, superior perifovea; N peri, nasal perifovea; and I peri, inferior perifovea; non-HM, nonhigh myopia; HM, high myopia.
Figure 5
Figure 5
Comparison of the retinal thickness at the macula between the non-HM and HM groups. The retina thicknesses at the T para (A), S para (B), N para (C), I para (D), fovea (E), T peri (F), S peri (G), N peri (H), and I peri (I) parts were compared between the non-HM and HM groups. *p < 0.05, **p < 0.01, ***p < 0.001. T para, temporal parafovea; S para, superior parafovea; N para, nasal parafovea; I para, inferior parafovea; T peri, temporal perifovea; S peri, superior perifovea; N peri, nasal perifovea; and I peri, inferior perifovea; non-HM, nonhigh myopia; HM, high myopia.
Figure 6
Figure 6
Comparison of the RPC thicknesses at different parts of the optic disc between the non-HM and HM groups. The RPC thicknesses at the TS (A), ST (B), SN (C), NS (D), NI (E), IN (F), IT (G), and TI (H) parts of the optic disc were compared between the non-HM and HM groups. *p < 0.05, ***p < 0.001. NS, nasal superior; NI, nasal inferior; IN, inferior nasal; IT, inferior temporal; TI, temporal inferior; TS, temporal superior; ST, superior temporal; SN, superior nasal; non-HM, nonhigh myopia; HM, high myopia.
Figure 7
Figure 7
Comparison of 5 influencing factors between the non-HM and HM groups with a series of statistical analyses. The ensemble vessel densities of the inner retina segment ranging from the ILM to 9 μm below the OPL at the macula region were compared between the non-HM and HM groups (A). The vessel densities of the RPC at the optic disc were compared between the non-HM and HM groups (B). The smartphone usage time (C), continuous near work time (D), and sleeping before or after midnight (E) were compared between the non-HM and HM groups. The ROC curves of these 5 factors were shown in (F–J). The univariate logistic analysis of these 5 factors were shown in (K–O). ***p < 0.001. non-HM, nonhigh myopia; HM, high myopia; ROC, receiver operator characteristic; AUC, area under the curve; OR, odds ratio.
Figure 8
Figure 8
Multivariant logistic regression analysis of HM. The forest map of the ORs of these 5 factors is shown in (A). A HM prediction model comprised of these 5 factors is proposed, the sensitivity and specificity of which are shown in (B). HM, high myopia; AUC, area under the curve; ORs, odds ratios.

Similar articles

Cited by

References

    1. Holden BA, Fricke TR, Wilson DA, Jong M, Naidoo KS, Sankaridurg P, et al. . Global prevalence of myopia and high myopia and temporal trends from 2000 through 2050. Ophthalmology. (2016) 123:1036–42. doi: 10.1016/j.ophtha.2016.01.006, PMID: - DOI - PubMed
    1. Baird PN, Saw SM, Lanca C, Guggenheim JA, Smith Iii EL, Zhou X, et al. . Myopia. Nat Rev Dis Primers. (2020) 6:99. doi: 10.1038/s41572-020-00231-4 - DOI - PubMed
    1. Saw SM, Matsumura S, Hoang QV. Prevention and Management of Myopia and Myopic Pathology. Invest Ophthalmol Vis Sci. (2019) 60:488–99. doi: 10.1167/iovs.18-25221, PMID: - DOI - PubMed
    1. Morgan IG, Wu PC, Ostrin LA, Tideman JWL, Yam JC, Lan W, et al. . Imi risk factors for myopia. Invest Ophthalmol Vis Sci. (2021) 62:3. doi: 10.1167/iovs.62.5.3, PMID: - DOI - PMC - PubMed
    1. Morgan IG, French AN, Ashby RS, Guo X, Ding X, He M, et al. . The epidemics of myopia: Aetiology and prevention. Prog Retin Eye Res. (2018) 62:134–49. doi: 10.1016/j.preteyeres.2017.09.004 - DOI - PubMed

LinkOut - more resources