. 2023 Jul 6;13(29):20298-20313.
doi: 10.1039/d3ra02498a. eCollection 2023 Jun 29.

Effect of redox reactions on the thermoluminescence characteristics of Cu-doped NaLi2PO4 phosphors

Affiliations

Effect of redox reactions on the thermoluminescence characteristics of Cu-doped NaLi2PO4 phosphors

Bhuli Bai et al. RSC Adv. .

Abstract

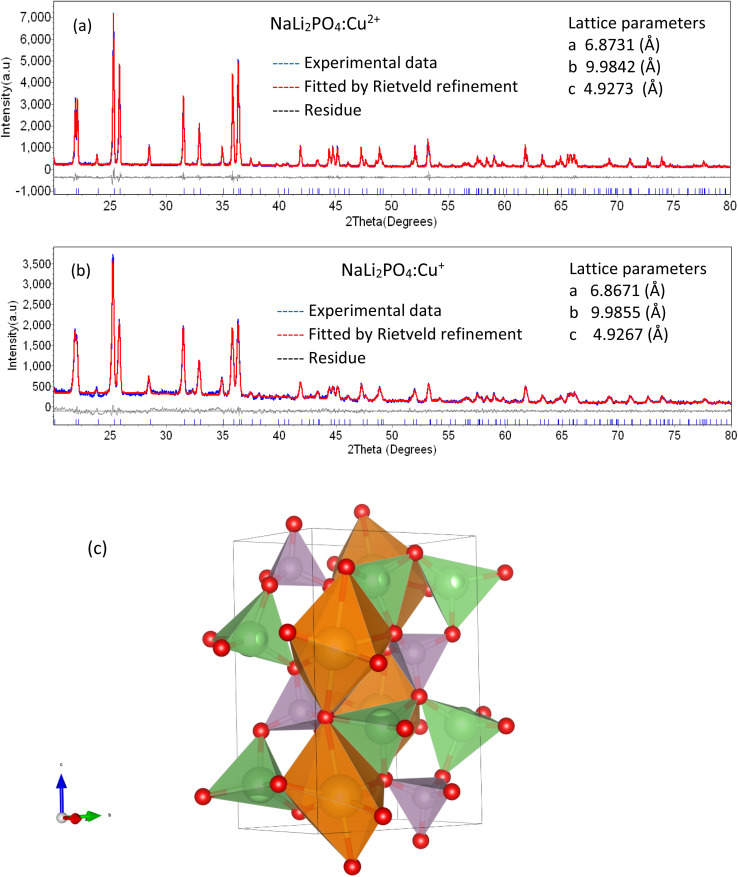
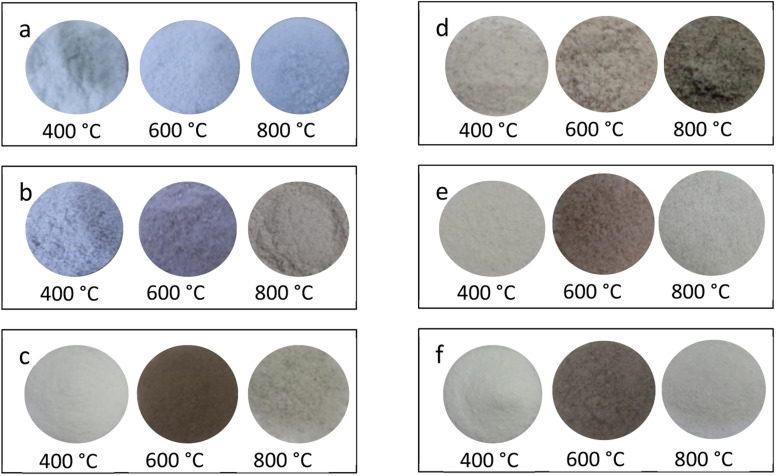
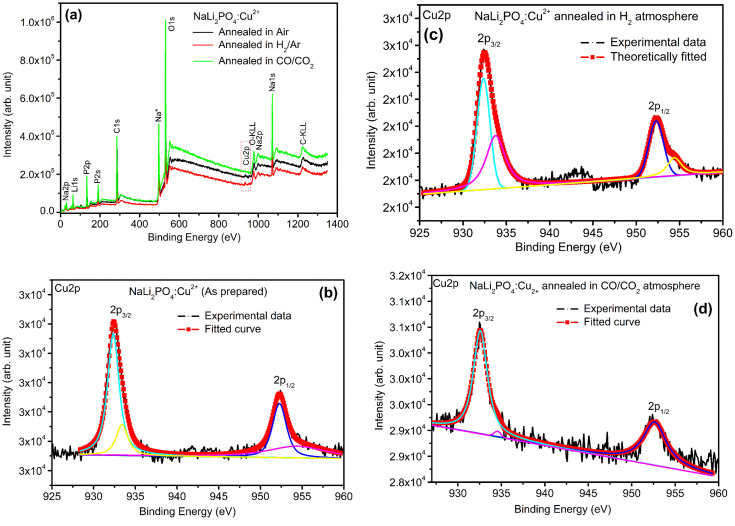
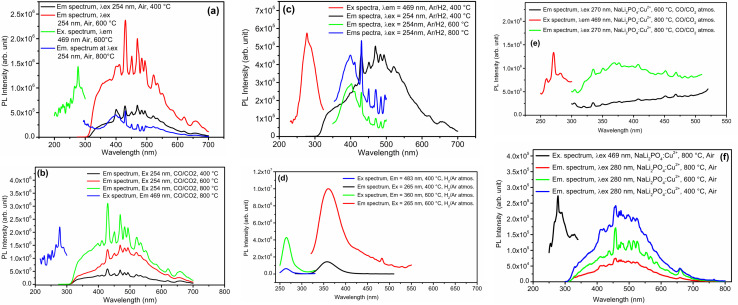
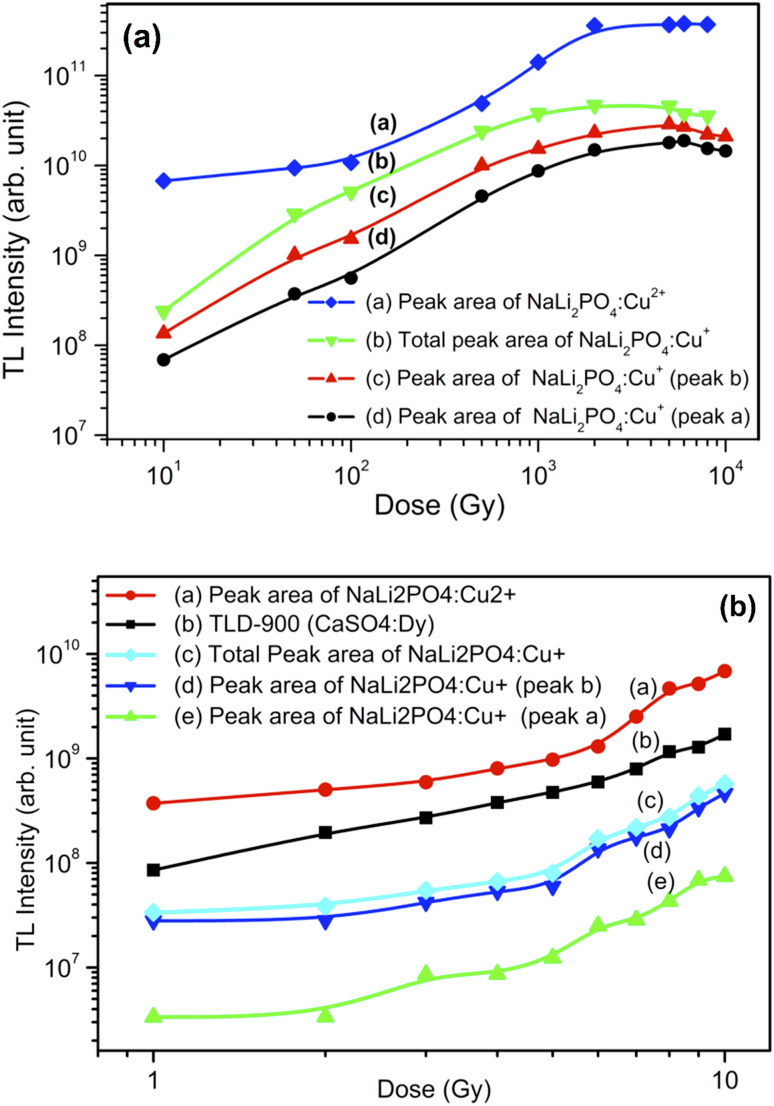
A Cu-doped NaLi2PO4 phosphor material was successfully synthesized through the high-temperature solid state diffusion method. It was mainly doped with Cu2Cl2 and CuCl2 salts for impurities in the form of Cu+ and Cu2+, respectively. Formation of the material in the single phase of the phosphor material was confirmed by powder XRD. Morphological and compositional characterization was done using XPS, SEM and EDS techniques. The materials were annealed in reducing, (10% H2 in Ar) and CO/CO2 (by burning charcoal in a closed system), as well as in oxidizing (air) atmospheres at different temperatures. ESR and PL studies were conducted for studying redox reactions due to annealing and its effect on TL characteristics. It is known that the impurity Cu could exist in Cu2+, Cu+ and Cu0 forms. The material was doped with two different salts (Cu2Cl2 and CuCl2) as sources of the impurities in two different forms i.e., Cu+ and Cu2+, however, it was found that it gets incorporated in both the forms inside the material. Also, annealing in different atmospheres not only changed their ionic states but also affected the sensitivity of these phosphors. It was observed that at ∼10 Gy, NaLi2PO4:Cu(ii) is around 3.3 times, 3.0 times and almost equally sensitive than commercially available TLD-900 phosphor on annealing in air, 10% H2 in Ar and CO/CO2 at 400, 400 and 800 °C, respectively. However, NaLi2PO4:Cu(i) becomes 1.8 times sensitive after annealing in CO/CO2 at 800 °C as compared to TLD-900. With high sensitivity, both the materials NaLi2PO4:Cu(ii) and NaLi2PO4:Cu(i) are good candidates for radiation dosimetry with a wide dose response (mGy-5.0 kGy).


Conflict of interest statement

There is no conflict of interest to declare.

Figures

Fig. 1
Fig. 1. PXRD patterns of the NaLi2PO4 phosphors: (a) PXRD pattern of the NaLi2PO4:Cu(ii) phosphor material, (b) PXRD pattern of the NaLi2PO4:Cu(i) phosphor material, (c) crystal structure. Theoretically fitted by Rietveld refinement patterns along with JCPDS data (file # 80-2110) are shown for comparison. The lattice parameters used for the fittings are also shown in the inset.
Fig. 2
Fig. 2. A typical EDS spectrum of NaLi2PO4:Cu(ii) (0.1 mol%) material. The SEM image and the elemental composition are also shown in the inset.
Fig. 3
Fig. 3. (a) Optimization of concentration of the impurity in the host matrix NaLi2PO4. TL glow curve of the material doped with different impurity (Cu2+) concentrations (0.05–2.0 mol%) and exposed at 10 Gy of γ-rays from Co60 source. The materials were annealed at 400 °C in air. Inset shows TL intensity of NaLi2PO4:Cu(ii) vs. Cu2+ impurity concentration, (b) TL glow curve of the material doped with different impurity (Cu+) concentrations (0.05–1.0 mol%) and exposed at 10 Gy of gamma-rays from Co60 source. Inset shows TL intensity of NaLi2PO4:Cu(i) vs. Cu+ impurity concentration.
Fig. 4
Fig. 4. (a) Optimization of the annealing temperature effect on NaLi2PO4:Cu(ii). TL glow curve of the material with doped Cu2+ impurity (0.1 mol%) concentration and exposed at 10 Gy of gamma-rays from the Co60 source. The plot of TL intensity (peak height) vs. annealing temperature is also shown in the inset, (b) optimization of the annealing temperature effect on NaLi2PO4:Cu(i). TL glow curve of the material doped with Cu+ impurity (0.1 mol%) concentration and exposed at 10 Gy of gamma-rays from the Co60 source. The plot of TL intensity (peak height) vs. annealing temperature is also shown inside.
Fig. 5
Fig. 5. (a) NaLi2PO4:Cu(ii) phosphor material annealed in various atmosphere at different temperatures 400, 600 and 800 °C for 1.0 h, (b) NaLi2PO4:Cu(i) phosphor material annealed in various atmosphere at different temperatures 400, 600 and 800 °C for 1.0 h.
Fig. 6
Fig. 6. Change in colour of the powder samples after annealing: (a) NaLi2PO4:Cu(ii) annealed in air atmosphere at various temperatures, (b) NaLi2PO4:Cu(ii) annealed in 10% H2 in Ar atmosphere at various temperatures, (c) NaLi2PO4:Cu(ii) annealed in CO/CO2 atmosphere at various temperatures, (d) NaLi2PO4:Cu(i) annealed in air atmosphere at various temperatures, (e) NaLi2Po4:Cu(i) annealed in 10% H2 in Ar atmosphere at various temperatures, (f) NaLi2PO4:Cu(i) annealed in CO/CO2 atmosphere at various temperatures. All the images were taken in room light with high-resolution Canon DSLR camera EOS 1500D.
Fig. 7
Fig. 7. (a) ESR spectra of the microcrystalline NaLi2PO4:Cu(ii) phosphor materials annealed in air, 10% H2 in Ar and CO/CO2 atmospheres, (b) ESR spectra of the microcrystalline NaLi2PO4:Cu(i) phosphor materials annealed in air, 10% H2 in Ar and CO/CO2 atmospheres. The ESR spectrum for the DPPH (g = 2.0037) has also been given for calibration.
Fig. 8
Fig. 8. (a) XPS survey of NaLi2PO4:Cu(ii) annealed in various atmospheres for Cu ions, (b) XPS deconvoluted spectrum of NaLi2PO4:Cu(ii) as prepared sample for Cu 2p3/2 and Cu 2p1/2, (c) XPS spectrum of NaLi2PO4:Cu(ii) annealed in 10% H2 in Ar atmosphere at 400 °C for Cu 2p3/2 and Cu 2p1/2, (d) XPS spectrum of NaLi2PO4:Cu(ii) annealed in CO/CO2 atmosphere at 800 °C for Cu 2p3/2 and Cu 2p1/2.
Fig. 9
Fig. 9. (a) XPS survey of NaLi2PO4:Cu(i) annealed in various atmospheres for Cu ions, (b) XPS deconvoluted spectrum of NaLi2PO4:Cu(i) as prepared sample for Cu 2p3/2 and Cu 2p1/2, (c) XPS spectrum of NaLi2PO4:Cu(i) annealed in 10% H2 in Ar atmosphere at 400 °C for Cu 2p3/2 and Cu 2p1/2, (d) XPS spectrum of NaLi2PO4:Cu(i) annealed in CO/CO2 atmosphere at 800 °C for Cu 2p3/2 and Cu 2p1/2.
Fig. 10
Fig. 10. (a) XPS deconvoluted spectrum of NaLi2PO4:Cu(i) as prepared sample for O 1s and its vacancies, (b) XPS spectrum of NaLi2PO4:Cu(i) annealed in 10% H2 in Ar atmosphere at 400 °C for O 1s and its vacancies, (c) XPS spectrum of NaLi2PO4:Cu(i) annealed in CO/CO2 atmosphere at 800 °C for O 1s and its vacancies.
Fig. 11
Fig. 11. (a) XPS deconvoluted spectrum of NaLi2PO4:Cu(ii) as prepared sample for O 1s and its vacancies, (b) XPS spectrum of NaLi2PO4:Cu(ii) annealed in 10% H2 in Ar atmosphere at 400 °C for O 1s and its vacancies, (c) XPS spectrum of NaLi2PO4:Cu(ii) annealed in CO/CO2 atmosphere at 800 °C for O 1s and its vacancies.
Fig. 12
Fig. 12. (a) PL emission and excitation spectra of NaLi2PO4:Cu(i) annealed in air atmosphere at 400, 600 and 800 °C, (b) PL emission and excitation spectra of NaLi2PO4:Cu(i) annealed in CO/CO2 atmosphere at 400, 600 and 800 °C, (c) PL emission and excitation spectra of NaLi2PO4:Cu(i) annealed in 10% H2 in Ar at 400, 600 and 800 °C, (d) PL emission and excitation spectra of NaLi2PO4:Cu(ii) annealed in 10% H2 in Ar at 400 and 600 °C, (e) PL emission and excitation spectra of NaLi2PO4:Cu(ii) annealed in CO/CO2 atmosphere at 600 and 800 °C, (f) PL emission and excitation spectra of NaLi2PO4:Cu(ii) annealed in 10% H2 in Ar at 400, 600 and 800 °C.
Fig. 13
Fig. 13. (a) Comparison of TL sensitivity of the NaLi2PO4:Cu(ii) materials annealed in air, in 10% H2 in Ar and in CO/CO2 atmospheres annealed at 400, 400 and 800 °C, respectively, with that of CaSO4:Dy (TLD-900) phosphor, (b) similar comparison of NaLi2PO4:Cu(i) phosphors annealed under same conditions.
Fig. 14
Fig. 14. (a) Dose response (curve a) of NaLi2Po4:Cu(ii) (0.1 mol%) material annealed at 400 °C in air in the dose range of 1.0 to 10 Gy. The dose response (curve b) of CaSo4:Dy (TLD-900) is also given for comparison. Dose response (curve c) of NaLi2Po4:Cu(i) (0.1 mol%) material annealed at 400 °C in air in the dose range of 1.0 to 10 Gy. Dose response (curve d and e) of individual peaks (peak a and peak b) are also are also given for clarity, (b) dose response (curve a) of NaLi2PO4:Cu(ii) (0.1 mol%) material annealed at 400 °C in air in the dose range of 10.0 Gy to 10 kGy. Dose response (curve b) of NaLi2PO4:Cu(i) (0.1 mol%) material annealed at 400 °C in air in the dose range of 10.0 Gy to 10 kGy. Dose response (curve c and d) of individual peaks (peak a and peak b) are also are also given for clarity.
Fig. 15
Fig. 15. (a) TL fading of NaLi2PO4:Cu(ii), TL fading was taken immediately after the irradiation, i.e., day 1 to 60 days, (b) TL fading NaLi2PO4:Cu(i) from day 1 to 60 days.

Similar articles

Cited by

References

    1. McKeever S. W. S., Moscovitch M. and Townsend P. D., Thermoluminescence Dosimetry Materials: Properties and Uses, Nuclear Technology Publishing, Ashford, 1995
    1. Chen R. and McKeever S. W. S., Theory of Thermoluminescence and Related Phenomena, World Scientific Publishing Company, Singapore, 1997
    1. Azorín J. Furetta C. Scacco A. Phys. Status Solidi. 1993;138:9–46. doi: 10.1002/pssa.2211380102. - DOI
    1. Bhatt B. C. Kulkarni M. S. Defect Diffus. Forum. 2014;347:179–227.
    1. Sahare P. D. Ranjan R. Salah N. Lochab S. P. J. Phys. D: Appl. Phys. 2007;40:759–764. doi: 10.1088/0022-3727/40/3/011. - DOI