[Preprint]. 2023 Jun 26:2023.06.23.546284.
doi: 10.1101/2023.06.23.546284.

Extensible benchmarking of methods that identify and quantify polyadenylation sites from RNA-seq data

Affiliations

Extensible benchmarking of methods that identify and quantify polyadenylation sites from RNA-seq data

Sam Bryce-Smith et al. bioRxiv. .

Update in

  • Extensible benchmarking of methods that identify and quantify polyadenylation sites from RNA-seq data.
    Bryce-Smith S, Burri D, Gazzara MR, Herrmann CJ, Danecka W, Fitzsimmons CM, Wan YK, Zhuang F, Fansler MM, Fernández JM, Ferret M, Gonzalez-Uriarte A, Haynes S, Herdman C, Kanitz A, Katsantoni M, Marini F, McDonnel E, Nicolet B, Poon CL, Rot G, Schärfen L, Wu PJ, Yoon Y, Barash Y, Zavolan M. Bryce-Smith S, et al. RNA. 2023 Dec;29(12):1839-1855. doi: 10.1261/rna.079849.123. Epub 2023 Oct 10. RNA. 2023. PMID: 37816550 Free PMC article. Review.

Abstract

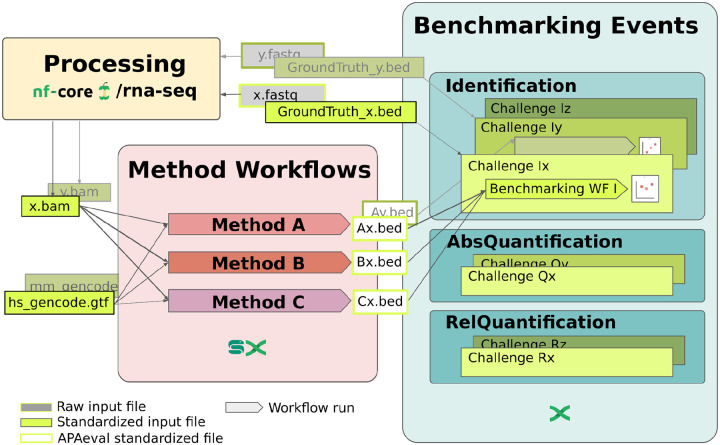
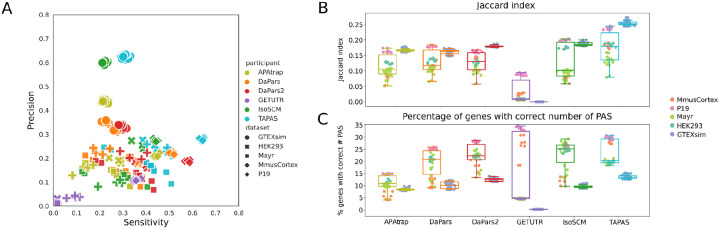
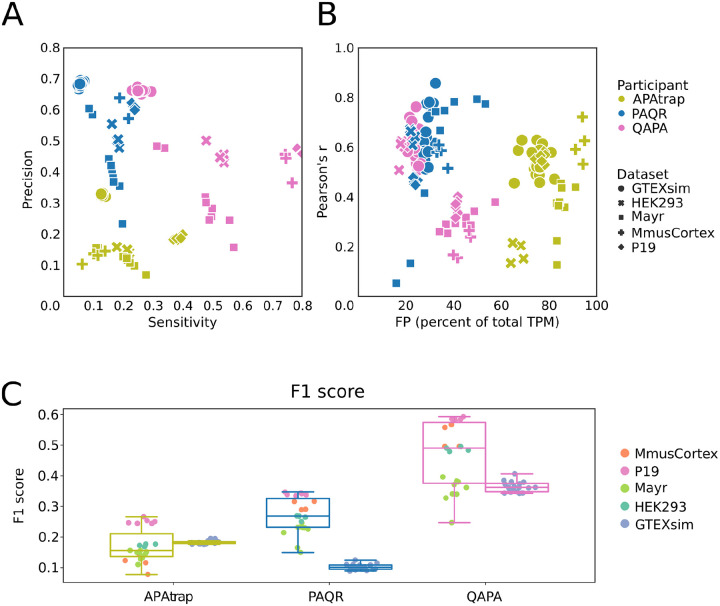
The tremendous rate with which data is generated and analysis methods emerge makes it increasingly difficult to keep track of their domain of applicability, assumptions, and limitations and consequently, of the efficacy and precision with which they solve specific tasks. Therefore, there is an increasing need for benchmarks, and for the provision of infrastructure for continuous method evaluation. APAeval is an international community effort, organized by the RNA Society in 2021, to benchmark tools for the identification and quantification of the usage of alternative polyadenylation (APA) sites from short-read, bulk RNA-sequencing (RNA-seq) data. Here, we reviewed 17 tools and benchmarked eight on their ability to perform APA identification and quantification, using a comprehensive set of RNA-seq experiments comprising real, synthetic, and matched 3'-end sequencing data. To support continuous benchmarking, we have incorporated the results into the OpenEBench online platform, which allows for seamless extension of the set of methods, metrics, and challenges. We envisage that our analyses will assist researchers in selecting the appropriate tools for their studies. Furthermore, the containers and reproducible workflows generated in the course of this project can be seamlessly deployed and extended in the future to evaluate new methods or datasets.

Keywords: (alternative) polyadenylation; Benchmarking; RNA-seq; bioinformatics; community initiative.


Figures

Figure 1.
Figure 1.. Overview of APAeval benchmarking strategy.
RNA-seq data (“x.fastq”) was processed with the nf-core RNA-seq pipeline (nf-core/rna-seq) for quality control and mapping. The matching ground truth data (“GroundTruth_x.bed”) was retrieved from the respective publications in bed format. The processed input data (“x.bam”), as well as a genome annotation (“hs_gencode.gtf”), and if required a reference PAS atlas in BED format (not shown), were provided to the benchmarked methods. For running the methods, a reusable “method workflow” was written for each tool in either Snakemake or Nextflow. Each method workflow contains all necessary pre- and post-processing steps needed to process data from the input formats provided by APAeval, to the format required for the benchmarking workflows (“Ax.bed”, “Bx.bed”, etc.). For each benchmarking event (“Identification”, “AbsoluteQuantification”, “RelativeQuantification”), a reusable “benchmarking workflow” was written to compute a defined set of metrics from the comparison of outputs of method workflows with the corresponding ground truth data. Finally, the metrics for all methods for all datasets were compared within each event.
Figure 2:
Figure 2:. Results of the PAS identification event.
Predicted site locations were extended by 50 nucleotides in both directions before the intersection with GT sites and each tool was given their preferred annotation (if specified by the developers) to identify the PAS. Results using GENCODE annotation are given in Supplemental Fig. 4. (A) Scatter plot of precision versus sensitivity. Each symbol corresponds to a sample-tool pair, with the shape of the symbol indicating the sample set and its color indicating the tool. (B) Box plots of Jaccard indices indicating the overlap of predicted and ground truth sites, with predicted sites being extended symmetrically by 50 nucleotides. The tools used to predict the sites are shown on the x-axis, each with two associated box plots, one for the real data (left) and another for simulated data (right). Each point is labeled according to the code given in the legend. (C) Percentage of genes for which the number of PD sites was the same as the number of GT sites. Color scheme and organization as in B.
Figure 3:
Figure 3:. Results of PAS isoform quantification.
(A) Scatter plot of precision vs. sensitivity. Each sample and tool combination is represented as a symbol, with shape and color defined in the legend. (B) Pearson correlation of PD and GT site expression. The correlation coefficient for each sample is plotted against the percentage of total TPM that a method attributes to PAS that are not expressed in the ground truth (pct-FP). (C) Box plots of F1 scores. Box plots are drawn separately for real (left, see color scheme in the legend) and simulation (right) samples.
Figure 4:
Figure 4:. Ground-truth (GT) terminal exon (TE) and polyadenylation site (PAS) filtering for high-confidence, alternative polyadenylation (APA) sites.
(A) Cartoon example of heuristics applied to composite TEs based on transcript (Tx) annotations and overlapping GT-PAS based on expression (transcripts per million, TPM) and relative usage of each GT-PAS within each composite TE. Percentages represent the polyadenylation usage (PAU) for each PAS relative to other PAS in the same TE. (B) Final GT TE and PAS retained for downstream comparison to tool predictions.
Figure 5:
Figure 5:. The effect of GT-PAS type choice on correlation with predictions:
(A) Pearson correlation coefficient when considering all-PD predicted values that match GT-allPAS values (both distal and proximal) using each tool’s preferred annotation and a match window of 50 nt. Left boxes for each method represent real RNA-seq data and right boxes are simulated RNA-seq data. Each point is labeled according to dataset grouping given in the legend. (B) As in (A), but using all-PD PAS matches to distal GT-PAS (GT-dPAS) values only. (C) As in (A), but using all-PD PAS matches to proximal GT-PAS (GT-pPAS) values only. For all metrics, each dataset needed a minimum of 20 matched values to be plotted.
Figure 6.
Figure 6.. Distribution of absolute differences between ground truth and prediction values.
(A) eCDF for simulated human (GTEXsim, top) and real mouse (P19, bottom) datasets showing the absolute difference between all-PD matches to GT-allPAS values for each tool’s preferred annotation. Lines represent the mean of all experiments in the group and shaded regions represent ± one SD. Inset barcharts show the mean fraction of unique, GT-TEs with APA (defined in Figure 4, based on RefSeq annotation) represented by all-PD matches. Error bar shows one SD. Each dataset needed a minimum of 20 matched values to be plotted. (B) As in (A), but only for matches to proximal GT-PAS (GT-pPAS) values. Inset barchart shows mean fraction of unique GT-TEs with a pPAS matched to the tool predictions. Error bar shows one SD. (C) As in (A), but only for matches to distal GT-PAS (GT-dPAS) values. Inset barchart shows mean fraction of unique GT-TEs with a dPAS matched to the tool. Error bar shows one SD. (All datasets are shown in Supplemental Fig. 12 and the same plots using GENCODE annotation instead are shown in Supplemental Fig. 13).
Figure 7:
Figure 7:. Overlap of predicted with ground truth PAS.
(A) Distribution of fractions of ground truth polyadenylation sites (GT-PAS) from TEs with APA that were matched to a tool predicted polyadenylation site (PD-PAS) based on RefSeq/preferred annotations within a window of 50 nucleotides. Left boxes are from real RNA-seq datasets while right boxes are for simulated datasets with points colored according to experimental groups. (B) Fraction of ground-truth (GT) TEs with APA that had PD-PAS matches to both distal and proximal GT-PAS within a window of 50 nucleotides.

References

    1. Arefeen A., Liu J., Xiao X., & Jiang T. (2018). TAPAS: Tool for alternative polyadenylation site analysis. Bioinformatics, 34(15), 2521–2529. 10.1093/bioinformatics/bty110 - DOI - PMC - PubMed
    1. Capella-Gutierrez S., de la Iglesia D., Haas J., Lourenco A., Fernández J. M., Repchevsky D., Dessimoz C., Schwede T., Notredame C., Gelpi J. L., & Valencia A. (2017). Lessons Learned: Recommendations for Establishing Critical Periodic Scientific Benchmarking (p. 181677). bioRxiv. 10.1101/181677 - DOI
    1. Cass A. A., & Xiao X. (2019). MountainClimber Identifies Alternative Transcription Start and Polyadenylation Sites in RNA-Seq. Cell Systems, 9(4), 393–400.e6. 10.1016/j.cels.2019.07.011 - DOI - PMC - PubMed
    1. Chen M., Ji G., Fu H., Lin Q., Ye C., Ye W., Su Y., & Wu X. (2020). A survey on identification and quantification of alternative polyadenylation sites from RNA-seq data. Briefings in Bioinformatics, 21(4), 1261–1276. 10.1093/bib/bbz068 - DOI - PubMed
    1. Da Veiga Leprevost F., Grüning B. A., Alves Aflitos S., Röst H. L., Uszkoreit J., Barsnes H., Vaudel M., Moreno P., Gatto L., Weber J., Bai M., Jimenez R. C., Sachsenberg T., Pfeuffer J., Vera Alvarez R., Griss J., Nesvizhskii A. I., & Perez-Riverol Y. (2017). BioContainers: An open-source and community-driven framework for software standardization. Bioinformatics, 33(16), 2580–2582. 10.1093/bioinformatics/btx192 - DOI - PMC - PubMed

Publication types