[Preprint]. 2023 Jun 30:2023.06.30.547218.
doi: 10.1101/2023.06.30.547218.

The evolutionary history of hepaciviruses

Affiliations

The evolutionary history of hepaciviruses

Y Q Li et al. bioRxiv. .

Abstract

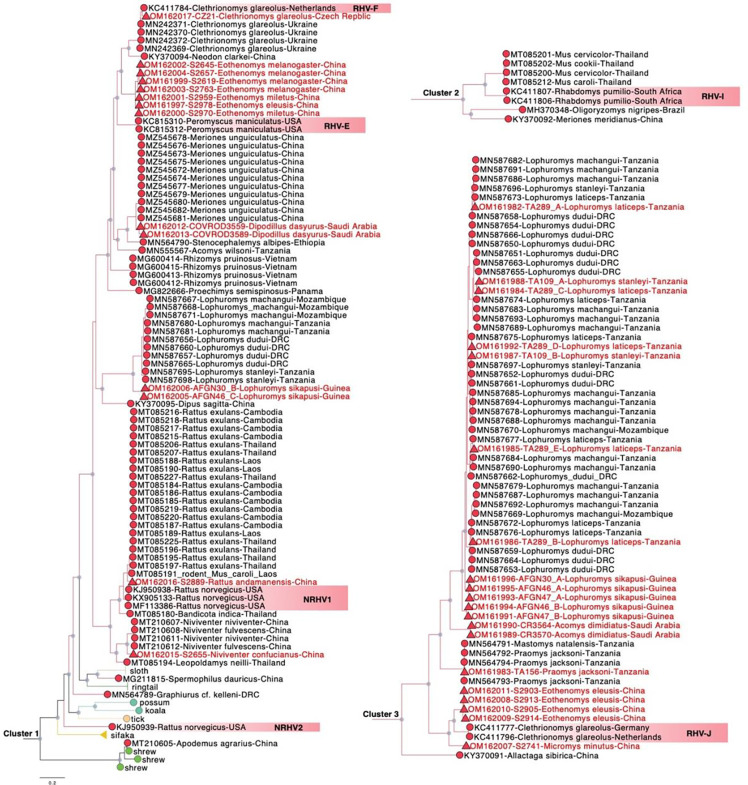
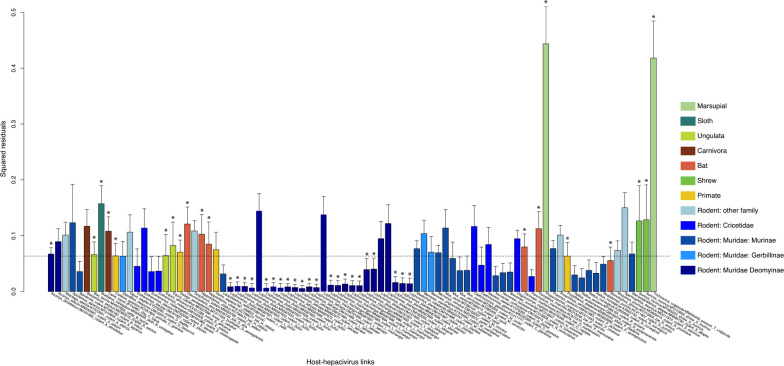
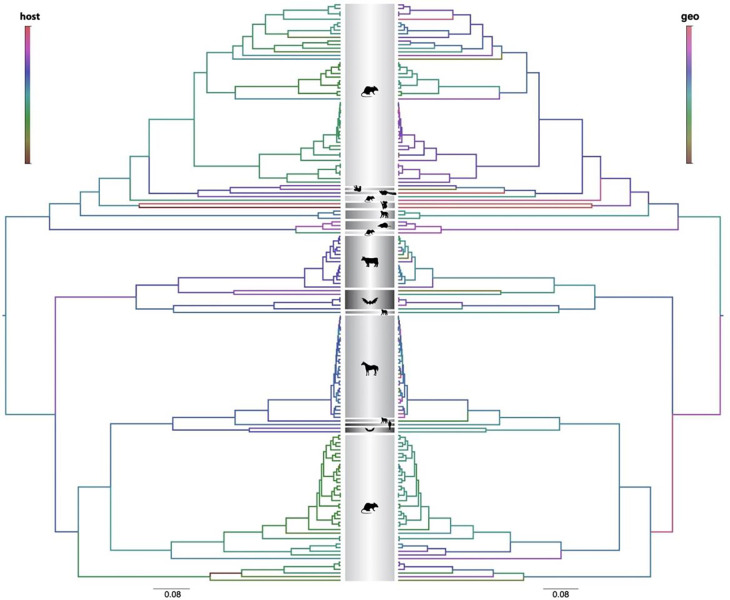
In the search for natural reservoirs of hepatitis C virus (HCV), a broad diversity of non-human viruses within the Hepacivirus genus has been uncovered. However, the evolutionary dynamics that shaped the diversity and timescale of hepaciviruses evolution remain elusive. To gain further insights into the origins and evolution of this genus, we screened a large dataset of wild mammal samples (n = 1,672) from Africa and Asia, and generated 34 full-length hepacivirus genomes. Phylogenetic analysis of these data together with publicly available genomes emphasizes the importance of rodents as hepacivirus hosts and we identify 13 rodent species and 3 rodent genera (in Cricetidae and Muridae families) as novel hosts of hepaciviruses. Through co-phylogenetic analyses, we demonstrate that hepacivirus diversity has been affected by cross-species transmission events against the backdrop of detectable signal of virus-host co-divergence in the deep evolutionary history. Using a Bayesian phylogenetic multidimensional scaling approach, we explore the extent to which host relatedness and geographic distances have structured present-day hepacivirus diversity. Our results provide evidence for a substantial structuring of mammalian hepacivirus diversity by host as well as geography, with a somewhat more irregular diffusion process in geographic space. Finally, using a mechanistic model that accounts for substitution saturation, we provide the first formal estimates of the timescale of hepacivirus evolution and estimate the origin of the genus to be about 22 million years ago. Our results offer a comprehensive overview of the micro- and macroevolutionary processes that have shaped hepacivirus diversity and enhance our understanding of the long-term evolution of the Hepacivirus genus.

Keywords: co-divergence; cross-species transmission; hepacivirus; phylogeography; timescale estimation.


Figures

Fig. 1.
Fig. 1.. Phylogenetic reconstruction of hepaciviruses based on complete genomes.
Selected clades have been collapsed to emphasize the rodent hepacivirus relationships. Tips in circles indicate sequences generated in previous studies (n = 259). Tips in triangles indicate novel sequences generated in this study (n = 34). Clades are colored based on the host type as represented in legend. Internal nodes with Shimodaira-Hasegawa (SH)-like support values ≥ 80 are labeled with gray circles. The scale bar indicates the number of amino acid substitutions per site. To better frame phylogenetic relationships, the current demarcations of hepacivirus species and their abbreviations by ICTV are highlighted in coloured boxes at the tips of the trees. The 3 major clusters containing rodent hepaciviruses are labeled for future reference (clusters 1–3).
Fig. 2.
Fig. 2.. Phylogenetic grouping of rodent hepaciviruses within their three major clusters.
Tips with red circles indicate the rodent sequences (n= 125) generated in previous studies. Tips with triangles indicate the novel rodent hepacivirus sequences (n = 34) generated in this study. Internal nodes with bootstrap values ≥ 80 are labeled with gray circles. The scale bar indicates the number of amino acid substitutions per site. The ICTV classified hepacivirus species are highlighted in coloured boxes at the tips of the tree as shown in Fig. 1.
Fig. 3.
Fig. 3.. Tanglegram of host (left) and hepaciviruses (right).
The host phylogeny was inferred for 31 genes from 58 mammalian species. For Myodes glareolus, Gerbillus dasyurus and Microtus clarkei their updated species names were used: Clethrionomys glareolus, Dipodillus dasyurus and Neodon clarkei, respectively. The hepacivirus phylogeny was inferred for 85 representative genomes. Clades and associations were colored based on host type.
Fig. 4.
Fig. 4.. Contribution of each host-hepacivirus association to the general co-evolution pattern.
Bars represent Jack-knifed squared residuals with the upper 95% confidence intervals from PACo test. The median squared residual value is shown with a dashed line. Stars represent the host-hepacivirus links that were also tested to be significant in AxParafit (p < 0.05). Colors represent different host types as shown in Fig. 3.
Fig. 5.
Fig. 5.. Geographic distribution of hepaciviruses based on complete genome sampling locations.
Except for the HCV genotypes, clade colors in the hepacivirus ML tree correspond to geographic locations in the map. Only major host types occupying a clade are marked with icons next to the phylogeny. Arthropods hepaciviruses, which include one tick hepacivirus close to marsupial viruses, three tick hepaciviruses from cattle, one mosquito hepacivirus clustering with bird viruses, as well as one canine hepacivirus within the equine lineage are all marked with black dots at the tips.
Fig. 6.
Fig. 6.. Non-mammalian hepacivirus (n = 13) phylogeny colored by precisions of host distances and geographical distances generated from the strict Brownian one-dimensional BMDS analysis.
The two phylogenies were derived from the same Bayesian maximum clade credibility (MCC) tree.
Fig. 7.
Fig. 7.. Mammalian hepacivirus (subset 1, n = 160) phylogeny colored by precisions of host distances and geographical distances generated from the strict Brownian one-dimensional BMDS analysis.
The two phylogenies were derived from the same Bayesian maximum clade credibility (MCC) tree.
Fig. 8.
Fig. 8.. Time-scaled hepaciviruses phylogeny obtained using the PoW-model.
Lineages were collapsed based on the host type. Node age uncertainty is shown with 95% highest posterior density (HPD) as interval blue bars. Nodes of interest are marked as A - M for further discussion, and the tMRCA and 95% HPD are listed in Table 3.

References

    1. Abascal F, Zardoya R, Telford MJ. 2010. TranslatorX: multiple alignment of nucleotide sequences guided by amino acid translations. Nucleic Acids Res 38:W7–W13. - PMC - PubMed
    1. Aiewsakun P, Katzourakis A. 2016. Time-Dependent Rate Phenomenon in Viruses.Ross SR, editor. J Virol 90:7184–7195. - PMC - PubMed
    1. Andrews S. 2010. Babraham Bioinformatics - FastQC A Quality Control tool for High Throughput Sequence Data. Available from: https://www.bioinformatics.babraham.ac.uk/projects/fastqc/
    1. Arenas M, Posada D. 2010. The Effect of Recombination on the Reconstruction of Ancestral Sequences. Genetics 184:1133–1139. - PMC - PubMed
    1. Ayres DL, Darling A, Zwickl DJ, Beerli P, Holder MT, Lewis PO, Huelsenbeck JP, Ronquist F, Swofford DL, Cummings MP, et al. 2012. BEAGLE: An Application Programming Interface and High-Performance Computing Library for Statistical Phylogenetics. Systematic Biology 61:170–173. - PMC - PubMed

Publication types