[Preprint]. 2025 Jan 2:2023.06.25.546478.
doi: 10.1101/2023.06.25.546478.

CaBLAM! A high-contrast bioluminescent Ca2+ indicator derived from an engineered Oplophorus gracilirostris luciferase

Affiliations

CaBLAM! A high-contrast bioluminescent Ca2+ indicator derived from an engineered Oplophorus gracilirostris luciferase

Gerard G Lambert et al. bioRxiv. .

Abstract

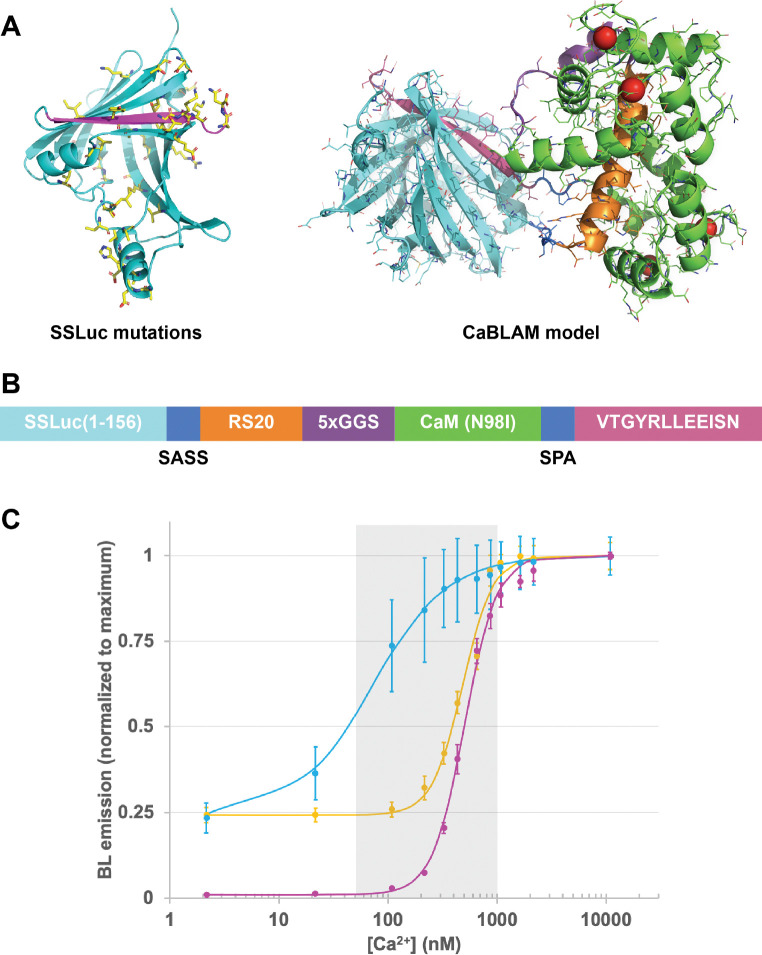
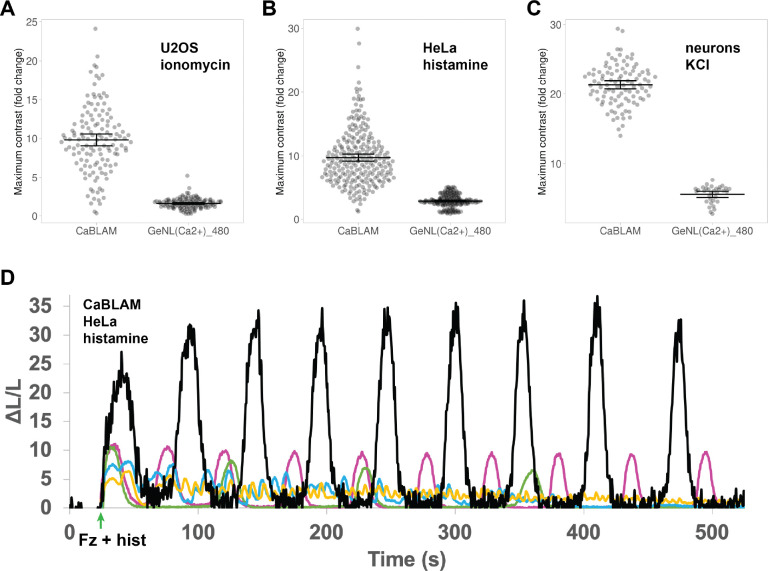
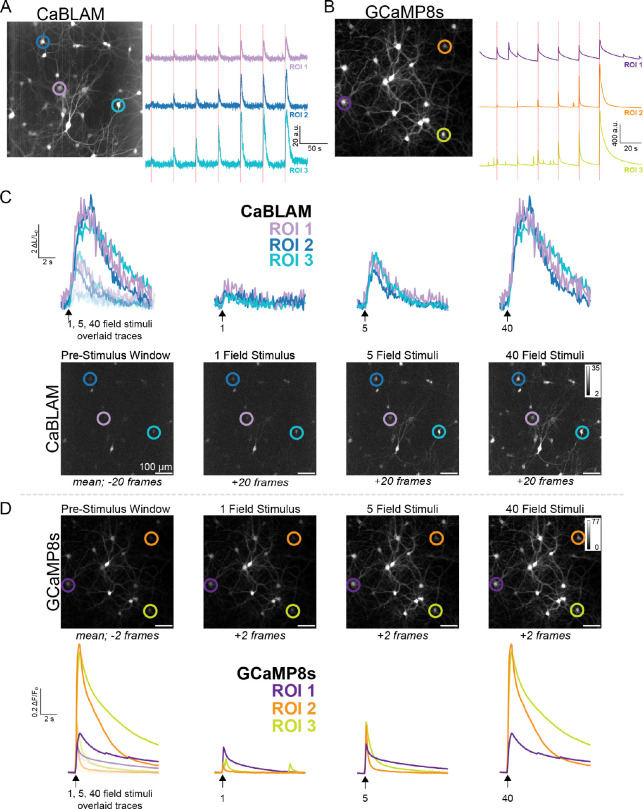
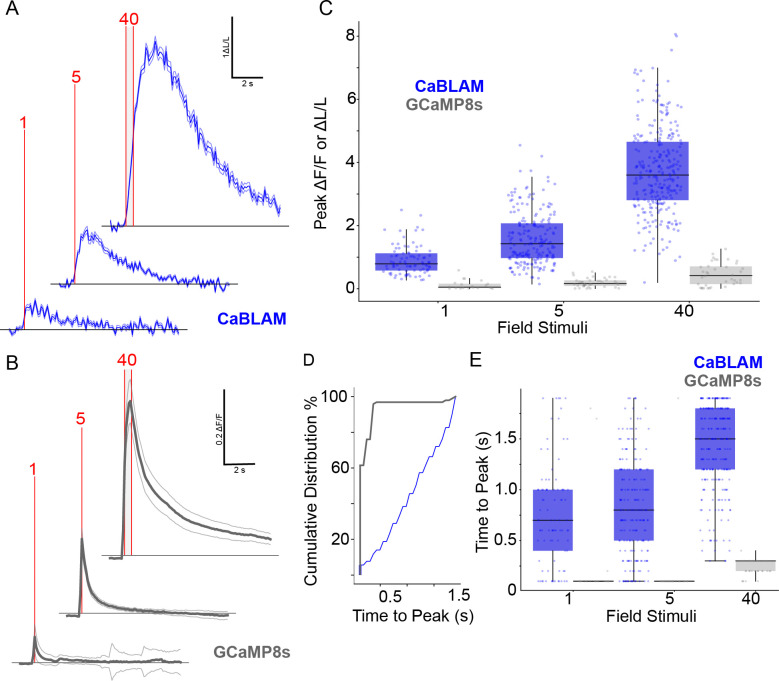
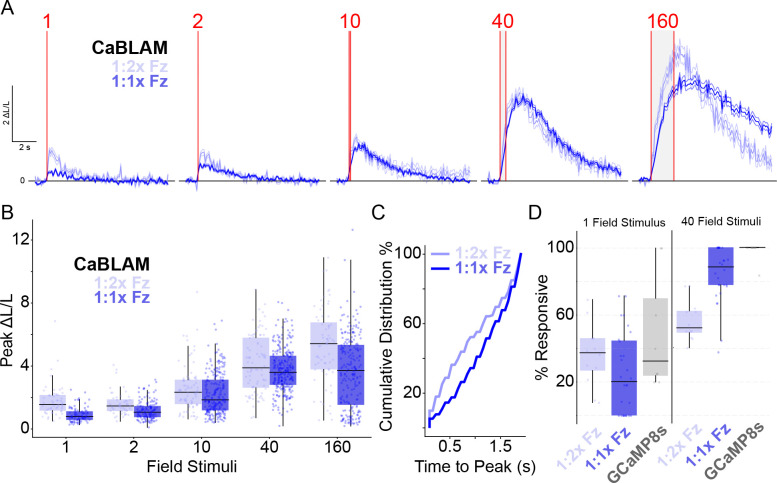
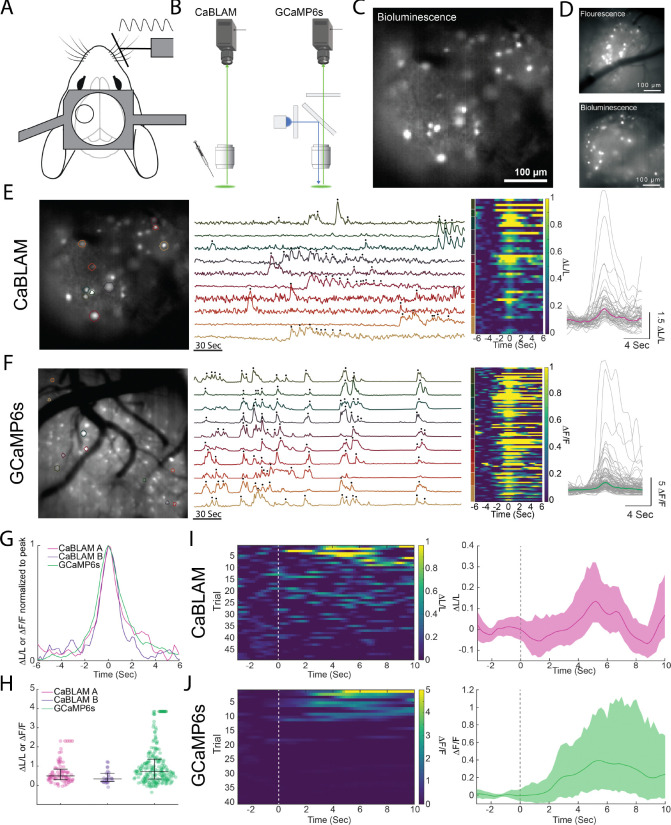
Ca2+ plays many critical roles in cell physiology and biochemistry, leading researchers to develop a number of fluorescent small molecule dyes and genetically encodable probes that optically report changes in Ca2+ concentrations in living cells. Though such fluorescence-based genetically encoded Ca2+ indicators (GECIs) have become a mainstay of modern Ca2+ sensing and imaging, bioluminescence-based GECIs-probes that generate light through oxidation of a small-molecule by a luciferase or photoprotein-have several distinct advantages over their fluorescent counterparts. Bioluminescent tags do not photobleach, do not suffer from nonspecific autofluorescent background, and do not lead to phototoxicity since they do not require the extremely bright extrinsic excitation light typically required for fluorescence imaging, especially with 2-photon microscopy. Current BL GECIs perform poorly relative to fluorescent GECIs, producing small changes in bioluminescence intensity due to high baseline signal at resting Ca2+ concentrations and suboptimal Ca2+ affinities. Here, we describe the development of a new bioluminescent GECI, "CaBLAM," which displays much higher contrast (dynamic range) than previously described bioluminescent GECIs and has a Ca2+ affinity suitable for capturing physiological changes in cytosolic Ca2+ concentration. Derived from a new variant of Oplophorus gracilirostris luciferase with superior in vitro properties and a highly favorable scaffold for insertion of sensor domains, CaBLAM allows for single-cell and subcellular resolution imaging of Ca2+ dynamics at high frame rates in cultured neurons and in vivo. CaBLAM marks a significant milestone in the GECI timeline, enabling Ca2+ recordings with high spatial and temporal resolution without perturbing cells with intense excitation light.


Conflict of interest statement

Competing interests The authors declare no competing or financial interests.

Figures

Figure 1.
Figure 1.
CaBLAM architecture and Ca2+ affinity. (A) Structure models of eKL9h and CaBLAM. Side chain positions with mutations relative to eKAZ are depicted as yellow sticks in the luciferase model. The C-terminal peptide is depicted in magenta on both structure models. (B) Architecture of CaBLAM (not to scale), with colors corresponding to the model structure backbone. (C) In vitro Ca2+ titration of CaBLAM (magenta) alongside GeNL(Ca2+)_480 and CaMBI_110. The physiologically relevant Ca2+ concentration range between 50nM and 1μM is shaded.
Figure 2.
Figure 2.
Characterization of CaBLAM in cultured cell lines and rat cortical neurons. CaBLAM and GeNL(Ca2+)_480 in (A) U2OS cells treated with ionomycin and 1mM external Ca2+, (B) HeLa cells treated with L-histamine, and (C) rat cortical neurons depolarized with KCl. Data points represent contrast (fold change) between steady-state resting BL GECI signal and peak high-Ca2+ GECI signal after treatment. Each point corresponds to a single cell. Mean contrast is shown for each condition with error bars representing the 95%CI for each. (D) Representative CaBLAM signals in HeLa cells treated with L-histamine. Luciferin substrate (Fz) was injected along with L-histamine, indicated by the green arrow.
Figure 3.
Figure 3.. Overview of a typical calcium imaging session comparing electrical field evoked responses in CaBLAM and GCaMP8s expressing rat hippocampal neurons.
(A) Representative CaBLAM bioluminescence imaging session. left: Mean z-stacked image of with regions of interest (ROIs) highlighted by colored circles (ROI 1 in light purple, ROI 2 in blue, and ROI 3 in teal). right: Bioluminescent calcium transients from ROIs 1–3 displaying responses evoked by multiple field stimuli (red dashed lines indicate field stimulation events). (B) Representative GCaMP8s fluorescence imaging session. left: Mean z-stacked image with individual ROIs highlighted by colored circles (ROI 1 in dark purple, ROI 2 in orange, ROI 3 in yellow). right: Fluorescence calcium transients from ROIs 1–3 displaying responses evoked by multiple field stimuli (red dashed lines indicate stimulation events). For both a and b, values are in arbitrary units (a.u.) (C) CaBLAM calcium responses to varied field stimuli. top: Individual bioluminescent Δ L/L calcium response traces from ROIs 1–3 for each field stimulus condition. bottom: Mean z-stacked frames (20 frames per condition) for pre-stimulus, 1 field stimulus, 5 field stimuli, and 40 field stimuli conditions, corresponding to data shown in the top panel. (D) GCaMP8s calcium responses to varied field stimuli. top: Individual fluorescence ΔF/F calcium response traces from ROIs 1–3 for each stimulus condition. bottom: Mean z-stacked frames (2 frames per condition) for pre-stimulus, 1 field stimulus, 5 field stimuli, and 40 field stimuli conditions, corresponding to data shown in the top panel. For (C) and (D), arrows indicate field stimulus onset.
Figure 4.
Figure 4.. CaBLAM provides high-contrast reporting of stimulus-evoked neural activity in cultured neurons.
(A) Bioluminescence ΔL/L time-locked traces of CaBLAM calcium responses to 1, 5, 40 pulses of 1ms field stimulations at 83 Hz (red dashed lines indicate field stimulation window). (B) Same as panel (A), but fluorescence ΔF/F time-locked traces for GCaMP8s. For panels (A) and (B), data are shown as mean ± s.e.m. (C) Peak stimulus evoked ΔF/F or ΔL/L across neurons across increasing field stimulations. (D) Cumulative distribution of time to peak ΔF/F or ΔL/L responses. (E) Time to peak ΔF/F or ΔL/L across neurons in response to increasing field stimulations. For panels (C) and (E), boxplots show the median, 25th and 75th percentiles (box edges), whiskers extending to the most extreme data points, and individual outliers plotted separately.
Figure 5.
Figure 5.. Decreasing furimazine (Fz) concentration leads to faster and larger evoked CaBLAM responses to a single electrical field stimulation.
(A) Overlaid bioluminescence ΔL/L time-locked traces of CaBLAM calcium responses to 1, 2, 10, 40, 160 pulses of 1ms field stimulations at 83 Hz, at 1x (1:1) or ½ × (1:2) Fz concentration. Red dashed lines indicate field stimulation window. Data are shown as mean ± s.e.m. (B) Peak stimulus ΔL/L for CaBLAM across neurons elicited across increasing field stimulations in the presence of 1x (1:1) or ½ × (1:2) Fz. (C) Cumulative distribution of time to ΔL/L responses between (includes statistical analysis). (D) Proportion of neurons responding to 1 (left) and 40 (right) electrical field stimulations. For panel (B) and (D), boxplots show the median, 25th and 75th percentiles (box edges), whiskers extending to the most extreme data points, and individual outliers plotted separately.
Figure 6.
Figure 6.. Imaging CaBLAM in vivo.
(A) Illustration of the mouse imaging setup with location of the cranial window and steel headpost. (B) Basic comparison of the CaBLAM and GCaMP6s imaging setups. CaBLAM was imaged in darkness in a light tight enclosure after administration of the luciferin. GCaMP was imaged under epifluorescent illumination. (C) Example mean projection image of one CaBLAM animal. (D) In the same animal as (C), comparison of fluorescence versus bioluminescence in the same field of view. Flourescent and bioluminescent images were acquired on separate days. (E) Example data from one CaBLAM animal. From left to right: Mean projection image with 10 example ROIS plotted, timeseries plots of the same 10 ROIs with black dots indicating the locations of detected events, pseudo color image of detected calcium events across these 10 ROIs (colorbar on the left indicates which ROI each waveform belongs to), and plot of all detected calcium events (gray) and their median value (magenta). (F) Example data from the GCaMP6s mouse, same conventions as in (E). Note the y-axis of the waveforms on the far right is a different scale than the corresponding plot in (E). (G) Normalized median event waveforms for each of the three animals. (H) Peak df/f or dl/l for all events and all animals. Black bars represent the median peak value with whiskers extending to the 25th and 75th percentiles. Peak values that extended beyond 3 times the interquartile range above the median are marked with red circles and plotted at the maximum peak not exceeding this threshold for illustration purposes only. (I) Example CaBLAM animal ROI response to vibrissa tactile stimulation (49 trials), left shows all trials aligned to stimulus onset. Right mean ROI timeseries across stimulus presentations. Opaque bars represent the bootstrapped 95% confidence intervals. (J) Same as in (I) but for the GCaMP6s animal. Note that the scaling is different between (I) and (J).

Similar articles

References

    1. Shen Y., Nasu Y., Shkolnikov I., Kim A. & Campbell R. E. Engineering genetically encoded fluorescent indicators for imaging of neuronal activity: progress and prospects. Neurosci Res 152, 3–14 (2020). - PubMed
    1. Lin M. Z. & Schnitzer M. J. Genetically encoded indicators of neuronal activity. Nat Neurosci 19, 1142–1153 (2016). - PMC - PubMed
    1. Hires S. A., Tian L. & Looger L. L. Reporting neural activity with genetically encoded calcium indicators. Brain Cell Biol 36, 69 (2008). - PMC - PubMed
    1. Dong C. et al. Fluorescence Imaging of Neural Activity, Neurochemical Dynamics, and Drug-Specific Receptor Conformation with Genetically Encoded Sensors. Annu. Rev. Neurosci. 45, 273–294 (2022). - PMC - PubMed
    1. Zhang Y. et al. Fast and sensitive GCaMP calcium indicators for imaging neural populations. Nature 615, 884–891 (2023). - PMC - PubMed

Publication types