[Preprint]. 2023 Jun 29:2023.06.26.546528.
doi: 10.1101/2023.06.26.546528.

Interaction molecular QTL mapping discovers cellular and environmental modifiers of genetic regulatory effects

Affiliations

Interaction molecular QTL mapping discovers cellular and environmental modifiers of genetic regulatory effects

Silva Kasela et al. bioRxiv. .

Update in

Abstract

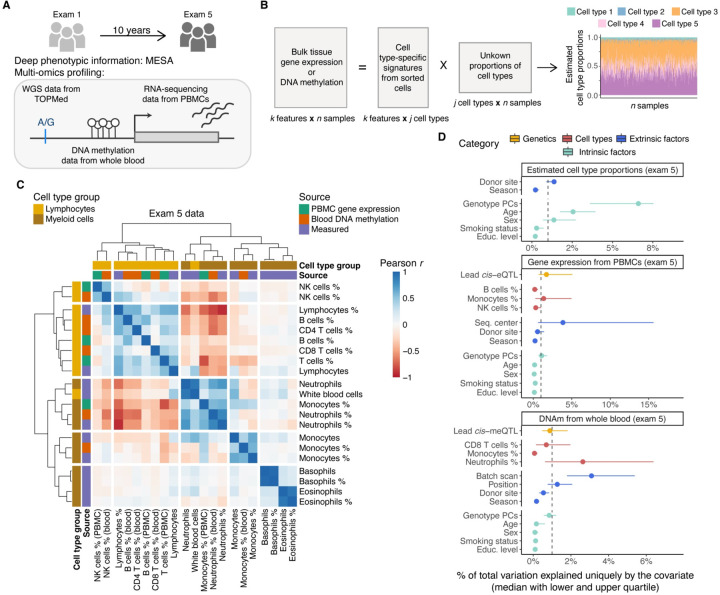
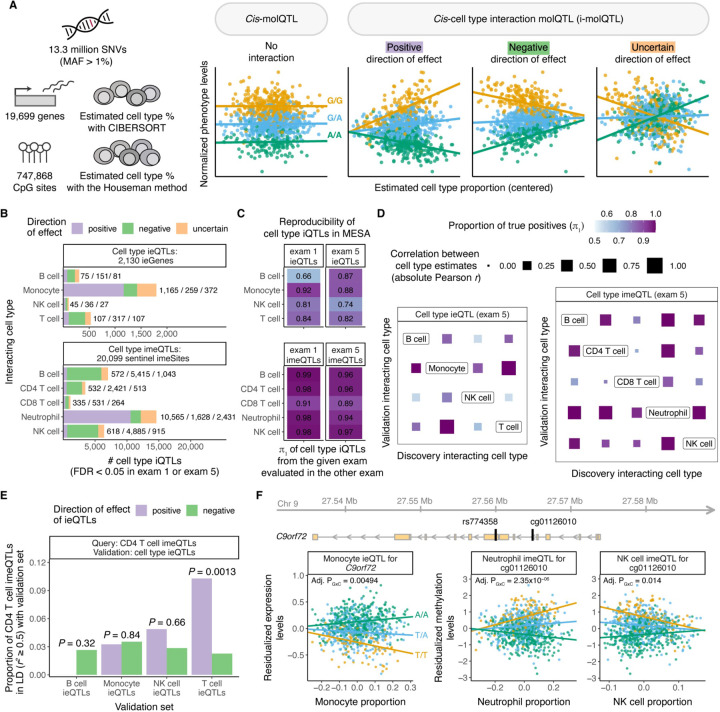
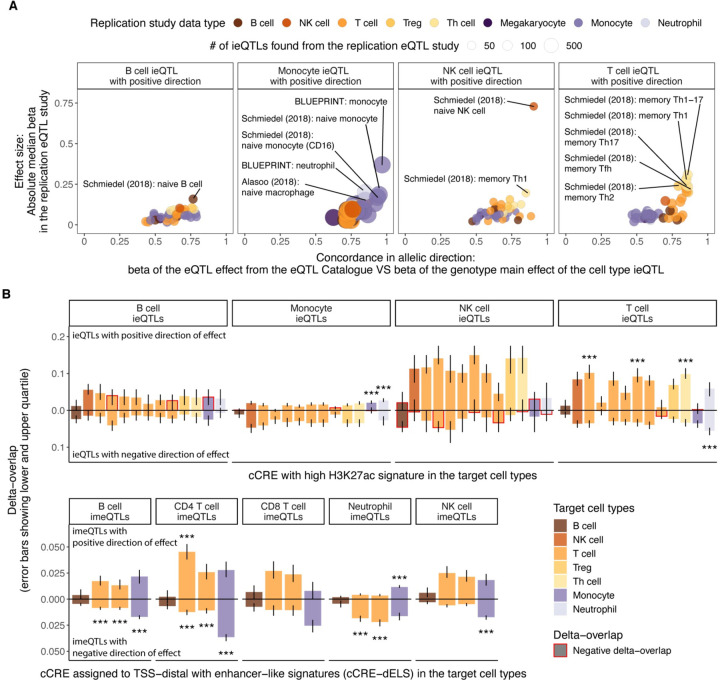
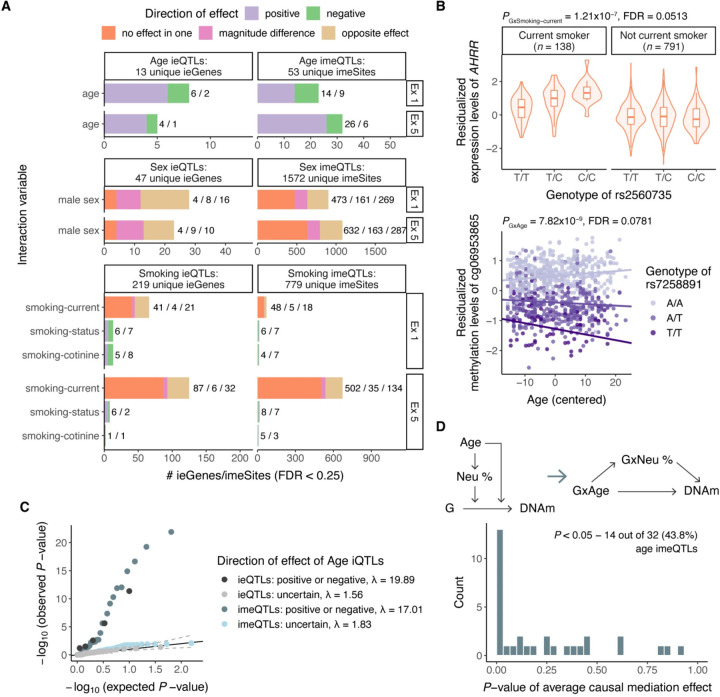
Bulk tissue molecular quantitative trait loci (QTLs) have been the starting point for interpreting disease-associated variants, while context-specific QTLs show particular relevance for disease. Here, we present the results of mapping interaction QTLs (iQTLs) for cell type, age, and other phenotypic variables in multi-omic, longitudinal data from blood of individuals of diverse ancestries. By modeling the interaction between genotype and estimated cell type proportions, we demonstrate that cell type iQTLs could be considered as proxies for cell type-specific QTL effects. The interpretation of age iQTLs, however, warrants caution as the moderation effect of age on the genotype and molecular phenotype association may be mediated by changes in cell type composition. Finally, we show that cell type iQTLs contribute to cell type-specific enrichment of diseases that, in combination with additional functional data, may guide future functional studies. Overall, this study highlights iQTLs to gain insights into the context-specificity of regulatory effects.


Conflict of interest statement

Declaration of interests T.L. advises Variant Bio, Goldfinch Bio, GlaxoSmithKline, and Pfizer and has equity in Variant Bio.

Figures

Figure 1.
Figure 1.. Study design and overview of the estimated cell type proportions.
A) Illustration of the study design and data types profiled for n = 1,319 individuals. B) Graphical illustration of cell type deconvolution. C) Correlation of cell type proportions using exam 5 data from three sources: estimated with the CIBERSORT method from PBMC gene expression, estimated with the Houseman method from whole blood DNA methylation, and cell counts measured by flow cytometry. D) Sources of variability in estimated cell type proportions with CIBERSORT and the Houseman method, gene expression from PBMCs and DNA methylation from whole blood using exam 5 data. Median of the total variation explained is calculated across all the tested cell types, genes, CpG sites, respectively. Gray dashed line denotes 1% of total variance explained.
Figure 2.
Figure 2.. Discovery of cell type ieQTLs and imeQTLs.
A) Illustration of the approach used to map cell type interaction molQTLs in MESA. B) Number of significant cell type ieQTLs and imeQTLs combined across exams (FDR < 0.05 in exam 1 or exam 5 data) stratified by direction of the iQTL effect. C) Reproducibility of cell type iQTLs with positive or negative direction of effect using one of the exams for discovery and the other for validation, and vice versa. The proportion of true positives (𝜋1 statistic) is used as measure of reproducibility. D) Sharing among cell type ieQTLs and cell type imeQTLs with positive or negative direction of effect based on exam 5 data quantified as the proportion of true positives (𝜋1). The size of the square represents the correlation between the two estimated cell type proportions measured using the absolute value of the Pearson correlation coefficient (r). E) Sharing between CD4 T cell imeQTLs (query set) and cell type ieQTLs (validation set) combined across exams, quantified as the proportion of CD4 T cell imeQTLs with positive direction in LD (r2 ≥ 0.5) with ieQTLs from the given validation set by direction of effect. P-value shows the significance of the odds of CD4 T cell imeQTL with positive direction to overlap with a cell type ieQTL with positive direction as compared to the odds of overlapping with a cell type ieQTL with negative direction. F) Example of a cell type iQTL (rs774358) affecting both the expression levels of a gene (C9orf72) and a nearby CpG site (cg01126010).
Figure 3.
Figure 3.. Replication and functional enrichment analysis of cell type iQTLs.
A) Replication of ieQTLs with positive direction of effect in eQTL datasets from purified cell types from the eQTL Catalogue based on effect size in eQTL data and allelic concordance. Highlighted are up to five datasets with absolute median effect size (beta) > 0.15 in the eQTL dataset and proportion of QTLs with the same allelic direction > 0.75 for B cell ieQTLs or > 0.8 for other cell type ieQTLs. Numerical results for all reference cell types are reported in Table S2. B) Functional enrichment analysis with GoShifter showing the delta-overlap, which is the difference between the observed proportion of loci overlapping a cCRE and the null, for cell type ieQTLs (upper panel) overlapping cCRE with high H3K27ac and cell type imeQTLs overlapping cCRE-dELSs. *** - significant association (adjusted P < 0.05) after correcting for the number of target cell types with cCRE data, the number of cell types tested for interaction effect, and the number of groups of direction of effect. Numerical results for all reference cell types are reported in Table S3.
Figure 4.
Figure 4.. Trait iQTLs and mediated moderation.
A) Number of significant trait ieQTLs and imeQTLs in exam 1 and exam 5 (FDR < 0.25) by direction of the iQTL effect. B) Example of smoking-current ieQTL for AHRR (upper plot) and age imeQTL for cg06953865 (lower plot). C) Inflation of GxMonocyte effect among age ieQTLs and GxNeutrophil effect among sentinel age imeQTLs in exam 5 data by direction of age iQTL effect. λ is the inflation factor. D) Schema of the mediated moderation approach, where the moderation effect of age on the genotype to DNAm association is mediated by changes in neutrophil proportions. The mediated moderation effect is described by the GxAge -> GxNeutrophil -> DNAm path. P-value histogram of average causal mediation effect (ACME) of GxNeutrophil meditating the GxAge effect on DNAm for 32 age imeQTLs with positive or negative direction.
Figure 5.
Figure 5.. Cell type interaction QTLs and relevance for diseases.
A) Relevance of cell type ieQTLs (FDR < 0.25) and cell type imeQTLs (FDR < 0.05) for selected cardiometabolic and immune diseases compared to height. For each of the cell type iQTLs, we calculated the odds ratio (OR) as the ratio of the odds for an iQTL to colocalize with cardiometabolic or immune disease to the odds of an iQTL to colocalize with height. For testing the significance of the OR, at least 10 loci tested for colocalization were required, otherwise noted as NA (not available). Bonferroni correction was applied separately for cell type ieQTLs and cell type imeQTLs. NS - not significant. B) Colocalization between GWAS for RA and NK cell ieQTLs for SYNGR1 and imeQTLs for a nearby CpG site cg19713460 shown as regional association plots. The highlighted region is depicted at the top and shows the location of the lead GWAS variant for RA, rs909685, and the CpG site relative to the SYNGR1 gene. C) Association plot for the NK cell ieQTL for SYNGR1 and the NK cell imeQTL for cg19713460. Dots are colored based on the genotype of rs909685. Data in B) and C) are from exam 1, where we observed the lowest interaction P-values.

References

    1. Consortium GTEx. The GTEx Consortium atlas of genetic regulatory effects across human tissues. Science 369, 1318–1330 (2020). - PMC - PubMed
    1. Võsa U. et al. Large-scale cis- and trans-eQTL analyses identify thousands of genetic loci and polygenic scores that regulate blood gene expression. Nat. Genet. 53, 1300–1310 (2021). - PMC - PubMed
    1. Min J. L. et al. Genomic and phenotypic insights from an atlas of genetic effects on DNA methylation. Nat. Genet. 53, 1311–1321 (2021). - PMC - PubMed
    1. Umans B. D., Battle A. & Gilad Y. Where Are the Disease-Associated eQTLs? Trends Genet. TIG 37, 109–124 (2021). - PMC - PubMed
    1. Westra H.-J. et al. Cell Specific eQTL Analysis without Sorting Cells. PLoS Genet. 11, e1005223 (2015). - PMC - PubMed

Publication types

Grants and funding