[Preprint]. 2023 Jun 30:2023.06.27.546808.
doi: 10.1101/2023.06.27.546808.

Dysregulated Pulmonary Inflammatory Responses Exacerbate the Outcome of Secondary Aspergillosis Following Influenza

Affiliations

Dysregulated Pulmonary Inflammatory Responses Exacerbate the Outcome of Secondary Aspergillosis Following Influenza

Chrono K Lee et al. bioRxiv. .

Update in

Abstract

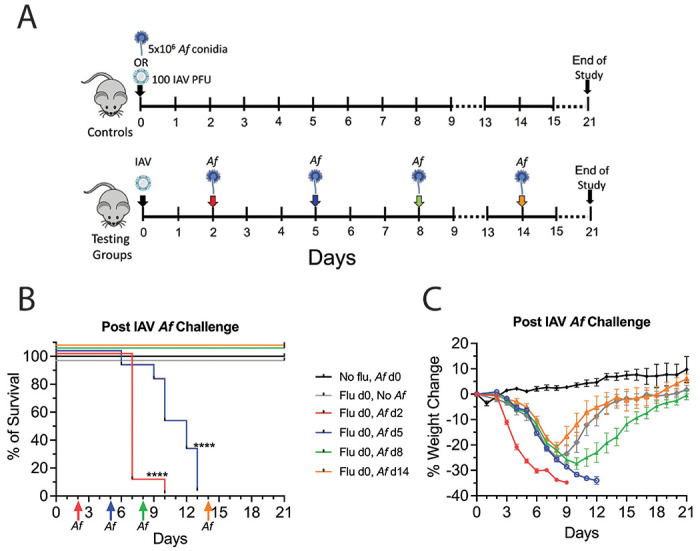
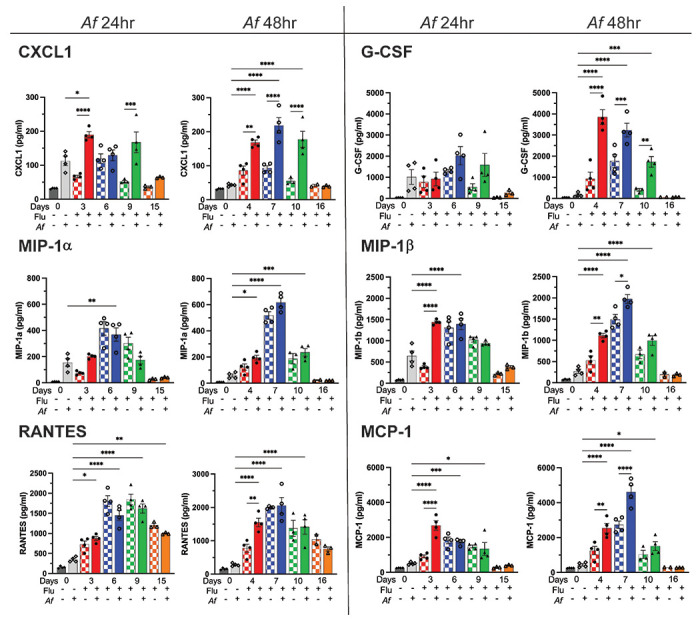
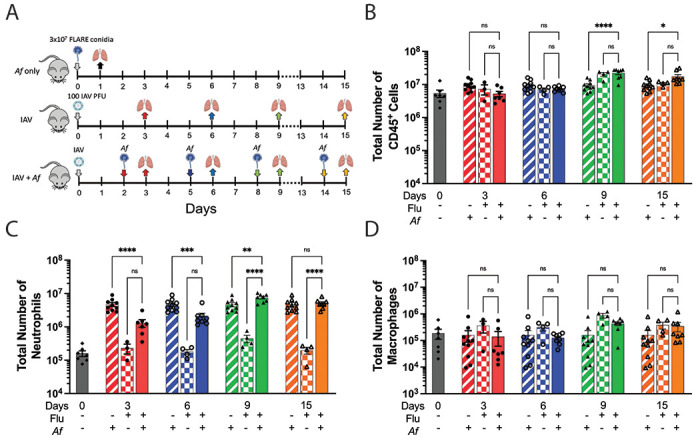
Inhalation of airborne conidia of the ubiquitous fungus Aspergillus fumigatus commonly occurs but invasive aspergillosis is rare except in profoundly immunocompromised persons. Severe influenza predisposes patients to invasive pulmonary aspergillosis by mechanisms that are poorly defined. Using a post-influenza aspergillosis model, we found that superinfected mice had 100% mortality when challenged with A. fumigatus conidia on days 2 and 5 (early stages) of influenza A virus infection but 100% survival when challenged on days 8 and 14 (late stages). Influenza-infected mice superinfected with A. fumigatus had increased levels of the pro-inflammatory cytokines and chemokines IL-6, TNFα, IFNβ, IL-12p70, IL-1α, IL-1β, CXCL1, G-CSF, MIP-1α, MIP-1β, RANTES and MCP-1. Surprisingly, on histopathological analysis, superinfected mice did not have greater lung inflammation compared with mice infected with influenza alone. Mice infected with influenza had dampened neutrophil recruitment to the lungs following subsequent challenge with A. fumigatus , but only if the fungal challenge was executed during the early stages of influenza infection. However, influenza infection did not have a major effect on neutrophil phagocytosis and killing of A. fumigatus conidia. Moreover, minimal germination of conidia was seen on histopathology even in the superinfected mice. Taken together, our data suggest that the high mortality rate seen in mice during the early stages of influenza-associated pulmonary aspergillosis is multifactorial, with a greater contribution from dysregulated inflammation than microbial growth.

Importance: Severe influenza is a risk factor for fatal invasive pulmonary aspergillosis; however, the mechanistic basis for the lethality is unclear. Utilizing an influenza-associated pulmonary aspergillosis (IAPA) model, we found that mice infected with influenza A virus followed by A. fumigatus had 100% mortality when superinfected during the early stages of influenza but survived at later stages. While superinfected mice had dysregulated pulmonary inflammatory responses compared to controls, they had neither increased inflammation nor extensive fungal growth. Although influenza-infected mice had dampened neutrophil recruitment to the lungs following subsequent challenge with A. fumigatus , influenza did not affect the ability of neutrophils to clear the fungi. Our data suggest that the lethality seen in our model IAPA is multifactorial with dysregulated inflammation being a greater contributor than uncontrollable microbial growth. If confirmed in humans, our findings provide a rationale for clinical studies of adjuvant anti-inflammatory agents in the treatment of IAPA.


Figures

Figure 1.
Figure 1.. Titration experiments to optimize influenza A virus (IAV) and Aspergillus fumigatus (Af) infectious inocula.
IAV model: Mice were infected with IAV at a range of 5 to 2500 PFU/mouse (C57BL/6) via the I.N. route and monitored daily for survival (A) and body weight change (B). A. fumigatus model: Mice were challenged with either 5x10⁶ or 1x10⁷ A. fumigatus CEA10 conidia via O.T. route and monitored for survival (C) and body weight change (D). Data represents ≥ experiments: for IAV model N≥4 mice/group and for A. fumigatus model N=2 mice/group. The inocula used for subsequent experiments are indicated by a solid black line and # symbol. Statistical analysis of the weight change curves is shown in Supplementary Table 1.
Figure 2.
Figure 2.. Experimental design for the superinfection model.
Mice were first infected with IAV and subsequently challenged with A. fumigatus. (A) Schematic description of the experimental design. Mice that were singly challenged with 5x10⁶ A. fumigatus CEA10 conidia (O.T.) and singly infected with IAV at 100 PFU/mouse (I.N.) were used as control groups for the experiments. For our superinfection model, mice were infected with IAV on day 0 and were then challenged with A. fumigatus CEA10 conidia at 2-, 5-, 8-, and 14-days post IAV infection (dpii). After the mice were infected, their survival (B) and body weight changes (C) were monitored daily for 21 days post-IAV infection. Data were combined from two experiments with N=5 for each experiment except for the single IAV infected control, which was one experiment with N=5. Data in (C) are means ± SEM. **** P<0.0001 compared with mice infected with only IAV or A. fumigatus using the Mantel-Cox test. Statistical analysis of the weight change curves is shown in Supplementary Table 1.
Figure 3.
Figure 3.. Lung pro-inflammatory cytokine concentrations following IAV and A. fumigatus single infections and superinfection.
(A) Schematic description of the model. Mice were infected with IAV at 100 PFU/mouse (I.N.) on day 0. The mice were subsequently challenged with 5x10⁶ A. fumigatus CEA10 conidia (O.T.) at 2-, 5-, 8-, and 14-dpii. Controls included mice that were uninfected (not shown on the schematic), infected with IAV only, and challenged with A. fumigatus only. Lung samples were collected at 24 and 48hr post A. fumigatus challenge. Lung samples for control mice singly infected with IAV were collected at the same time points as for the superinfected mice. (B) Cytokine and chemokine levels, as determined by multiplex assay or ELISA on lung homogenates. There were 4 mice per group, except for 14-dpii groups, which had 3 mice per group. Each symbol represents an individual mouse. Data are combined from two independent experiments and expressed as means ± SEM. * P<0.05, ** P<0.005, *** P<0.0005, and **** P<0.0001 by two-way ANOVA with Tukey’s multiple comparison test. Additional cytokines and chemokines are shown in Figure S1 and Figure 4.
Figure 4.
Figure 4.. Lung chemokine and growth factor concentrations following IAV and A. fumigatus single infections and superinfection.
See the Figure 3 legend for details. * P<0.05, ** P<0.005, *** P<0.0005, and **** P<0.0001 by two-way ANOVA with Tukey’s multiple comparison test.
Figure 5.
Figure 5.. Lung pathology following IAV and A. fumigatus single infections and superinfection.
Mice were infected with IAV and then challenged with A. fumigatus as described in Figure 3A, except lungs were harvested at 24, 72 and 120hr after A. fumigatus challenge. Uninfected, A. fumigatus challenged only, and IAV infected only were used as controls and collected at the same time points as the superinfected mice. Cyclophosphamide (CP) treated mice infected with A. fumigatus served as a positive control for invasive aspergillosis. The data are combined from 5 independent experiments at different time points and each symbol represents an individual mouse. (A) Percentage of inflammation seen on H&E sections of lungs, as determined by a pathologist blinded to the experimental condition. Representative histology of H&E stained at 200X magnification (B) and GMS stained at 20X original magnification (C) of lung samples at 120hr after A. fumigatus challenge. Scale bars are 50 microns for (B) and 100 microns for (C). Red arrows point to conidia or hyphae in the GMS-stained lung samples.
Figure 6.
Figure 6.. Viral and fungal load in the lungs as determined by RT-qPCR analysis and CFU plating.
Mice were infected I.N. with 100 PFU IAV/mouse. At either 2-dpii (red) or 14-dpii (orange), mice were then challenged O.T. with 5x10⁶ A. fumigatus CEA10 conidia. Lung samples were collected at 24, 48, and 120hr after A. fumigatus challenge. Uninfected, single IAV infected, and single A. fumigatus challenged mice were used as controls. Lung samples from the control mice were collected at the respective time point of the superinfected mice. There are 5 mice per group. The data shown are the combination of 4 independent experiments at different time points and expressed as means ± SEM and each symbol represents an individual mouse. Top portion: Mice were challenged with A. fumigatus at 2-dpii; the relative expression of influenza (A), A. fumigatus conidial equivalent (B), and A. fumigatus CFU counts (C) were measured by RT-qPCR or CFU plating. Bottom portion: Mice were challenged with A. fumigatus at 14-dpii and the relative expression of influenza (D), A. fumigatus conidia equivalent (E), and A. fumigatus CFU counts (F) were also measured by RT-qPCR or CFU plating. Dotted line represents the lower limit of detection (LLD) of the assay. Individual data points, means, and SEM are shown; numbers at or below the LLD were assigned the value of the LLD. Statistics were calculated using the Mann-Whitney (nonparametric) t test with Bonferroni’s correction for multiple comparisons. * P<0.05, ** P<0.005, *** P<0.0005, and **** P<0.0001.
Figure 7.
Figure 7.. Flow cytometric analysis of leukocyte populations in lung samples from mice following IAV and A. fumigatus single infections and superinfection
(A) Schematic description of the experiment. Uninfected mice, singly A. fumigatus (Af) FLARE conidia challenged mice, and singly IAV infected mice were used as controls. Mice were infected I.N. with 100 PFU IAV followed by 3x10⁷ FLARE conidia O.T. challenge at 2-, 5-, 8-, and 14-dpii. Lung samples were collected at 24hr post FLARE conidia challenge. For the control mice, lung samples were collected at the respective time points of the superinfected mice. Supplementary Figure S4 shows the gating strategy. (B, C, and D) Number of leukocytes (CD45+), neutrophils (CD45+, CD11b+, Ly6C+, Ly6G+, F4/80), and macrophages (CD45+, CD11b+, Ly6G, Ly6C+/−, F4/80+), respectively, in the lungs as a function of type of infection and time after infection. The data shown are the combination of ≥5 independent experiments at different time points and each symbol represents an individual mouse. * P<0.05, ** P<0.005, *** P<0.0005, and **** P<0.0001 by two-way ANOVA with Tukey’s multiple comparison test, ns, not significant.
Figure 8.
Figure 8.. Phagocytosis and killing of A. fumigatus FLARE conidia by neutrophils.
Mice were infected with FLARE conidia at 2, 5, 8, and 14 dpii, as described in Figure 7A. Lungs were harvested at 24hr, single cell suspensions were made, and the neutrophils analyzed by flow cytometry for the presence of live and dead FLARE conidia according to the schematic in Figure S4. A control group of mice was challenged with FLARE conidia alone (no IAV). (A) and (B) The percentage of neutrophils containing conidia and the total number of neutrophils with conidia, respectively. (C) and (D) Percentage of neutrophils and total number of neutrophils containing only dead conidia, respectively. ** P<0.005, *** P<0.0005, and **** P<0.0001 by one way ANOVA comparing the superinfected groups with the mice singly challenged with A. fumigatus, ns, not significant. Data are the combination of ≥5 independent experiments at different time points and each symbol represents an individual mouse.

Similar articles

References

    1. Latge JP, Chamilos G. 2019. Aspergillus fumigatus and Aspergillosis in 2019. Clin Microbiol Rev 33:e00140–18. - PMC - PubMed
    1. Dagenais TR, Keller NP. 2009. Pathogenesis of Aspergillus fumigatus in Invasive Aspergillosis. Clin Microbiol Rev 22:447–65. - PMC - PubMed
    1. Park SJ, Mehrad B. 2009. Innate immunity to Aspergillus species. Clin Microbiol Rev 22:535–51. - PMC - PubMed
    1. Bongomin F, Gago S, Oladele RO, Denning DW. 2017. Global and Multi-National Prevalence of Fungal Diseases—Estimate Precision. Journal of Fungi 3:57. - PMC - PubMed
    1. Brown GD, Denning DW, Gow NA, Levitz SM, Netea MG, White TC. 2012. Hidden killers: human fungal infections. Sci Transl Med 4:165rv13. - PubMed

Publication types