[Preprint]. 2023 Jun 30:2023.06.28.546944.
doi: 10.1101/2023.06.28.546944.

Reprogramming human B cells with custom heavy chain antibodies

Affiliations

Reprogramming human B cells with custom heavy chain antibodies

Geoffrey L Rogers et al. bioRxiv. .

Update in

Abstract

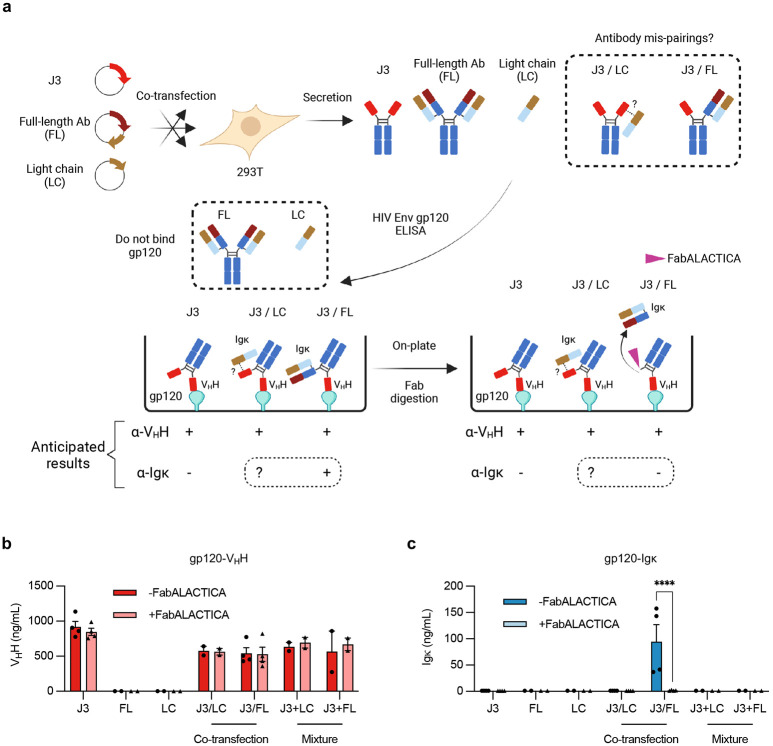
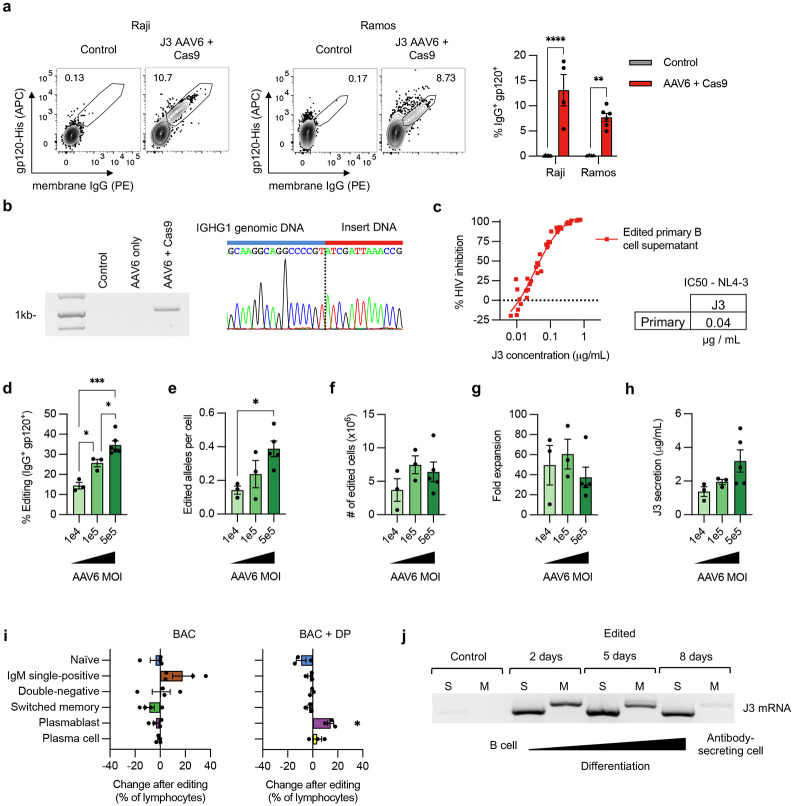
We describe a genome editing strategy to reprogram the immunoglobulin heavy chain (IgH) locus of human B cells to express custom molecules that respond to immunization. These heavy chain antibodies (HCAbs) comprise a custom antigen-recognition domain linked to an Fc domain derived from the IgH locus and can be differentially spliced to express either B cell receptor (BCR) or secreted antibody isoforms. The HCAb editing platform is highly flexible, supporting antigen-binding domains based on both antibody and non-antibody components, and also allowing alterations in the Fc domain. Using HIV Env protein as a model antigen, we show that B cells edited to express anti-Env HCAbs support the regulated expression of both BCRs and antibodies, and respond to Env antigen in a tonsil organoid model of immunization. In this way, human B cells can be reprogrammed to produce customized therapeutic molecules with the potential for in vivo amplification.


Figures

Extended Data Figure 1.
Extended Data Figure 1.. Extended analyses of genome editing at the constant region of the IgH locus.
(a) K562 cells were electroporated with Cas9 RNPs containing indicated gRNAs and matched ssODN homology donors to insert an XhoI restriction site (n = 3). HDR editing was measured by Sanger sequencing and ICE analysis. (b) K562 cells were electroporated with Cas9 RNPs for indicated gRNAs and a matched plasmid homology donor containing a GFP expression cassette (n = 3). HDR editing was measured by flow cytometry for GFP expression after 3 weeks. (c) Site-specific insertion of GFP expression cassettes in AAV6-edited K562 cells was confirmed by in-out PCR for each tested gRNA. Uncropped gel is available in Supplementary Fig. 3a. (d) On- and off-target activity of sg05 was measured at indicated IGHG genes in primary human B cells, 5 days after editing, by targeted amplicon deep sequencing. Aggregate mutations at each base in a 50bp window surrounding the sg05 cut site (0; orange dotted line) are shown for each gene. (e) Percentage mutated reads at each IGHG gene calculated as for all changes (≥ 1 bp changed), which gives a higher background than when a cutoff of ≥ 2 bp is selected, as shown in Fig. 1d (n = 2). Error bars show mean ± SEM. Statistics were calculated by 2-way ANOVA. * p < 0.05, *** p < 0.001, **** p < 0.0001, ns = not significant.
Extended Data Figure 2.
Extended Data Figure 2.. Extended analyses of engineered B cell lines expressing anti-HIV HCAbs.
(a) Raji B cells were edited with sg05 Cas9 RNPs plus a plasmid homology donor to insert a GFP expression cassette and editing rates were measured by flow cytometry. (b) Ramos B cells were edited with sg05 Cas9 RNPs and plasmid homology donors for J3, A6 or a control GFP expression cassette. Editing rates were determined by flow cytometry. (c-d) Raji (c) and Ramos (d) cells edited by sg05 Cas9 RNPs and J3, A6, or GFP plasmid homology donors, post sorting by FACS. (e) GFP-edited Raji cells were sorted by FACS for GFP expression, and the enriched population was subjected to in-out PCR and Sanger sequencing of PCR bands to confirm precise insertion. The dotted line indicates the predicted sg05 cut site. Uncropped gel is available in Supplementary Fig. 3b. (f) Secretion of HCAbs was detected by total IgG ELISA from J3 or A6-edited Raji and Ramos cells, but not from GFP-edited control cells.
Extended Data Figure 3.
Extended Data Figure 3.. Lack of pairing between HCAb and co-expressed light chain.
(a) Assay schematic. 293T cells were transfected with expression plasmids for the J3 VHH HCAb, a full-length (FL) conventional human IgG1 derived from Ofatumumab, or its Igκ L chain only (LC), or combinations as indicated. Supernatants, including mixed supernatants as controls, were evaluated by ELISAs based on HIV gp120 binding by the J3 VHH and detection with an anti-VHH antibody (control), or anti-Igκ L chain antibodies to detect pairings between the J3 HCAb and either the FL or LC components. FabALACTICA digestion is expected to cleave FL antibodies into Fab and Fc fragments and may also cleave HCAbs. (b-c) Results of gp120-VHH (b) and gp120-Igκ (c) ELISAs, with or without FabALACTICA digestion (n = 2-4). Cross-pairing was only observed after co-transfection of J3 HCAb and FL antibody, consistent with H chain interactions that were released by FabALACTICA digestion. In contrast, the L chain alone did not pair with the J3 HCAb. Error bars show mean ± SEM. Statistics were performed using 2-way ANOVA. **** p < 0.0001.
Extended Data Figure 4.
Extended Data Figure 4.. Lack of somatic hypermutation in inserted A6 VHH and GFP sequences.
(a) Absorbance curve for J3 avidity over time from J3-edited Raji cells in extended culture (n = 3). IgG produced by the cells at indicated time points was measured by gp120-IgG ELISA. (b) Changes at A6 or GFP sequence in edited Raji cells over time, measured by deep sequencing. Percentage mutation at each position is the frequency of reads that did not match the wild-type sequence. CDR regions in A6 are indicated in grey. (c) Total mutations in A6 or GFP sequences at each timepoint were summed and divided by the total sequence length to determine a total % mutations. Shown in green are mutations associated with AID hotspot motif cytosines (WRCH). (d) The density of AID hotspots (number of WRCH hotspots / number of base pairs in the sequence) for each indicated sequence. (e) The distribution of AID hotspots across framework regions (FR) and complementarity-determining regions (CDR) for J3 and A6. Error bars show mean ± SEM.
Extended Data Figure 5.
Extended Data Figure 5.. Comparison of culture conditions for primary human B cells.
Primary human B cells from n = 3-4 independent experiments were cultured with the indicated stimulation conditions (DP, BAC, RP105) and basal media (IMDM, XF, XF plus FBS) as shown in Supplementary Fig. 4. Cultures were pre-activated for 3 days before measurements were started on day 0. (a) Fold-expansion of cells over time. (b) Viability of cells over time. (c) Cell size, measured by flow cytometry as forward scatter (FSC) median fluorescence intensity (MFI) on day 0. (d) Total IgG secreted into supernatants was measured over time by ELISA. (e) Total IgG amounts normalized for viable cell counts. (f) B cell phenotypes were assessed at day 8 in indicated cultures by flow cytometry, as shown in Supplementary Fig. 5. For BAC+DP, the cells were started in BAC and treated for a total of 5 days, then switched to the DP protocol for the remaining 6 days, as shown in Supplementary Fig. 4. (g) Comparison of total IgG secretion and IgG/cell at day 8 for cells treated with indicated stimulation protocols. DP was in IMDM, BAC and BAC + DP were in XF without FBS. Error bars show mean ± SEM. Statistics in panels (c,g) were calculated by one-way ANOVA. * p < 0.05, ns = not significant.
Extended Figure 6.
Extended Figure 6.. Extended analyses of engineering with AAV6 homology donors.
(a) Editing rates achieved using sg05 Cas9 RNPs and AAV6-J3 homology donors on Raji and Ramos B cell lines. Representative plots are shown, together with summary data for n = 4-6 replicates. (b) Site-specific insertion of the J3 cassette in primary B cells treated with sg05 RNPs and AAV6-J3 donor was confirmed by in-out PCR followed by Sanger sequencing of the band. The dotted line shows the presumed sg05 cleavage site. Uncropped gel image is provided in Supplementary Fig. 3c. (c) Neutralization of HIV-1 NL4-3, measured by TZM-bl assay, by supernatants of AAV6-J3-edited primary B cells (n = 6). (d-h) Primary human B cells from n = 3-5 donors were edited with sg05 Cas9 RNPs and AAV6-J3 at the indicated MOIs, with BAC activation in XF media. Data from the highest MOI is reproduced here from Fig. 4, for comparison. (d) Editing rates, measured at day 8 by flow cytometry for surface J3-BCR. (e) Editing quantified by in-out ddPCR at day 8 and normalized per cell against a control reaction. (f) The yield of edited cells at day 8 was calculated from 5 x 10⁵ starting B cells. (g) Fold expansion of total cells at day 8. (h) J3 HCAb secretion, measured by gp120-IgG ELISA at day 8. (i) B cell phenotypes of edited cells in BAC (left) or with differentiation (BAC + DP, right) were measured by flow cytometry. Unedited matched control cells were also quantified and subtracted from the frequencies in the edited cells, to highlight any changes in differentiation after editing. (j) Edited primary B cells were differentiated in DP plus IMDM media and RNA extracted at indicated time points. RT-PCR was performed using a J3-specific forward primer and IgG reverse primers specific for the secreted (S) or membrane (M) isoforms. Uncropped gel image is provided in Supplementary Fig. 3d. Error bars show mean ± SEM. Statistics were calculated by 2-way ANVOA (a), 1-way ANOVA (d-h), or 1-sample t-test (i). * p < 0.05, ** p < 0.01, *** p < 0.001, **** p < 0.0001.
Figure 1.
Figure 1.. Genome editing at the constant region of the IgH locus.
(a) Antibody H chains are encoded by a rearranged variable domain (VH), spliced to a constant region that can be altered by class switch recombination. Alternate splicing within the constant region generates secreted antibody or membrane anchored (BCR) isoforms. Genome editing to insert custom antigen recognition domains (ARD) downstream of CH1 exons in the IgH constant regions can create Heavy chain only antibodies (HCAbs). The example shown is targeting human IgG1, with the expanded view showing the constant region exons. Genome editing is directed by homology donors containing 500-750 bp homology arms, flanking CRISPR/Cas9 target sites in the intron downstream of CH1. Homology directed repair of the targeted DNA break inserts a cassette comprising a B cell-specific promoter, a custom ARD, and a splice donor to direct splicing to downstream endogenous exons. (b) K562 cells were edited with Cas9 RNPs programmed by gRNAs targeting the IgG1 CH1 intron and indels measured at on-target (IGHG1) and off target (IGHG2-P) genes by Sanger sequencing and ICE (n = 3). (c) K562 cells were edited by Cas9 RNPs plus AAV6 homology donors containing a GFP expression cassette, matched for each gRNA. GFP expression was measured after 3 weeks, to dilute out episomal AAV genomes (n = 3). (d) On- and off-target activity of sg05 was measured at indicated IGHG genes in primary human B cells (n = 2), 5 days after editing with sg05 RNPs, by targeted amplicon deep sequencing, with percentage mutated reads calculated as insertions, deletions, ≥ 2 bp changed. See also Extended Data Fig. 1d,e. Error bars show mean ± SEM. Statistical comparisons (c-d) were performed by 2-way ANOVA. * p < 0.05, ** p < 0.01, *** p < 0.001, **** p < 0.0001.
Figure 2.
Figure 2.. Engineering B cell lines to express anti-HIV HCAbs.
(a) Raji B cells were edited with sg05 Cas9 RNPs plus plasmid homology donors encoding J3 (n = 3) or A6 (n = 1-2) VHH cassettes. Surface expression of resulting HCAb BCRs was measured 1 week later by flow cytometry, staining for surface IgG expression and gp120 binding. Representative plots are shown, together with summary data. (b) J3 or A6 edited Raji cells were FACS-sorted based on surface IgG (see Extended Data Fig. 2c), and the enriched population was subjected to in-out PCR and Sanger sequencing of PCR bands to confirm precise insertions. The dotted line indicates the predicted sg05 cut site. Uncropped gel is available in Supplementary Fig. 3b. (c) Sorted J3- or A6-edited Raji cells were seeded at 106 cells/mL and IgG secretion measured 2 days later by ELISA (n = 3). (d) J3 or A6 HCAbs (n = 3 technical replicates) from supernatants of sorted populations of edited Raji and Ramos cells were analyzed for anti-HIV neutralization activity against X4-tropic HIV strain NL4-3 using the TZM-bl assay. Control recombinant HCAb supernatants were obtained from transfected 293T cells. Neutralization curves are shown for serial dilutions of each HCAb and IC50s were calculated from the curves. (e) Anti-HIV neutralization activity determined as in (d), against R5-tropic HIV strain JR-CSF. Error bars show mean ± SEM. Statistics in panel (a) were performed by 2-way ANOVA. ** p < 0.01, **** p < 0.0001.
Figure 3.
Figure 3.. Evidence for somatic hypermutation of inserted J3 VHH sequences.
(a-d) FACS-sorted J3-edited Raji cells were cultured for 6 months without further selection. (a) J3-BCR expression by flow cytometry at indicated times, gated on IgG+ cells. (b) Cells from each time point were seeded at 106 cells/mL for 2 days and IgG secretion measured by ELISA, normalized for number of cells seeded. (c) Supernatants were assessed for gp120 binding by ELISA, across a range of normalized IgG concentrations. Absorbances across the curve were summed as a surrogate for area under the curve. See also Extended Data Fig. 4a. (d) Changes at J3 sequence in edited cells over time, measured by deep sequencing and compared to input homology donor plasmid. Percentage mutation at each position was calculated as the frequency of reads that did not match the wild-type sequence. CDR regions are indicated in gray. (e) Mutations identified by deep sequencing of J3-edited cells at each timepoint were summed and divided by the total sequence length to determine total % mutations. Shown in green are mutations associated with AID hotspot motif cytosines (WRCH). (f) Sequence logo plot of the CDR3 region of J3 at each time point. Arrows indicate AID hotspot cytosines, on either strand. Error bars show mean ± SEM. Statistics in panel (b-c) were performed by 1-way ANOVA.
Figure 4.
Figure 4.. Engineering primary human B cells.
Primary human B cells from n = 3-6 independent experiments were activated with BAC in XF media, starting at day −3, and edited at day 0 with sg05 Cas9 RNPs and an AAV6-J3 homology donor (MOI = 5 x 10⁵ vg/cell). (a-b) Editing rates were measured at day 8 by flow cytometry for surface J3-BCR. (c) Editing was quantified by in-out ddPCR at day 8 and normalized per cell against a control reaction. (d) The yield of edited cells at day 8 was calculated from 5 x 10⁵ starting B cells. (e) J3 HCAb secretion was measured by gp120-IgG ELISA at day 8. (f-h) Edited B cells in BAC culture were differentiated by switching to the DP protocol on day 2 post-editing and cultured for a further 6 days. Undifferentiated populations were maintained in BAC until day 8. (f) B cell phenotypes, measured on day 8 by flow cytometry, as described in Supplementary Fig. 5. (g-i) Expression of total IgG-BCR (control, unedited samples) and J3-BCR (edited samples) was measured by flow cytometry at day 8 for cells without or with differentiation (n = 3). The intensity of membrane IgG expression was evaluated for IgG+ control B cells and J3+ edited B cells. Shown are representative plots (g) and summary graphs of IgG- or J3-BCR positivity (h) and expression levels (i) after differentiation, normalized to paired undifferentiated samples. Data for edited (J3) but undifferentiated cells in panel (h) is a subset of the data in panel (b). (j) Scatter plot comparing the rate of total IgG secretion from control unedited samples versus J3 HCAb secretion from edited samples. Each point represents measurements from paired samples from the same experiment. Samples were collected at several time points after editing, and differentiated samples are also identified. The Pearson correlation is indicated. Error bars show mean ± SEM. Statistics were calculated by 1-way ANOVA (b), 2-tailed t-test (c,e), 1-sample t-test (d), or 2-way ANOVA (h-i). * p < 0.05, *** p < 0.001, **** p < 0.0001.
Figure 5.
Figure 5.. Antigen-specific expansion of HCAb-engineered B cells.
(a) Diagram of tonsil organoid system. (b) Representative plots of control or J3-edited tonsil B cells, treated with RNPs plus AAV6-J3 at MOI = 5 x 10⁵ vg/cell. (c-e) Tonsil B cells from n = 3-5 donors were edited with RNPs plus AAV6-J3 at MOI = 1-5 x 10⁵ vg/cell, cultured for 2-4 days, and reconstituted with total autologous TMNCs. Cultures were immunized with HIV gp120 plus Adju-Phos or control PE protein plus Alhydrogel and cells were harvested 12 days later for analyses. (c) Representative panel showing increase in gp120+ VHH+ cells after immunization with gp120 but not PE, measured by flow cytometry, gated on CD19+ CD3 B cells as described in Supplementary Fig. 8. (d) Response of tonsil organoid cultures containing control or edited B cells to gp120 or PE immunization. Matching colors indicate samples from the same tonsil donor. (e) Phenotypes of B cells in tonsil organoids containing control or J3-edited B cells were characterized at day 12 by flow cytometry, with or without gp120 immunization, using the gating strategy described in Supplementary Fig. 8. Error bars show mean ± SEM. Statistics in panel (d-e) were calculated by 1-way ANOVA. * p < 0.05, ** p < 0.01.
Figure 6.
Figure 6.. Editing with alternative HCAb structures and modified Fc domains.
(a-f) Primary human B cells from n = 3 independent experiments were activated with BAC in XF media, starting at day −3, and edited at day 0 with sg05 Cas9 RNPs and AAV6-CD4 donors (a-c, MOI = 5 x 10⁵ vg/cell) or AAV6-PGT121-scFv donors (d-f, MOI = 5 x 10⁵ vg/cell). (a,d) Editing rates were measured at day 8 by flow cytometry for surface J3-BCR. (b,e) Editing was quantified by in-out ddPCR at day 8 and normalized per cell against a control reaction. (c,f) HCAb secretion was measured by gp120-IgG ELISA at day 8. (g) Design of CH2 editing approach. Cas9 gRNA CH2-g1 targets the intron downstream of CH2. Homology donor cassette contains B cell specific promoter, antigen recognition domain (ARD), codon-wobbled IgG1 Hinge (Hi) and CH2 exons, and splice donor to link to endogenous CH3 and membrane exons after insertion. (h-i) Primary human B cells from n = 3-4 independent experiments were activated with BAC in XF media, starting at day −3, and edited at day 0 with CH2-g1 Cas9 RNPs and AAV6-J3-CH2* donor (MOI = 104 vg/cell). (h) Editing rates were measured at day 8 by flow cytometry for surface J3-BCR. (i) J3 HCAb secretion was measured by gp120-IgG ELISA at day 8. Error bars show mean ± SEM. Statistics were calculated by 2-tailed t-test. * p < 0.05, ** p < 0.01, *** p < 0.001.

References

    1. Qerqez A.N., Silva R.P. & Maynard J.A. Outsmarting Pathogens with Antibody Engineering. Annu Rev Chem Biomol Eng 14, 217–241 (2023). - PMC - PubMed
    1. Carter P.J. & Rajpal A. Designing antibodies as therapeutics. Cell 185, 2789–2805 (2022). - PubMed
    1. Page A., Fusil F. & Cosset F.L. Towards Physiologically and Tightly Regulated Vectored Antibody Therapies. Cancers (Basel) 12 (2020). - PMC - PubMed
    1. Zhan W., Muhuri M., Tai P.W.L. & Gao G. Vectored Immunotherapeutics for Infectious Diseases: Can rAAVs Be The Game Changers for Fighting Transmissible Pathogens? Front Immunol 12, 673699 (2021). - PMC - PubMed
    1. Martinez-Navio J.M. et al. Long-Term Delivery of an Anti-SIV Monoclonal Antibody With AAV. Front Immunol 11, 449 (2020). - PMC - PubMed

Publication types