[Preprint]. 2024 May 30:2023.06.30.547194.
doi: 10.1101/2023.06.30.547194.

In vivo magnetic recording of single-neuron action potentials Abbreviated title: In vivo magnetic single-neuron action potentials

Affiliations

In vivo magnetic recording of single-neuron action potentials Abbreviated title: In vivo magnetic single-neuron action potentials

Frederike J Klein et al. bioRxiv. .

Abstract

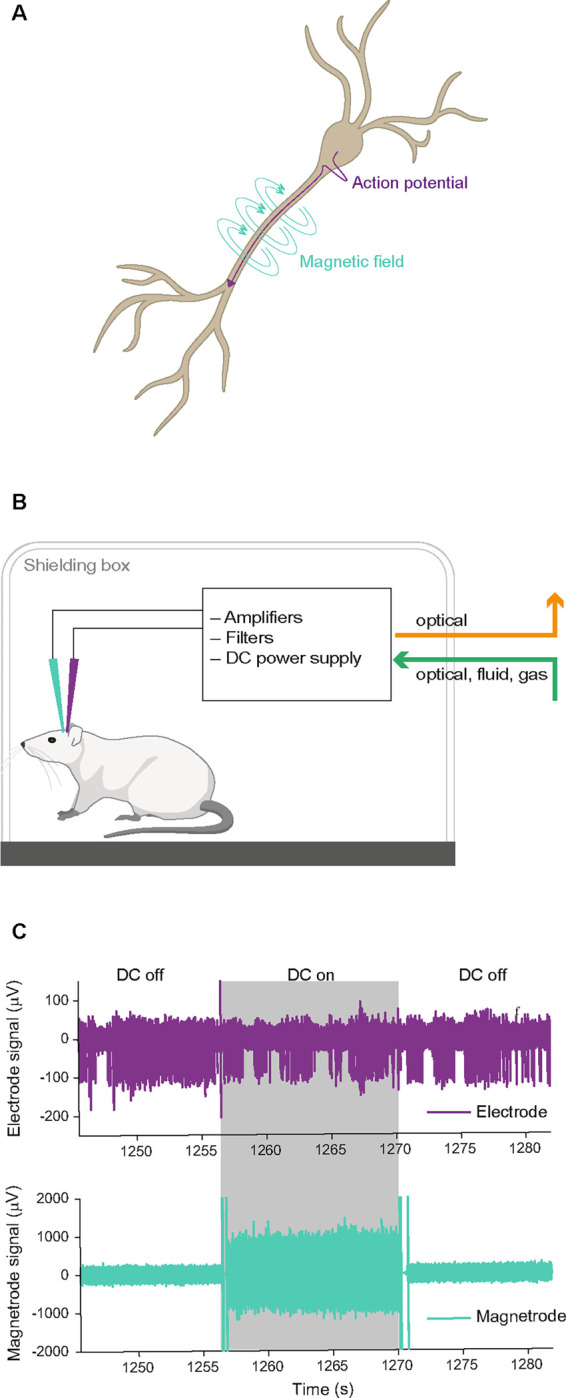
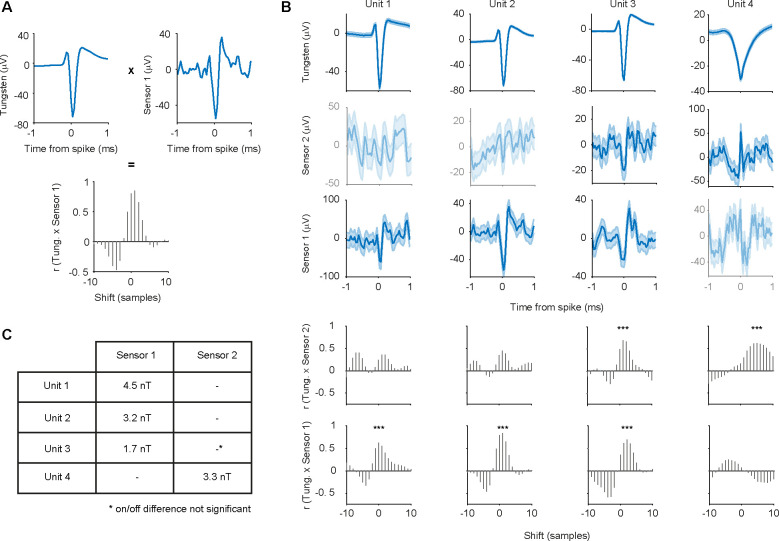
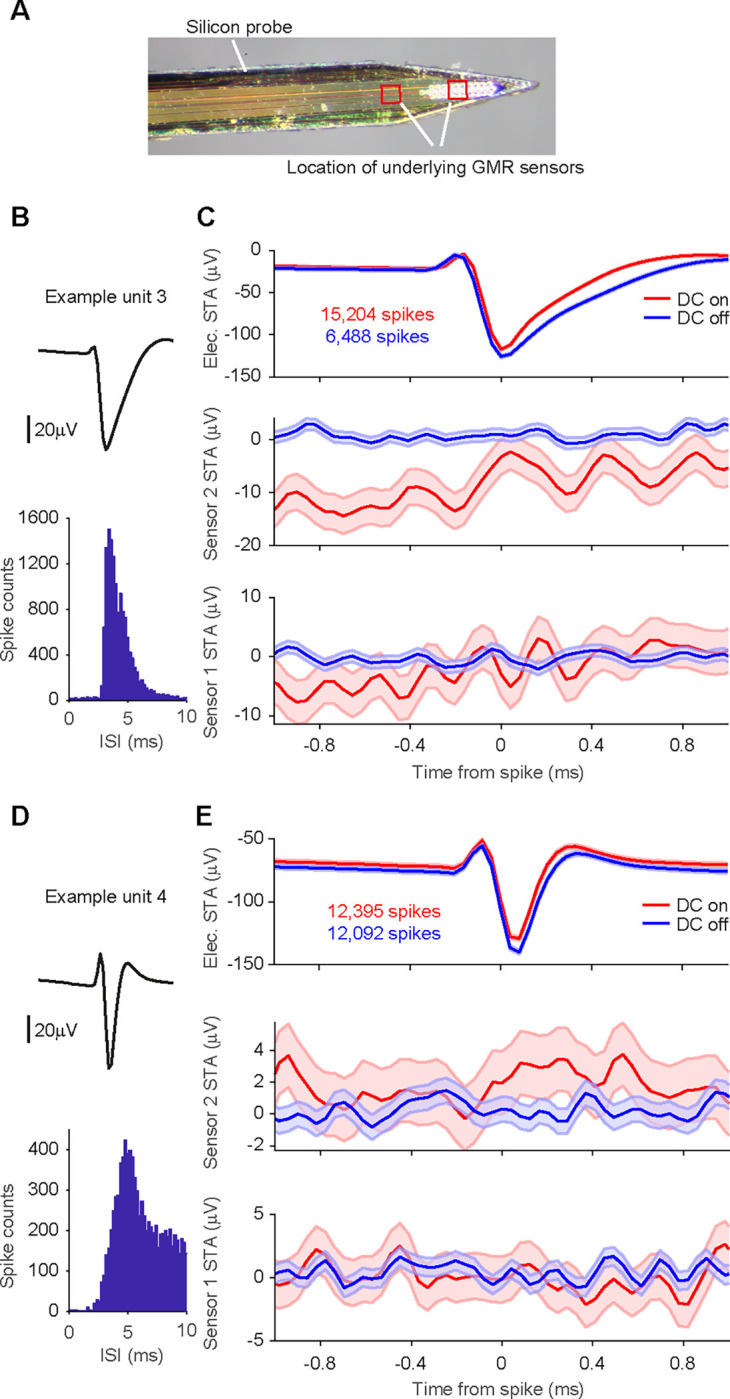
Measuring fast neuronal signals is the domain of electrophysiology and magnetophysiology. While electrophysiology is easier to perform, magnetophysiology avoids tissue-based distortions and measures a signal with directional information. At the macroscale, magnetoencephalography (MEG) is established, and at the mesoscale, visually evoked magnetic fields have been reported. At the microscale however, while benefits of recording magnetic counterparts of electric spikes would be numerous, they are also highly challenging in vivo. Here, we combine magnetic and electric recordings of neuronal action potentials in anesthetized rats using miniaturized giant magneto-resistance (GMR) sensors. We reveal the magnetic signature of action potentials of well-isolated single units. The recorded magnetic signals showed a distinct waveform and considerable signal strength. This demonstration of in vivo magnetic action potentials opens a wide field of possibilities to profit from the combined power of magnetic and electric recordings and thus to significantly advance the understanding of neuronal circuits.


Figures

Figure 1.
Figure 1.
Biophysical background and recording setup. A Illustration of a pyramidal neuron and the electric currents (purple) and magnetic fluxes (turquoise) generated by an action potential originating at the soma and travelling along the axon. B Illustration of the recording setup. The anesthetized animal was placed in a Faraday cage. We recorded simultaneously with electric (purple) and magnetic (turquoise) sensors. All electronics necessary for the magnetic recording were contained within the Faraday cage, and no electric connections were entering or leaving the cage. C Example raw traces for the electric and magnetic sensors. Switches of the DC supply could occur pseudo-randomly every 10 seconds and are indicated here by shading (grey: DC on, white: DC off). A switch of the DC supply caused an artifact on both sensors. As expected, the DC condition did not affect the recorded signal on the electrode, while the GMR sensor can only detect magnetic signals in the DC on condition.
Figure 2.
Figure 2.
Power spectra of the GMR sensor. Example power spectrum from one in vivo (minimally shielded) recording block and for a control recording with a similar sensor in air in a well shielded room. The experimental condition spectrum shows peaks for electric line noise at 50 Hz and 150 Hz, and additional noise peaks at 5, 9, and 23 Hz of unknown origin in the DC on condition. The peak at 30 Hz in the well shielded room is due to a local coil used for calibration emitting a signal at that frequency. Note that the axes are in logarithmic scales.
Figure 3.
Figure 3.
STAs on thresholded spikes. A Photo of the magnetic probe with two GMR sensors and one Tungsten electrode glued onto it, and schematic drawing of the probe arrangement below the photo. B Electric and magnetic STAs of one example recording session, with spikes detected at a threshold of 5 SDs (15.119 spike events detected at this threshold). Left plot shows the STAs resulting from triggering the continuously recorded electric signal on the thresholded spikes from the same electrode. Right plot shows the STAs of the signals recorded from the two magnetic sensors, respectively. All STAs were calculated separately for the two recording conditions (red: DC on, blue: DC off). The STA on magnetic sensor 2 (top right) shows a peak around the time of the spike only for the DC-on condition. Shaded area represents standard error of the mean. C Same recording as in B, now with varying thresholds. From left to right the threshold is increased from 2.5 SDs to 7.5 SDs in steps of 1.25 SDs. The top row shows the electric STAs, the middle row the STAs for magnetic sensor 2, bottom row for magnetic sensor 1. The threshold setting illustrated in B is marked with a black box. From left to right, a decrease in the peak amplitude can be observed for the two magnetic sensors, while the peak in the electric STA is becoming more pronounced. Shaded area represents standard error of the mean. Please note that the y-axis scales are different for the different threshold settings.
Figure 4.
Figure 4.
STAs on thresholded versus spike-sorted data from Tungsten probes. A Electric and magnetic STAs for one recording block. As the threshold increases from left to right in steps of 1.25 SDs, like for the example shown in Fig 2, the electric STA (shown in the top row) becomes more pronounced, and the magnetic STA on sensor one (in the bottom row) disappears. The peak on sensor 2 (middle row) is less affected and still visible at higher thresholds. Shaded area represents standard error of the mean. Please note that the y-axis scales are different for the different threshold settings. B Average waveform and inter-spike interval (ISI) distribution for one example unit after spike-sorting the block shown in A. C Top row: STA of the continuous data recorded on one of the 2 Tungsten electrodes triggered on the spikes of example unit 1 per condition (red: DC on, blue: DC off). The number of spikes detected per condition is given in the inset. Shaded area represents standard error of the mean. Middle row: STA of the magnetic signal recorded on the magnetic sensor 2 per condition. The higher level of background noise in the DC-on condition is expected. Bottom row: same as middle row but for magnetic sensor 1. A clear magnetic signature can be observed on sensor 1 only in the DC-on condition. D, E Same as B, C, but for example unit 2.
Figure 5.
Figure 5.
Correlation analysis of electric and magnetic waveforms. A Illustration of the correlation analysis. Top left plot shows the demeaned central 2 ms of the electric STA of one well isolated single unit. The top right plot shows the corresponding demeaned magnetic STA on sensor 1. We computed the cross correlation values for shifts of +/− 10 samples around the time of the spike of the electric STA with respect to the magnetic STA. The resulting distribution of correlation values can be seen in the bottom plot. B Tungsten and magnetic-sensor signal, as well as cross-correlation values for the four significantly correlated single units. Shaded area represents standard error of the mean. Not significantly correlated signals are shown at decreased intensity. Unit 2 is the example used in A. Significant correlations are marked by asterisks. C Table of signal strength for the significant magnetic signals. The significant correlation with sensor 2 for unit 3 does not differ from chance in amplitude when tested for on/off condition difference.
Figure 6.
Figure 6.
STAs on spike-sorted data from silicon probes. A Photo of the magnetic probe and the silicon probe with 32 electric contacts glued onto it. Locations of the underlying GMR sensors are indicated with red boxes. B Average waveform and inter-spike interval distribution for one example unit. C Top row: STA of the continuous data recorded on one of the 32 electric channels triggered on the spikes of example unit 3 per condition (red: DC on, blue: DC off). The number of spikes detected per condition is given in the inset. Shaded area represents standard error of the mean. Middle row: STA of the magnetic signal recorded on the magnetic sensor 2 per condition. The higher level of background noise in the DC-on condition is expected. No apparent magnetic signature can be observed for either condition. Bottom row: same as middle row but for magnetic sensor 1. D, E Same as B, C, but for example unit 4.

Similar articles

References

    1. Amaral J, Cardoso S, Freitas PP, Sebastião AM (2011) Toward a system to measure action potential on mice brain slices with local magnetoresistive probes. 109:07B308.
    1. Baibich MN, Broto JM, Fert A, Nguyen Van Dau F, Petroff F, Etienne P, Creuzet G, Friederich A, Chazelas J (1988) Giant magnetoresistance of (001)Fe/(001)Cr magnetic superlattices. Physical review letters 61:2472–2475. - PubMed
    1. Barbieri F, Trauchessec V, Caruso L, Trejo-Rosillo J, Telenczuk B, Paul E, Bal T, Destexhe A, Fermon C, Pannetier-Lecoeur M, Ouanounou G (2016) Local recording of biological magnetic fields using Giant Magneto Resistance-based micro-probes. Scientific reports 6:39330. - PMC - PubMed
    1. Barnes FS, Greenebaum B (2007) Handbook of Biological Effects of Electromagnetic Fields. Bioengineering and Biophysical Aspects of Electromagnetic Fields. CRC CRC/Taylor & Francis:115–152.
    1. Barry JF, Turner MJ, Schloss JM, Glenn DR, Song Y, Lukin MD, Park H, Walsworth RL (2016) Optical magnetic detection of single-neuron action potentials using quantum defects in diamond. Proceedings of the National Academy of Sciences of the United States of America 113:14133–14138. - PMC - PubMed

Publication types