[Preprint]. 2023 Jul 2:2023.07.01.547351.
doi: 10.1101/2023.07.01.547351.

Deep learning microstructure estimation of developing brains from diffusion MRI: a newborn and fetal study

Affiliations

Deep learning microstructure estimation of developing brains from diffusion MRI: a newborn and fetal study

Hamza Kebiri et al. bioRxiv. .

Update in

Abstract

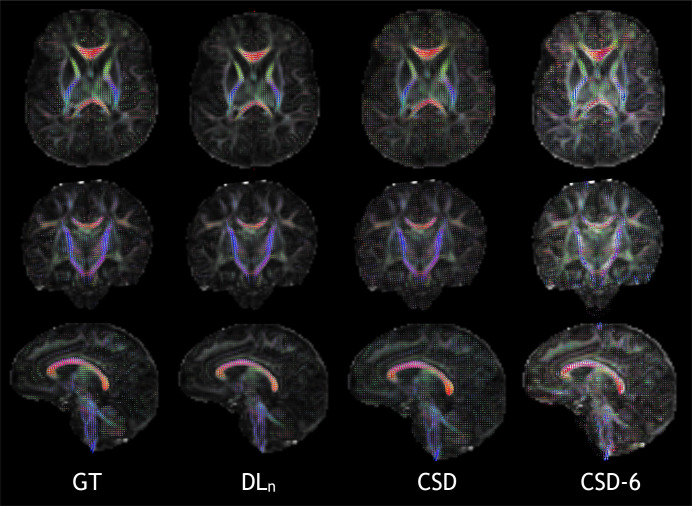
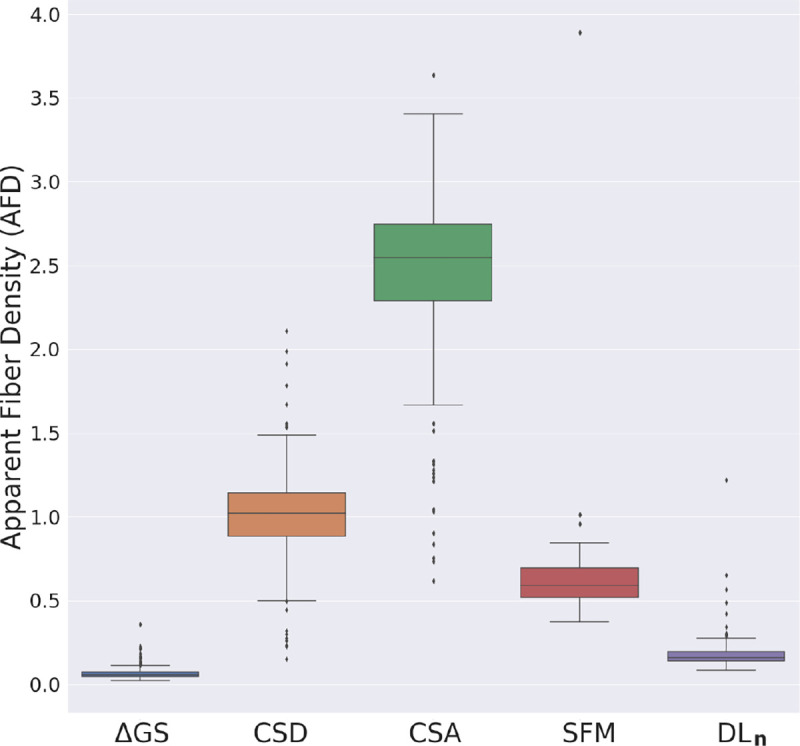
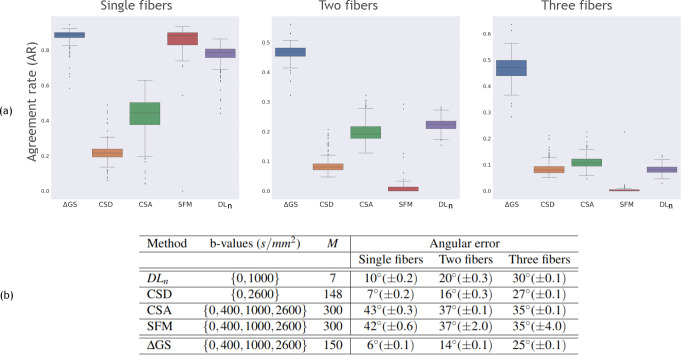
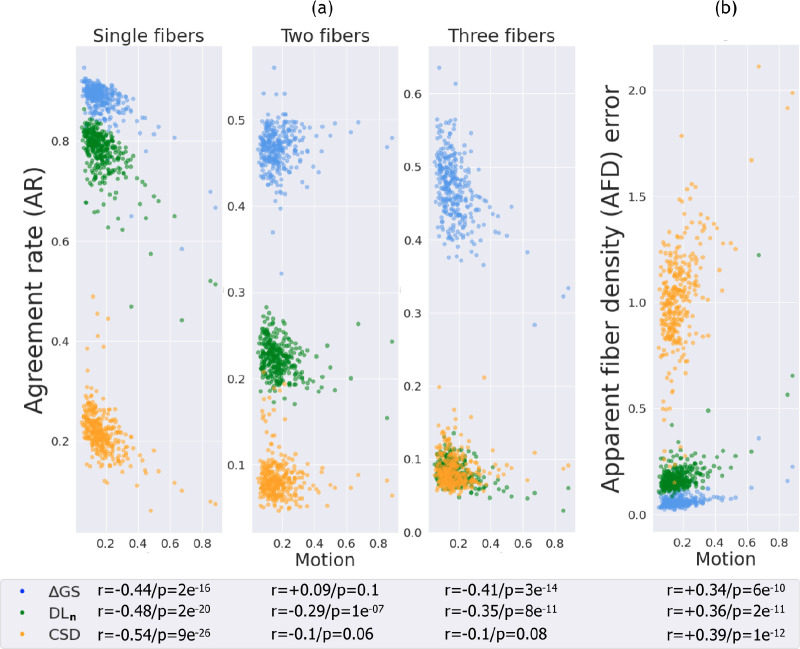
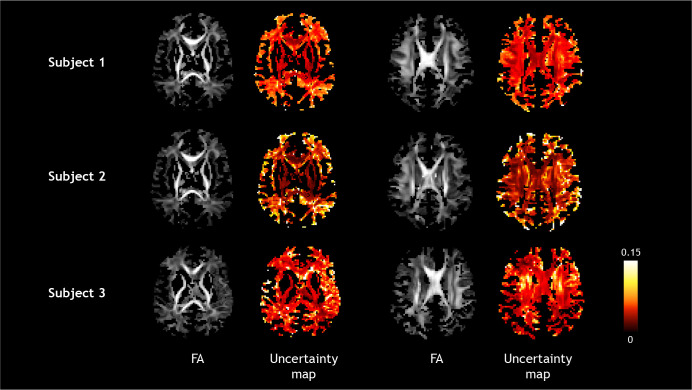
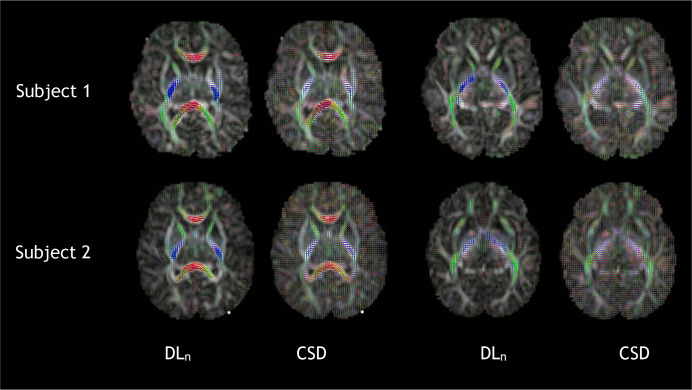
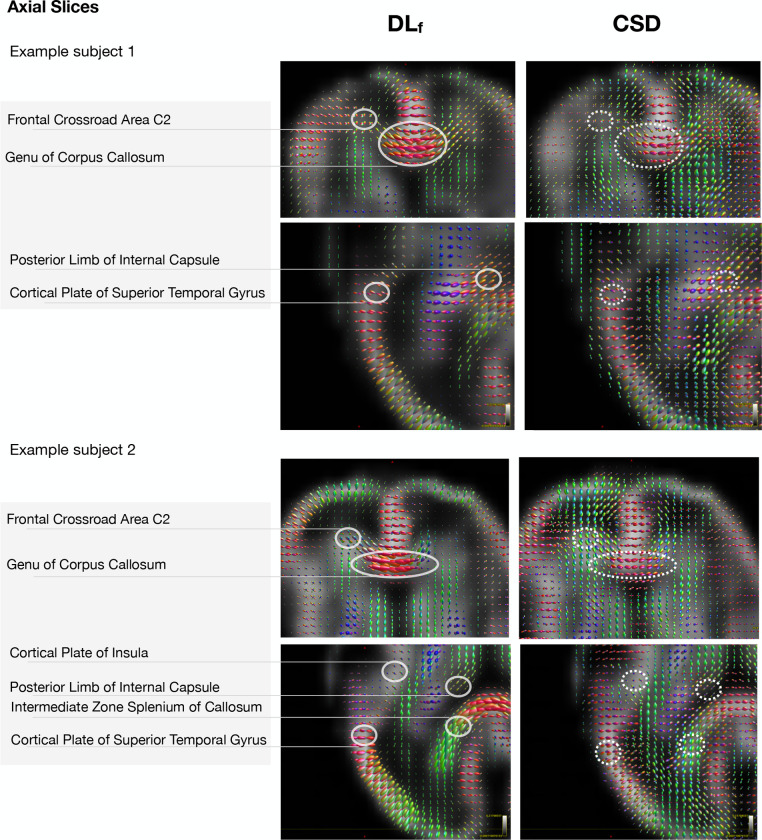
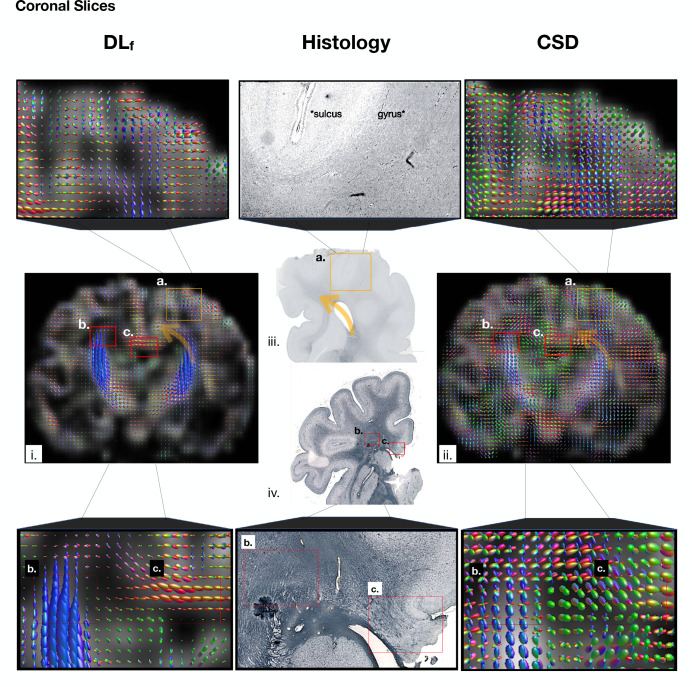
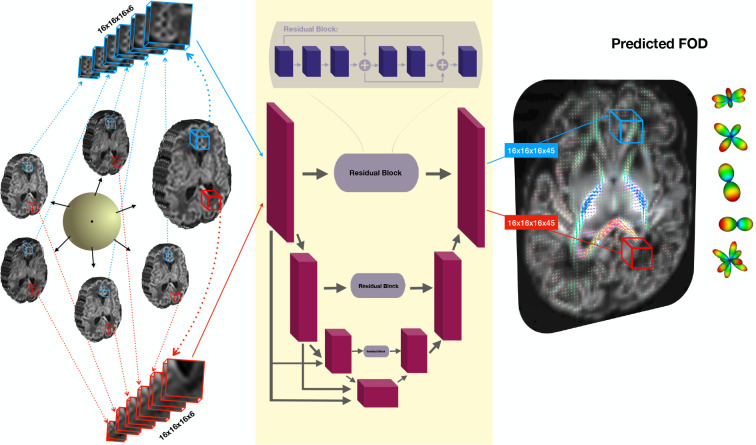
Diffusion-weighted magnetic resonance imaging (dMRI) is widely used to assess the brain white matter. Fiber orientation distribution functions (FODs) are a common way of representing the orientation and density of white matter fibers. However, with standard FOD computation methods, accurate estimation of FODs requires a large number of measurements that usually cannot be acquired for newborns and fetuses. We propose to overcome this limitation by using a deep learning method to map as few as six diffusion-weighted measurements to the target FOD. To train the model, we use the FODs computed using multi-shell high angular resolution measurements as target. Extensive quantitative evaluations show that the new deep learning method, using significantly fewer measurements, achieves comparable or superior results to standard methods such as Constrained Spherical Deconvolution. We demonstrate the generalizability of the new deep learning method across scanners, acquisition protocols, and anatomy on two clinical datasets of newborns and fetuses. Additionally, we compute agreement metrics within the HARDI newborn dataset, and validate fetal FODs with post-mortem histological data. The results of this study show the advantage of deep learning in inferring the microstructure of the developing brain from in-vivo dMRI measurements that are often very limited due to subject motion and limited acquisition times, but also highlight the intrinsic limitations of dMRI in the analysis of the developing brain microstructure. These findings, therefore, advocate for the need for improved methods that are tailored to studying the early development of human brain.


Figures

Figure 1.
Figure 1.
Qualitative high level comparison between, from left to right, the MSMT-CSD GT using the 300 multi-shell samples, the deep learning method DLn using six b=1000s/mm2 measurements and one b0, and CSD using 128 measurements of b=2600s/mm2 and 20 b0 images. Also shown on the right CSD-6, i.e. CSD with the same measurements that the DL method used. Axial, coronal and sagittal views are shown from top to bottom and the background images correspond to fractional anisotropy (FA) extracted from diffusion tensors estimated with all b=1000s/mm2 measurements.
Figure 2.
Figure 2.
Apparent fiber density error with respect to the MSMT-GT for the different methods, along with the agreement between the two gold standard datasets (ΔGS) that is shown as an upper bound error. The different baseline methods used are Constrained Spherical Deconvolution (CSD), using 128 gradient directions (b-value of 2600 s/mm2) and 20 b0 images; Constant Solid Angle (CSA) and the Sparse Fascicle Model (SFM) model using all available 300 measurements. DLn method, with less than an order of magnitude in the number of samples (six b=2600s/mm2 samples) and one b0 image) achieves the lowest error by a high margin.
Figure 3.
Figure 3.
(a) Agreement rates, extracted from confusion matrices as defined in the Methods section, for different methods compared to the MSMT-CSD GT and for the agreement between the gold standard subsets. From right to left, the deep learning method using six measurements and b0, SFM and CSA using 300 multishell samples, CSD using 148 measurements and the agreement between the two gold standard (ΔGS) mutually exclusive subsets using each 150 samples. (b) Mean and standard deviation of angular error between GT (MSMT-CSD) and the different methods. ΔGS refers to GS1 and GS2 agreements. The number of measurements (M) and the b-values used are also reported. All results were statistically significant compared to ΔGS(p9e-10). Our method achieves results comparable to the agreement rate ΔGS while using six measurements. It is worth noting that CSD is achieving slightly lower error because it misses more than 3 times GT-true single fiber voxels and more than two times GT-true two-fiber voxels, as can be seen in its low agreement rate in (a).
Figure 4.
Figure 4.
Agreement rate for voxels containing one, two, and three fibers, and apparent fiber density (AFD) error for the inter agreement between the gold standard datasets (ΔGS), deep learning method (DLn) and CSD, as a function of motion parameters (average translation and rotation parameters) for N=320 subjects. A negative correlation is generally observed with agreement rate (Spearman’s rank correlation coefficients shown in the figure with corresponding p-value). Similarly, a positive correlation with AFD error can be seen on the (b) panel. Other quality control (QC) metrics (Outlier ratio, Signal-to-noise ratio) and scan age didn’t exhibit any trend with the prediction accuracy (See Figure 10 in Supplementary Materials). Interaction analysis showed that CSD and DLn were not significantly affected by motion (p0.11).
Figure 5.
Figure 5.
From top to bottom: three dHCP test subjects of respectively 43, 42 and 40 weeks. Uncertainty maps, computed using coefficient-normalized standard deviation of 60 bootstrapped gradient directions as described in the Methods section, are shown on the right. On the left, corresponding FA maps calculated from the diffusion tensor, that highlights regions of high anisotropy. Low uncertainty can be seen in such regions as the corpus callosum or the cortico-spinal tract, where the network has lower prediction errors. A white matter mask was applied to all images.
Figure 6.
Figure 6.
Qualitative comparison for two clinical newborn subjects (subject 1 and subject 2 of 41.8 and 38.1 weeks respectively) between the deep learning method DLn (trained on dHCP dataset) using six b=1000s/mm2 measurements and one b0, and CSD using 30 measurements and 5 b0 images. The background images are the corresponding fractional anisotropy (FA) maps.
Figure 7.
Figure 7.
Qualitative assessment: Visual inspection of ROIs within FOD maps for two example subjects computed with DLf and CSD. ROIs were selected based on the knowledge of microstructure from histology and immunohistochemistry.
Figure 8.
Figure 8.
Qualitative assessment: Panel (iii.) shows a slice of a 40 GW fetal brain stained with SMI 312 directed against highly phosphorylated axonal epitopes of neurofilaments, with rostral ROIs marked with an orange rectangle. This section is an example of coronal sections which were taken into consideration for the assessment of accuracy for our (i) DLf and (ii) CSD method. Note the compactness of stained regions (marked with asterisks (*) in the magnified panels above figure iii. suggesting the mediolateral orientation of axonal fibers below the sulcus and rostrocaudal orientation with fanning of fibers within the gyrus. Corresponding regions are marked as (a.) within the FOD maps of both methods. Panel (iv.) shows another example of the coronal sections (40 GW fetal brain stained with GFAP) with 2 ROIs marked with red rectangles (e.g., the proximity of frontal crossroad area C2 (b.) and corpus callosum (c.)) that were taken into consideration for the assessment of accuracy for our (i) DLf and (ii) CSD method. Note the compactness of GFAP-stained regions in red rectangles suggesting the orientation of axons in these regions in the magnified panels below.
Figure 9.
Figure 9.
Schematic illustration of the proposed deep learning framework for predicting the Fiber Orientation Distribution (FOD). The input to the network consists of 3D patches derived from 6 diffusion measurements, which are normalized with b0. The network predicts the spherical harmonic coefficients (of order SH-Lmax=8) of the FOD for the input patch. Two example patches are shown in blue and red. The network trained on pre-term newborns takes 12 instead of 6 measurements.

Similar articles

References

    1. Volpe J. Brain injury in premature infants: A complex amalgam of destructive and developmental disturbances. Lancet Neurol. 8, 110–124, DOI: 10.1016/S1474-4422(08)70294-1 (2009). - DOI - PMC - PubMed
    1. Bhat S., Acharya U., Adeli H., Bairy G. & Adeli A. Autism: Cause factors, early diagnosis and therapies. Rev. Neurosci. 25, 841–850, DOI: 10.1515/revneuro-2014-0056 (2014). - DOI - PubMed
    1. Kwon E. & Kim Y. What is fetal programming?: A lifetime health is under the control of in utero health. Obstet. & Gynecol. Sci. 60, 506–519, DOI: 10.5468/ogs.2017.60.6.506 (2017). - DOI - PMC - PubMed
    1. O’Donnell K. & Meaney M. Fetal origins of mental health: The developmental origins of health and disease hypothesis. The Am. J. Psychiatry 174, 319–328, DOI: 10.1176/appi.ajp.2016.16020138 (2017). - DOI - PubMed
    1. Bilder D. et al. Early second trimester maternal serum steroid-related biomarkers associated with autism spectrum disorder. J. autism developmental disorders 49, 4572–4583, DOI: 10.1007/s10803-019-04162-2 (2019). - DOI - PMC - PubMed

Publication types