[Preprint]. 2023 Jul 2:2023.07.01.546933.
doi: 10.1101/2023.07.01.546933.

Configurational entropy is an intrinsic driver of tissue structural heterogeneity

Affiliations

Configurational entropy is an intrinsic driver of tissue structural heterogeneity

Vasudha Srivastava et al. bioRxiv. .

Abstract

Tissues comprise ordered arrangements of cells that can be surprisingly disordered in their details. How the properties of single cells and their microenvironment contribute to the balance between order and disorder at the tissue-scale remains poorly understood. Here, we address this question using the self-organization of human mammary organoids as a model. We find that organoids behave like a dynamic structural ensemble at the steady state. We apply a maximum entropy formalism to derive the ensemble distribution from three measurable parameters - the degeneracy of structural states, interfacial energy, and tissue activity (the energy associated with positional fluctuations). We link these parameters with the molecular and microenvironmental factors that control them to precisely engineer the ensemble across multiple conditions. Our analysis reveals that the entropy associated with structural degeneracy sets a theoretical limit to tissue order and provides new insight for tissue engineering, development, and our understanding of disease progression.

Keywords: Cell fluctuations; Cell sorting; Entropy; Heterogeneity; Interfacial mechanics; Mammary organoids; Statistical mechanics; Tissue self-organization.


Conflict of interest statement

DECLARATION OF INTERESTS Z.J.G. is an equity holder in Scribe biosciences, Provenance Bio, and Serotiny.

Figures
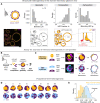
Figure 1:
Figure 1:. Cell positioning is intrinsically heterogeneous in vivo and in vitro.
A. A representative section of normal human mammary gland stained for keratin 19 and 14 (LEP and MEP markers, respectively). The cells are arranged in a bilaminar structure with MEP surrounding LEP (order), however the tissue also exhibits large variance in local geometry, cell proportions and cell positioning (disorder). A custom analysis workflow was used for pixel segmentation and image quantification (Supplemental Information). The density histograms show the distributions for effective tissue diameter (d), LEP proportion (Φ) and LEP positioning at the tissue boundary (ϕb). Analysis of n=128 tissue objects from 14 donors is shown. Scale bar = 50 μm. B. Reconstituted organoids provide an in vitro model to study intrinsic sources of positional heterogeneity in tissues with defined composition and geometry. Finite-passage human mammary epithelial cells (HMEC) were isolated from breast reduction mammoplasty, expanded in vitro, sorted as single cells and reaggregated in defined numbers and proportions. Organoids were cultured in Matrigel for 2 days. C. Mammary organoids contained similar number of GFP+ LEP (gold) and mCh+ MEP (purple). MEP spheroids contained similar number of GFP+ MEP (blue) and mCh+ MEP. Confocal images were processed to quantify the total LEP/GFP fraction (Φ) and the boundary LEP/GFP fraction (ϕb) (Supplemental Information). For each organoid, three central sections spaced 5 μm apart were analyzed. Scale bar = 50 μm. D. Processed mammary organoid and MEP spheroid images following segmentation illustrate population-level structural heterogeneity. Scale bar = 50 μm. E. Probability density histograms showing the population distribution of mammary organoids (gold) and MEP spheroids (blue) two days post-assembly. The dashed line represents a Gaussian fit to the MEP spheroid distribution. The number of observations is noted at the top right of the graph.
Figure 2:
Figure 2:. Tissues dynamically sample from the ensemble steady state distribution.
A. Snapshots from time lapse microscopy after segmentation for a representative mammary organoid and MEP spheroid illustrate temporal structural heterogeneity at the steady state. Scale bar = 50 μm. Quantification of fluctuations in ϕb over time for the examples shown. Dashed line is the average of ϕb over time for the corresponding tissue. B. Probability density histograms showing the temporal distribution of a small number of mammary organoids (n=18) and MEP spheroids (n=24) at the steady state. C. Organoids at different timepoints were binned into 10 structural states according to their ϕb. The probability of transitioning between any two structural states over a 20 min window is represented by the size of the circles. Any transitions not observed during this window are marked by ‘+’. For organoids at the steady state, the diagonal symmetry of the transition probability matrix suggests there is no net flux across states. The same tissues were used for this analysis as Fig. 2B. D. Organoids at each time point were classified into 5 groups based on the difference between the instantaneous and average ϕb. For each bin, the average structure at different time intervals from the initial classification is plotted. The colors in the graph on the right represent the bins on the example trace. The same tissues were used for this analysis as panel Fig. 2B.
Figure 3:
Figure 3:. A statistical mechanical framework provides a quantitative description of organoid structural distributions.
A. Schematic illustrating tensions at different cell-cell and cell-ECM interfaces. The total tissue mechanical energy is the sum of interfacial energy at each interface (product of the tension, γint, and the area, Aint, of the interface). B. Cortical tensions of single LEP and MEP in suspension as measured by micropipette aspiration. C. Cell-ECM contact angles for cells on Matrigel-coated glass were measured after 4 h. D. Cell-cell contact angles for cell pairs were measured after 3 h. E. Estimated cell-cell and cell-ECM tensions for LEP and MEP based on Young’s equation. For cell-ECM tensions, the γMEPECM was used as the reference and was assigned the value of 0. Confidence intervals were calculated using error propagation for standard error on cortical tension and contact angle measurements (Supplemental Information). F. 2D hexagonal or 3D body-centered cubic (BCC) lattice models were used to estimate the average mechanical energy and the degeneracy of structural macrostates (ϕb) (Supplemental Information). Only the 2D model is shown here for simplicity. Macrostates with ϕb0.5 comprise the greatest number of microstates (highest degeneracy). G. The average mechanical energy of mammary organoids for different values of ϕb estimated from the BCC model. Ten thousand tissue configurations were sampled for each ϕb. The dots and error bars represent the mean and standard deviation. The gold line represents a linear fit for average macrostate energy against ϕb. The slope (ΔE) is roughly proportional to the product of the difference in cell-ECM tensions and the total ECM surface area. H. Macrostate degeneracy (Ω) was calculated analytically (inset) (Supplemental Information). The corresponding probability density assuming random sampling of all microstates is shown with the dotted line. Additional variance due to uncertainty in measurements and degeneracy along other structural metrics was built into the model (Supplemental Information), and its prediction is shown using the solid line. The superimposed histogram for comparison is the measured ensemble distribution of MEP spheroids (from Fig. 1E). I. The structural distribution of organoid ensembles is modeled as a maximum entropy distribution, a function of the macrostate degeneracy (calculated analytically or from the distribution for MEP spheroids), mechanical energy (calculated from interfacial tensions), and tissue activity. J. The maximum entropy model (gold line) was fit to the measured ensemble distribution of mammary organoids (histogram, from Fig. 1E) to estimate the tissue activity. The predictions for distributions arising from only the scaled energy or macrostate degeneracy are also shown for comparison (gray and blue lines respectively). K. The diagram illustrates how the relative weights of the mechanical energy and macrostate degeneracy determine the extent of structural order. In the absence of a mechanical potential, the degeneracy dominates, and the system is maximally disordered. A large absolute mechanical potential drives the ensemble to an ordered state. The lines and hinges for boxplots in panels B-D show the median and the 1st and 3rd quartiles. The number of observations for panels B-D are noted at the bottom of the graphs. Asterisks represent the significance of difference from the reference group (MEP for B and C, MEP-MEP for D), as follows ns: p > 0.05; *: p < 0.05, **: p < 0.005; ***: p < 0.0005 based on Wilcoxon test.
Figure 4:
Figure 4:. Tissue activity sets the balance between the mechanical potential and macrostate degeneracy.
A. Tissue activity is a measure of the kinetic component of the internal energy of tissues and is associated with cell motility. Cell speeds were measured by tracking cell nuclei in LEP- or MEP-only spheroids using time lapse microscopy (n=11 and 14 respectively). Speeds for MEP(purple) and LEP (gold) as a function of distance from the tissue boundary are shown. The Pearson’s correlation coefficients for linear regression are shown. Average speeds and their 95% confidence intervals are represented by the points and error bars respectively. B. The effective diffusion coefficients for cells in spheroids were calculated from the trends for the relative distance between cell pairs. This approach eliminates confounding dynamics from whole organoid movements. The left graph shows example traces of relative distance between cell pairs over time for a representative MEP spheroid. The change in relative distance (relative displacement) was calculated for different time intervals (Δt) and averaged across all times and cell pairs to get the mean squared relative displacement (MSRD). The MSRD vs Δt curves were used to estimate the effective cellular diffusion coefficients Deff for each organoid (Supplemental Information). C. Effective diffusion coefficients for LEP (gold) and MEP (purple) in the presence and absence of ECM interactions (in Matrigel and agarose microwells, respectively). The lines and hinges for boxplot show the median and the 1st and 3rd quartiles. The number of spheroids analyzed is noted at the bottom of the graph. Asterisks represent the significance of difference between conditions, as follows ns: p > 0.05; *: p < 0.05, **: p < 0.005; ***: p < 0.0005 based on Wilcoxon test. D. Equal proportions of GFP+ LEP and mCh+ MEP were aggregated and cultured in Matrigel (high activity) or agarose microwells (low activity). E. The macrostate energy calculations for organoids in Matrigel (gold) and agarose (navy) using the BCC lattice model. F. The histogram shows probability density for organoids cultured in agarose. The gold line is the fit for organoids in Matrigel (+ECM), and the navy dotted line is the theoretical prediction based on ΔE for agarose with no change in activity. The solid navy line is the theoretical fit to the measured distribution, predicting 5-fold lower activity in agarose compared to Matrigel. G. Structural fluctuations in ϕb over time for representative mammary organoids in Matrigel and agarose (gold and navy respectively). Dashed line is the average of ϕb for the corresponding condition.
Figure 5:
Figure 5:. Engineering the structural ensemble by programming the mechanical potential and activity.
A. Experimental workflow: The MEP-ECM or MEP-MEP interfacial tensions were perturbed using shRNA against TLN1 (green) and CTNND1 (red). A non-targeting shRNA was used as control (blue). Equal proportion of mCh+ normal and GFP+ shRNA-transduced MEP were aggregated into spheroids (KD-MEP spheroids) and cultured either in Matrigel or agarose. B. The macrostate energy calculations for KD-MEP spheroids in Matrigel (top) and agarose (bottom) using the BCC lattice model. C. The predicted ensemble distributions for KD-MEP spheroids cultured in Matrigel (top) and agarose (bottom). D. The measured probability densities for KD-MEP spheroids cultured in Matrigel (top) and agarose (bottom). Histograms show the distribution of experimental data, dashed vertical lines are the average ϕb, and the solid curves are the theoretical predictions for each condition. The number of observations is noted at the top of the graphs.
Figure 6:
Figure 6:. Engineering the structural ensemble by programming macrostate degeneracy.
A. Engineering structure by varying LEP proportion: the proportion of GFP+ LEP in mammary organoids or GFP+MEP in MEP spheroids was varied. Tissues with Φ=0.25,0.5 or 0.75 (light pink, magenta, and dark purple respectively) were generated. B. Theoretical predictions for MEP spheroids (top row) and mammary organoids (bottom row) with varying Φ. C. The measured probability densities for MEP spheroids (top row) and mammary organoids (bottom row) with varying Φ. Histograms show the distribution of experimental data, dashed vertical lines are the average ϕb, and the solid curves are the theoretical predictions for each condition. The number of observations is noted at the top of the graphs. D. Engineering structure by varying tissue size: the total number of cells per organoid was varied by changing the tissue diameter. Tissues with average diameter of 70 μm, 90 μm, and 110 μm were generated (light orange, orange, and brown respectively). The cell proportions were held constant (Φ=0.5). E. Theoretical predictions for MEP spheroids (top row) and mammary organoids (bottom row) with varying size. F. The measured probability densities for MEP spheroids (top row) and mammary organoids (bottom row) with varying size. Histograms show the distribution of experimental data, dashed vertical lines are the average ϕb, and the solid curves are the theoretical predictions for each condition. The number of observations is noted at the top of the graphs. G. The equilibrium constant Keq for the partitioning of LEP between the tissue core to the boundary was calculated from the average occupancy of LEP and MEP in the tissue boundary and core. The free energy change (ΔG) associated with cell translocation is proportional to -logKeq and determines the favorability of cell translocation. H. Calculations of ΔG for different mechanical potentials and activities in tissues with a diameter = 80 μm containing equal number of LEP and MEP. The contour lines are predictions from the model and are colored by the value of ΔE. Estimated values of ΔG for different experimental conditions are also shown, where points and error bars are the average and standard deviations. The symbols represent different conditions ( ○: mammary organoids, △: MEP spheroids, ◇: TLN1-KD spheroids, □: CTNND1-KD spheroids), and the points are colored by their calculated ΔE.

Similar articles

References

    1. Hannezo E., Scheele C.L.G.J., Moad M., Drogo N., Heer R., Sampogna R.V., Rheenen J. van, and Simons B.D. (2017). A Unifying Theory of Branching Morphogenesis. Cell 171, 242–255.e27. 10.1016/j.cell.2017.08.026. - DOI - PMC - PubMed
    1. Dybala M.P., and Hara M. (2019). Heterogeneity of the Human Pancreatic Islet. Diabetes 68, 1230–1239. 10.2337/db19-0072. - DOI - PMC - PubMed
    1. Ben-Moshe S., and Itzkovitz S. (2019). Spatial heterogeneity in the mammalian liver. Nat Rev Gastroentero 16, 395–410. 10.1038/s41575-019-0134-x. - DOI - PubMed
    1. Buske P., Galle J., Barker N., Aust G., Clevers H., and Loeffler M. (2011). A Comprehensive Model of the Spatio-Temporal Stem Cell and Tissue Organisation in the Intestinal Crypt. Plos Comput Biol 7, e1001045. 10.1371/journal.pcbi.1001045. - DOI - PMC - PubMed
    1. Goodwin K., and Nelson C.M. (2020). Branching morphogenesis. Development 147, dev184499. 10.1242/dev.184499. - DOI - PubMed

Publication types