

This is a preprint.
Genetic meta-analysis of levodopa induced dyskinesia in Parkinson's disease
- PMID: 37425912
- PMCID: PMC10327264
- DOI: 10.1101/2023.05.24.23290362
Genetic meta-analysis of levodopa induced dyskinesia in Parkinson's disease
Update in
-
Genetic meta-analysis of levodopa induced dyskinesia in Parkinson's disease.NPJ Parkinsons Dis. 2023 Aug 31;9(1):128. doi: 10.1038/s41531-023-00573-2. NPJ Parkinsons Dis. 2023. PMID: 37652906 Free PMC article.
Abstract
Importance: Forty percent of Parkinson's disease patients develop levodopa-induced-dyskinesia (LiD) within 4 years of starting levodopa. The genetic basis of LiD remains poorly understood, and there have been few well powered studies.
Objective: To discover common genetic variants in the PD population that increase the probability of developing LiD.
Design setting and participants: We performed survival analyses to study the development of LiD in 5 separate longitudinal cohorts. We performed a meta-analysis to combine the results of genetic association from each study based on a fixed effects model weighting the effect sizes by the inverse of their standard error. The selection criteria was specific to each cohort. We studied individuals that were genotyped from each cohort and that passed our analysis specific inclusion criteria.
Main outcomes and measures: We measured the time for PD patients on levodopa treatment to develop LiD as defined by reaching a score higher or equal than 2 from the MDS-UPDRS part IV, item 1, which is equivalent to a range of 26%-50% of the waking time with dyskinesia. We carried out a genome-wide analysis of the hazard ratio and the association of genome-wide SNPs with the probability of developing LiD using cox proportional hazard models (CPH).
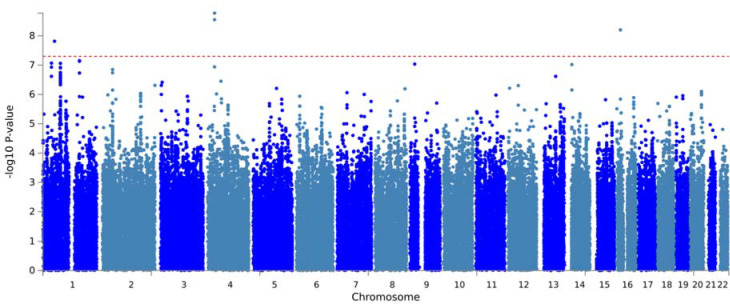
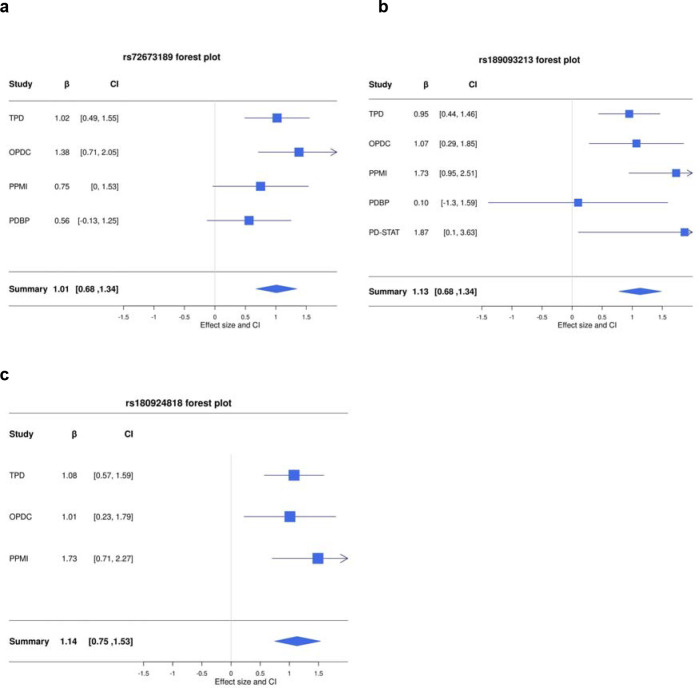
Results: This study included 2,784 PD patients of European ancestry, of whom 14.6% developed LiD. Consistent with previous studies, we found female gender (HR = 1.35, SE = 0.11, P = 0.007) and younger age at onset (HR = 1.8, SE = 0.14, P = 2 × 10 -5 ) to increase the probability of developing LiD. We identified three loci significantly associated with time-to-LiD onset. rs72673189 on chromosome 1 (HR = 2.77, SE = 0.18, P = 1.53 × 10 -8 ) located in the LRP8 locus, rs189093213 on chromosome 4 (HR = 3.06,, SE = 0.19, P = 2.81 × 10 -9 ) in the non-coding RNA LINC02353 locus, and rs180924818 on chromosome 16 (HR = 3.13, SE = 0.20, P = 6.27 × 10 -9 ) in the XYLT1 locus. Subsequent colocalization analyses on chromosome 1 identified DNAJB4 as a candidate gene associated with LiD through a change in gene expression. We computed a PRS based on our GWAS meta-analysis and found high accuracy to stratify between PD-LID and PD (AUC 83.9). We also performed a stepwise regression analysis for baseline features selection associated with LiD status. We found baseline anxiety status to be significantly associated with LiD (OR = 1.14, SE = 0.03, P = 7.4 × 10 -5 ). Finally, we performed a candidate variant analysis and found that genetic variability in ANKK1 ( rs1800497 , Beta = 0.24, SE = 0.09, P = 8.89 × 10 -3 ) and BDNF ( rs6265 , Beta = 0.19, SE = 0.10, P = 4.95 × 10 -2 ) loci were significantly associated with time to LiD in our large meta-analysis.
Conclusion: In this association study, we have found three novel genetic variants associated with LiD, as well as confirming reports that variability in ANKK1 and BDNF loci were significantly associated with LiD probability. A PRS nominated from our time-to-LiD meta-analysis significantly differentiated between PD-LiD and PD. In addition, we have found female gender, young PD onset and anxiety to be significantly associated with LiD.
Conflict of interest statement
Competing Interests statement
H.R.M. reports paid consultancy from Roche. Research Grants from Parkinson’s UK, Cure Parkinson’s Trust, PSP Association, CBD Solutions, Drake Foundation, Medical Research Council (MRC), Michael J. Fox Foundation. Dr Morris is a co-applicant on a patent application related to C9ORF72 - Method for diagnosing a neurodegenerative disease (PCT/GB2012/052140).
D.G.G. has received grants from Michael’s Movers, the Neurosciences Foundation, and Parkinson’s UK, and honoraria from AbbVie, BIAL Pharma, Britannia Pharmaceuticals, GE Healthcare, and consultancy fees from Acorda Therapeutics and the Glasgow Memory Clinic.
M.T.M.H. received funding/grant support from Parkinson’s UK, Oxford NIHR BRC, University of Oxford, CPT, Lab10X, NIHR, Michael J. Fox Foundation, H2020 European Union, GE Healthcare and the PSP Association. She also received payment for Advisory Board attendance/consultancy for Biogen, Roche, Sanofi, CuraSen Therapeutics, Evidera, Manus Neurodynamica, Lundbeck.
Y.B.-S. has received grant funding from the MRC, NIHR, Parkinson’s UK, NIH, and ESRC. C.C receives salary from University Hospitals Plymouth NHS Trust and National Institute of Health and Care Research. She has received advisory, consulting or lecture fees from AbbVie, Bial, Scient, Orkyn, Abidetex, UCB, Pfizer, EverPharma, Lundbeck, Global Kinetics, Kyowa Kirin, Britannia and Medscape, and research funding from Parkinson’s UK, Edmond J Safra Foundation, National Institute of Health and Care Research and Cure Parkinson’s. J.H. is supported by the UK Dementia Research Institute, which receives its funding from DRI Ltd, funded by the UK Medical Research Council, Alzheimer’s Society, and Alzheimer’s Research UK. He is also supported by the MRC, Wellcome Trust, Dolby Family Fund, National Institute for Health Research University, College London Hospitals Biomedical Research Centre.
All other authors report no competing interests.
Figures


References
-
- Kalia LV, Lang AE. Parkinson’s disease. Lancet. 2015;386(9996):896–912. - PubMed
-
- Fahn S, Oakes D, Shoulson I, et al. Levodopa and the progression of Parkinson’s disease. N Engl J Med. 2004;351(24):2498–2508. - PubMed
-
- Verschuur CVM, Suwijn SR, Boel JA, et al. Randomized Delayed-Start Trial of Levodopa in Parkinson’s Disease. N Engl J Med. 2019;380(4):315–324. - PubMed
-
- Jankovic J, Tan EK. Parkinson’s disease: etiopathogenesis and treatment. J Neurol Neurosurg Psychiatry. 2020;91(8):795–808. - PubMed
Publication types
Grants and funding
LinkOut - more resources
Full Text Sources
Research Materials
Miscellaneous