This is a preprint.
GRPa-PRS: A risk stratification method to identify genetically-regulated pathways in polygenic diseases
- PMID: 37425929
- PMCID: PMC10327215
- DOI: 10.1101/2023.06.19.23291621
GRPa-PRS: A risk stratification method to identify genetically-regulated pathways in polygenic diseases
Abstract
Background: Polygenic risk scores (PRS) are tools used to evaluate an individual's susceptibility to polygenic diseases based on their genetic profile. A considerable proportion of people carry a high genetic risk but evade the disease. On the other hand, some individuals with a low risk of eventually developing the disease. We hypothesized that unknown counterfactors might be involved in reversing the PRS prediction, which might provide new insights into the pathogenesis, prevention, and early intervention of diseases.
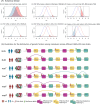
Methods: We built a novel computational framework to identify genetically-regulated pathways (GRPas) using PRS-based stratification for each cohort. We curated two AD cohorts with genotyping data; the discovery (disc) and the replication (rep) datasets include 2722 and 2854 individuals, respectively. First, we calculated the optimized PRS model based on the three recent AD GWAS summary statistics for each cohort. Then, we stratified the individuals by their PRS and clinical diagnosis into six biologically meaningful PRS strata, such as AD cases with low/high risk and cognitively normal (CN) with low/high risk. Lastly, we imputed individual genetically-regulated expression (GReX) and identified differential GReX and GRPas between risk strata using gene-set enrichment and variational analyses in two models, with and without APOE effects. An orthogonality test was further conducted to verify those GRPas are independent of PRS risk. To verify the generalizability of other polygenic diseases, we further applied a default model of GRPa-PRS for schizophrenia (SCZ).
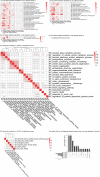
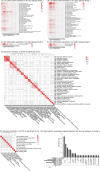
Results: For each stratum, we conducted the same procedures in both the disc and rep datasets for comparison. In AD, we identified several well-known AD-related pathways, including amyloid-beta clearance, tau protein binding, and astrocyte response to oxidative stress. Additionally, we discovered resilience-related GRPs that are orthogonal to AD PRS, such as the calcium signaling pathway and divalent inorganic cation homeostasis. In SCZ, pathways related to mitochondrial function and muscle development were highlighted. Finally, our GRPa-PRS method identified more consistent differential pathways compared to another variant-based pathway PRS method.
Conclusions: We developed a framework, GRPa-PRS, to systematically explore the differential GReX and GRPas among individuals stratified by their estimated PRS. The GReX-level comparison among those strata unveiled new insights into the pathways associated with disease risk and resilience. Our framework is extendable to other polygenic complex diseases.
Keywords: Alzheimer’s disease; Schizophrenia; genetically-regulated expression; genetically-regulated pathway; orthogonal effect; polygenic risk score; resilience.
Figures


Similar articles
-
Pathway-specific polygenic risk scores correlate with clinical status and Alzheimer's-related biomarkers.Res Sq [Preprint]. 2023 Mar 1:rs.3.rs-2583037. doi: 10.21203/rs.3.rs-2583037/v1. Res Sq. 2023. Update in: J Alzheimers Dis. 2023;95(3):915-929. doi: 10.3233/JAD-230548. PMID: 36909609 Free PMC article. Updated. Preprint.
-
Amyloid-β and APOE genotype predict memory decline in cognitively unimpaired older individuals independently of Alzheimer's disease polygenic risk score.BMC Neurol. 2022 Dec 15;22(1):484. doi: 10.1186/s12883-022-02925-6. BMC Neurol. 2022. PMID: 36522743 Free PMC article.
-
Polygenic effects on the risk of Alzheimer's disease in the Japanese population.Alzheimers Res Ther. 2024 Feb 27;16(1):45. doi: 10.1186/s13195-024-01414-x. Alzheimers Res Ther. 2024. PMID: 38414085 Free PMC article.
-
Polygenic Risk Scores in Alzheimer's Disease: Current Applications and Future Directions.Front Digit Health. 2020 Aug 11;2:14. doi: 10.3389/fdgth.2020.00014. eCollection 2020. Front Digit Health. 2020. PMID: 34713027 Free PMC article. Review.
-
Integrating Polygenic Risk Scores (PRS) for Personalized Diabetes Care: Advancing Clinical Practice with Tailored Pharmacological Approaches.Diabetes Ther. 2025 Feb;16(2):149-168. doi: 10.1007/s13300-024-01676-6. Epub 2024 Dec 17. Diabetes Ther. 2025. PMID: 39688777 Free PMC article. Review.
References
Publication types
Grants and funding
LinkOut - more resources
Full Text Sources
Miscellaneous
