[Preprint]. 2024 Jun 18:2023.04.14.536893.
doi: 10.1101/2023.04.14.536893.

Fast and flexible joint fine-mapping of multiple traits via the Sum of Single Effects model

Affiliations

Fast and flexible joint fine-mapping of multiple traits via the Sum of Single Effects model

Yuxin Zou et al. bioRxiv. .

Abstract

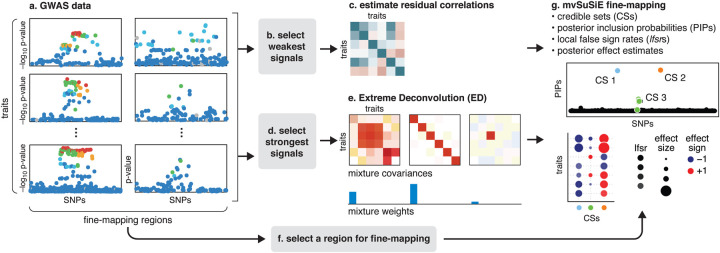
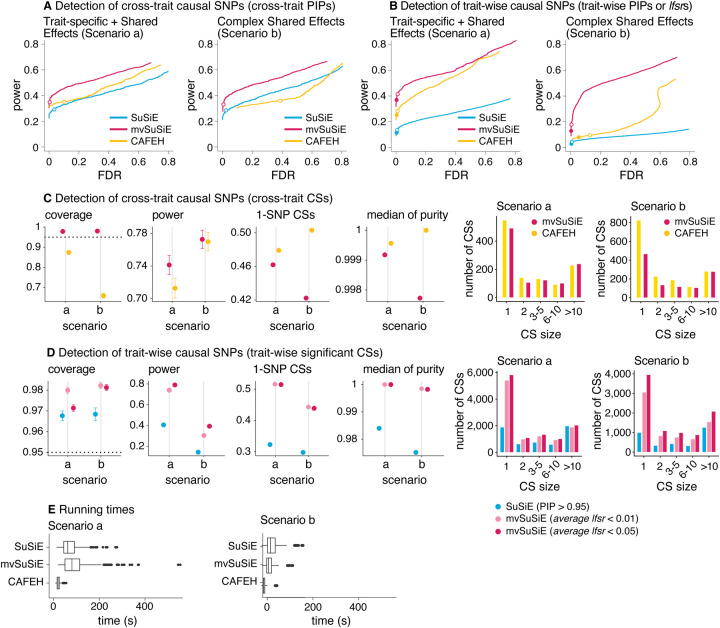
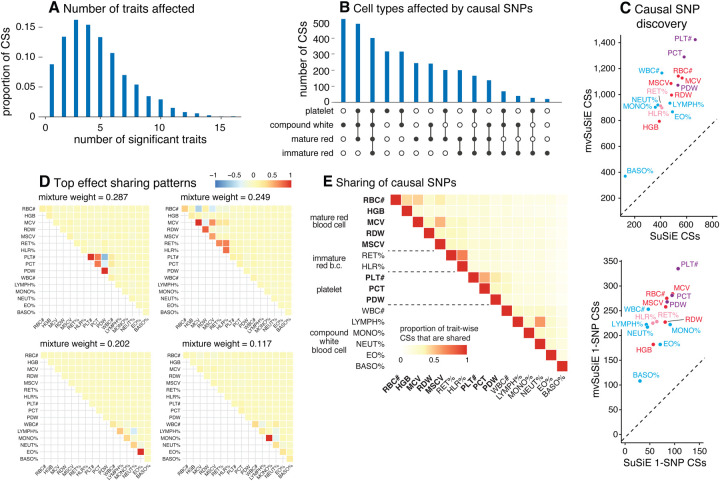
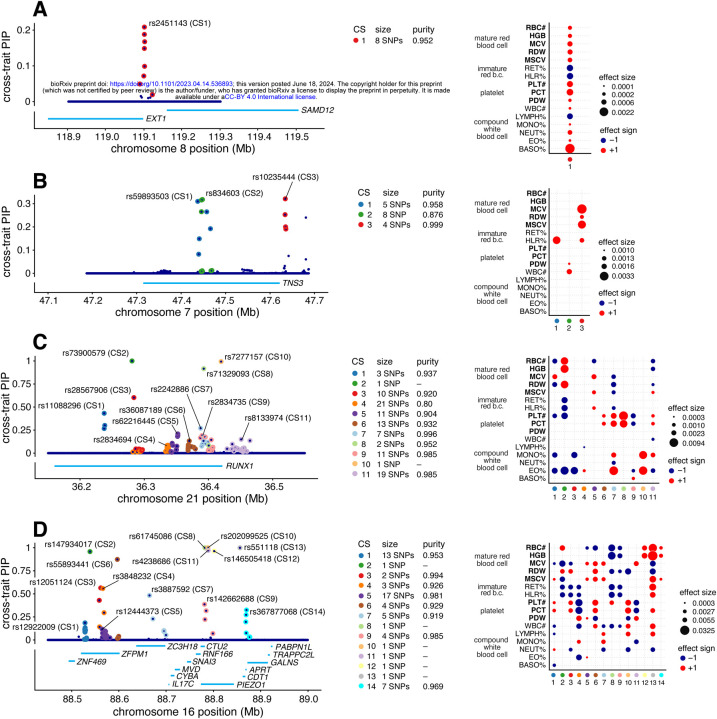
We introduce mvSuSiE, a multi-trait fine-mapping method for identifying putative causal variants from genetic association data (individual-level or summary data). mvSuSiE learns patterns of shared genetic effects from data, and exploits these patterns to improve power to identify causal SNPs. Comparisons on simulated data show that mvSuSiE is competitive in speed, power and precision with existing multi-trait methods, and uniformly improves on single-trait fine-mapping (SuSiE) in each trait separately. We applied mvSuSiE to jointly fine-map 16 blood cell traits using data from the UK Biobank. By jointly analyzing the traits and modeling heterogeneous effect sharing patterns, we discovered a much larger number of causal SNPs (>3,000) compared with single-trait fine-mapping, and with narrower credible sets. mvSuSiE also more comprehensively characterized the ways in which the genetic variants affect one or more blood cell traits; 68% of causal SNPs showed significant effects in more than one blood cell type.


Conflict of interest statement

Competing interests. The authors declare no competing financial interests.

Figures

Figure 1 |
Figure 1 |. Overview of multivariate fine-mapping using mvSuSiE.
mvSuSiE accepts as input traits and SNP genotypes measured in N individuals, R traits and M target fine-mapping regions. Alternatively, mvSuSiE-RSS accepts SNP-level summary statistics (a) computed from these data (see Online Methods, “mvSuSiE with summary data: mvSuSiE-RSS”). The weakest SNP association signals are extracted from these data (b), which are used in (c) to estimate correlations in the trait residuals (see Online Methods, “Estimating the residual variance matrix”). Separately, the strongest association signals are extracted (d) to estimate effect sharing patterns (e) using Extreme Deconvolution (ED) [35] (see Online Methods, “Specifying the prior”). Finally, the effect-sharing patterns estimated by ED, together with the estimated weights, are used to construct a prior for the unknown multivariate effects, and this prior is used in mvSuSiE to perform multivariate fine-mapping simultaneously for all SNPs in a selected region (g). Steps f and g are repeated for each fine-mapping region of interest. The key mvSuSiE outputs are: a list of credible sets (CSs), each of which is intended to capture a distinct causal SNP; a posterior inclusion probability (PIP) for each SNP giving the probability that the SNP is causal for at least one trait; average local false sign rates (lfsrs) summarizing significance of each CS in each trait; and posterior estimates of SNP effects on each trait. For example, if a region contains 3 distinct causal SNPs, mvSuSiE will, ideally, output 3 CSs, each containing a true causal SNP, with the average lfsr indicating which traits are significant for each CS. These quantities are defined in the Online Methods.
Figure 2 |
Figure 2 |. Comparison of fine-mapping methods in simulated data.
Panels A and B show power vs. FDR in identifying causal SNPs, either cross-trait (A) or trait-wise (B), using SNP-wise measures. In each scenario, FDR and power were calculated by varying the measure threshold from 0 to 1 (n=600simulations). The specific SNP-wise measures used in A are PIP (mvSuSiE, CAFEH), max-PIP (SuSiE); in B, PIP (SuSiE), minimum lfsr (mvSuSiE) and “study PIP” (CAFEH). Open circles are drawn at a PIP threshold of 0.95 or an lfsr threshold of 0.05; closed circles in B are at a PIP threshold of 0.99 or a lfsr threshold of 0.01. FDR = FP/(TP + FP) and power = TP/(TP + FN), where FP, TP, FN, TN denote, respectively, the number of false positives, true positives, false negatives and true negatives. (See also Supplementary Table 1 giving power and FDR statistics at commonly used thresholds.) Panels C and D evaluate the estimated 95% CSs using the following metrics: coverage, the proportion of CSs containing a true causal SNP; power, the proportion of true causal SNPs included in at least one CS; the proportion of CSs that contain a single SNP (“1-SNP CSs”); and median purity, in which “purity” is defined as the smallest absolute correlation (Pearson’s r) among all SNP pairs in a CS. Histograms of CS sizes (number of SNPs in a 95% CS) are given for each scenario. Target coverage (95%) is shown as a dotted horizontal line. Error bars show 2 times the empirical s.e. from the results in all simulations. Panel E summarizes runtimes; the SuSiE runtimes are for running SuSiE independently on all traits. The box plot whiskers depict 1.5 times the interquartile range, the box bounds represent the upper and lower quartiles (25th and 75th percentiles), the center line represents the median (50th percentile), and points represent outliers. Note that SuSiE analyzes each trait independently and therefore is not included in Part B. CAFEH does not provide trait-wise CSs and therefore is not included in Part C.
Figure 3 ∣
Figure 3 ∣. mvSuSiE fine-mapping and primary effect sharing patterns in UK Biobank blood cell traits.
Panels A, B and E give summaries of the 3,396 mvSuSiE CSs identified from the 975 candidate fine-mapping regions: (A) number of significant (average lfsr < 0.01) traits in each CS; (B) significant traits in CSs grouped by blood cell-type subsets; (E) pairwise sharing of significant CSs among the traits. In E, for each pair of traits we show the ratio of the number of CSs that are significant in both traits to the number of CSs that are significant in at least one trait. (C) Number of CSs and 1-SNP CSs for each trait identified by SuSiE and mvSuSiE (after removing CSs with purity less than 0.5). In C, each mvSuSiE count is the number of mvSuSiE CSs or 1-SNP CSs that are significant (average lfsr < 0.01) for the given trait. (D) Covariance matrices in the mvSuSiE data-driven prior capturing the top sharing patterns (these are the covariance matrices with the largest mixture weights in the prior). The covariance matrices were scaled separately for each plot so that the plotted values lie between −1 and 1. See Supplementary Fig. 13 for the full set of 15 sharing patterns.
Figure 4 |
Figure 4 |. Examples of blood cell trait loci fine-mapped using mvSuSiE.
The left-hand plots are “PIP plots” showing the cross-trait posterior inclusion probabilities (PIPs) for each SNP analyzed in the given fine-mapping region. The cross-trait PIP is an estimate of the probability that the SNP is causal for at least one trait. The labeled SNPs are the “sentinel SNPs”, the SNPs with the highest cross-trait PIP in each CS. “Purity” is defined as the minimum absolute pairwise correlation (Pearson’s r) among SNPs in the CS. The right-hand plots show the posterior effect estimates of the sentinel SNPs whenever the CS is significant for the given trait (average lfsr < 0.01). All estimates and tests are from a data sample of size n=248,980.

Similar articles

Cited by

References

    1. Canela-Xandri O., Rawlik K. and Tenesa A., “An atlas of genetic associations in UK Biobank,” Nature Genetics, vol. 50, p. 1593–1599, 2018. - PMC - PubMed
    1. Visscher P. M., Wray N. R., Zhang Q., Sklar P., McCarthy M. I., Brown M. A. and Yang J., “10 Years of GWAS Discovery: biology, function, and translation,” American Journal of Human Genetics, vol. 101, p. 5–22, 2017. - PMC - PubMed
    1. Buniello A., MacArthur J. A. L., Cerezo M., Harris L. W., Hayhurst J. and others, “The NHGRI-EBI GWAS Catalog of published genome-wide association studies, targeted arrays and summary statistics 2019,” Nucleic Acids Research, vol. 47, p. D1005–D1012, 2018. - PMC - PubMed
    1. Tam V., Patel N., Turcotte M., Bossé Y., Paré G. and Meyre D., “Benefits and limitations of genome-wide association studies,” Nature Reviews Genetics, vol. 20, p. 467–484, 2019. - PubMed
    1. Hormozdiari F., Kostem E., Kang E. Y., Pasaniuc B. and Eskin E., “Identifying causal variants at loci with multiple signals of association,” Genetics, vol. 198, p. 497–508, 2014. - PMC - PubMed

Publication types