[Preprint]. 2024 Sep 19:2023.06.25.546480.
doi: 10.1101/2023.06.25.546480.

The role of binocular disparity and attention in the neural representation of multiple moving stimuli in the visual cortex

Affiliations

The role of binocular disparity and attention in the neural representation of multiple moving stimuli in the visual cortex

Anjani Sreeprada Chakrala et al. bioRxiv. .

Abstract

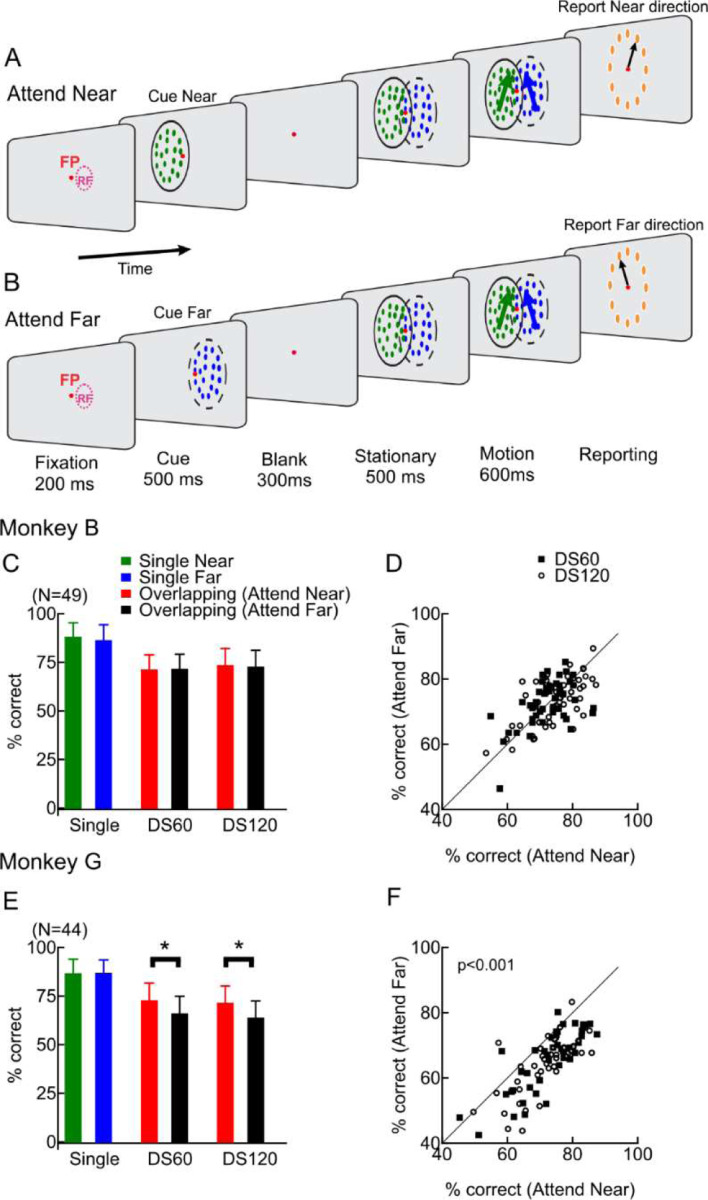
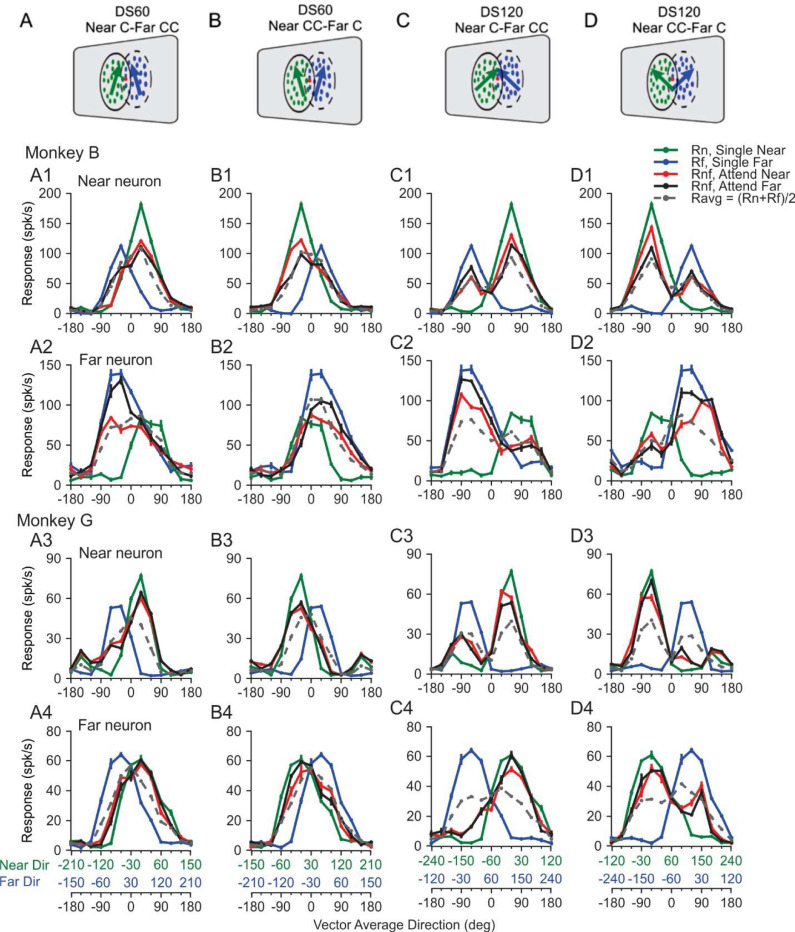
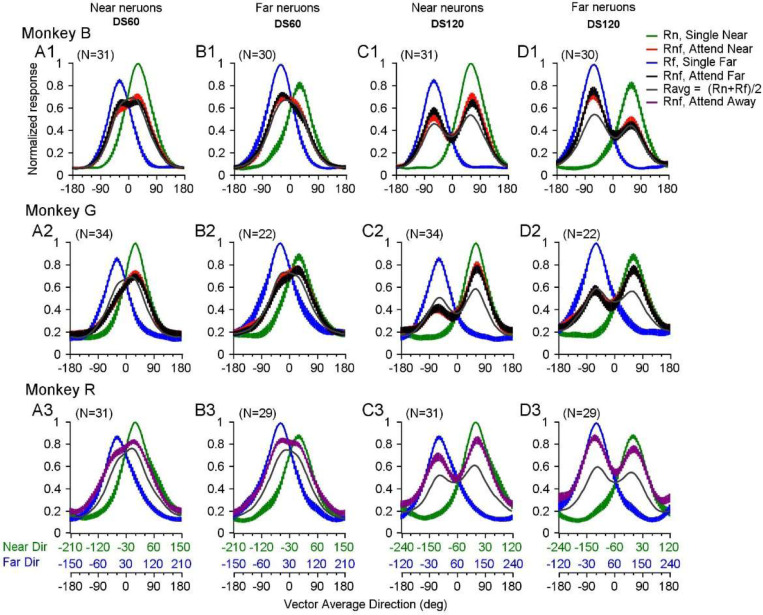
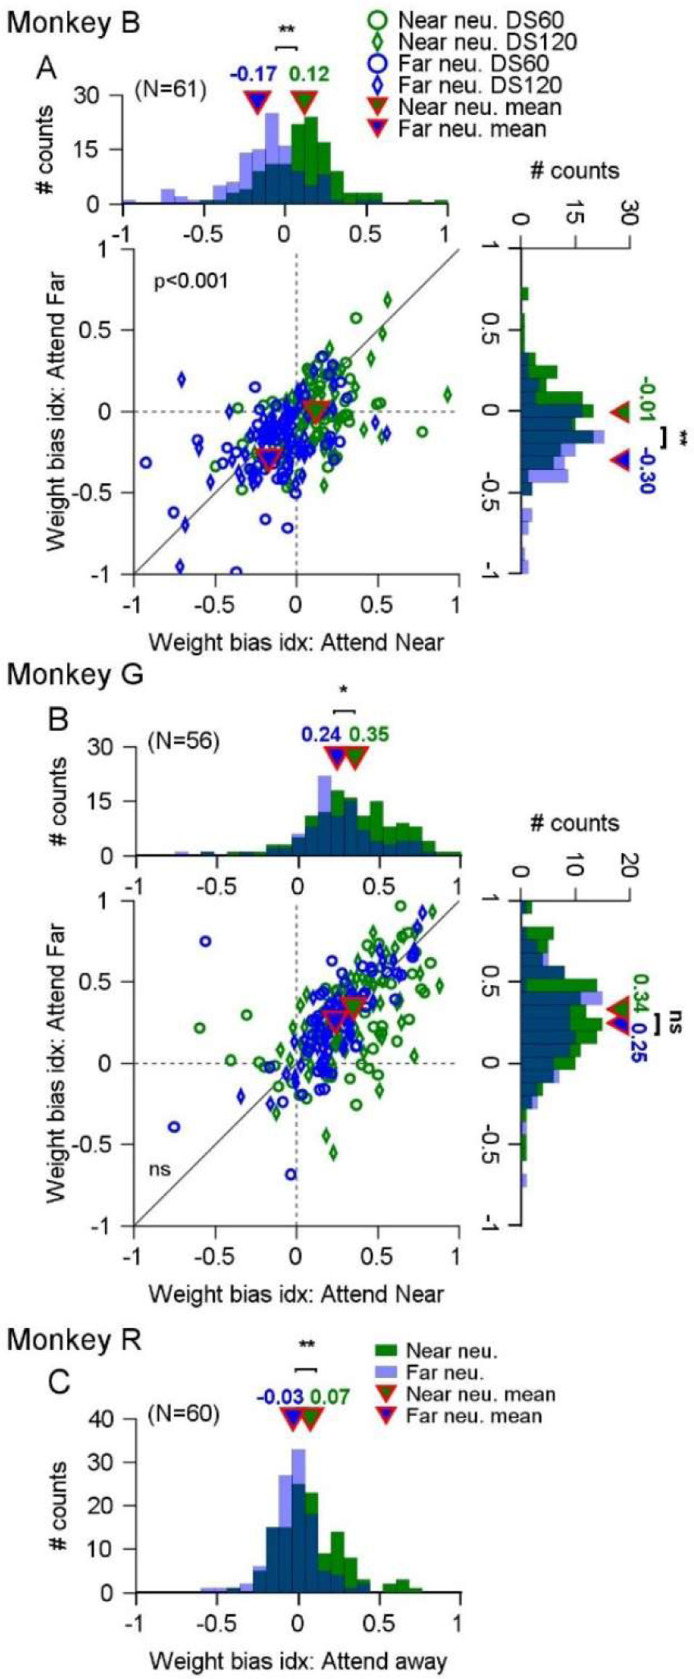
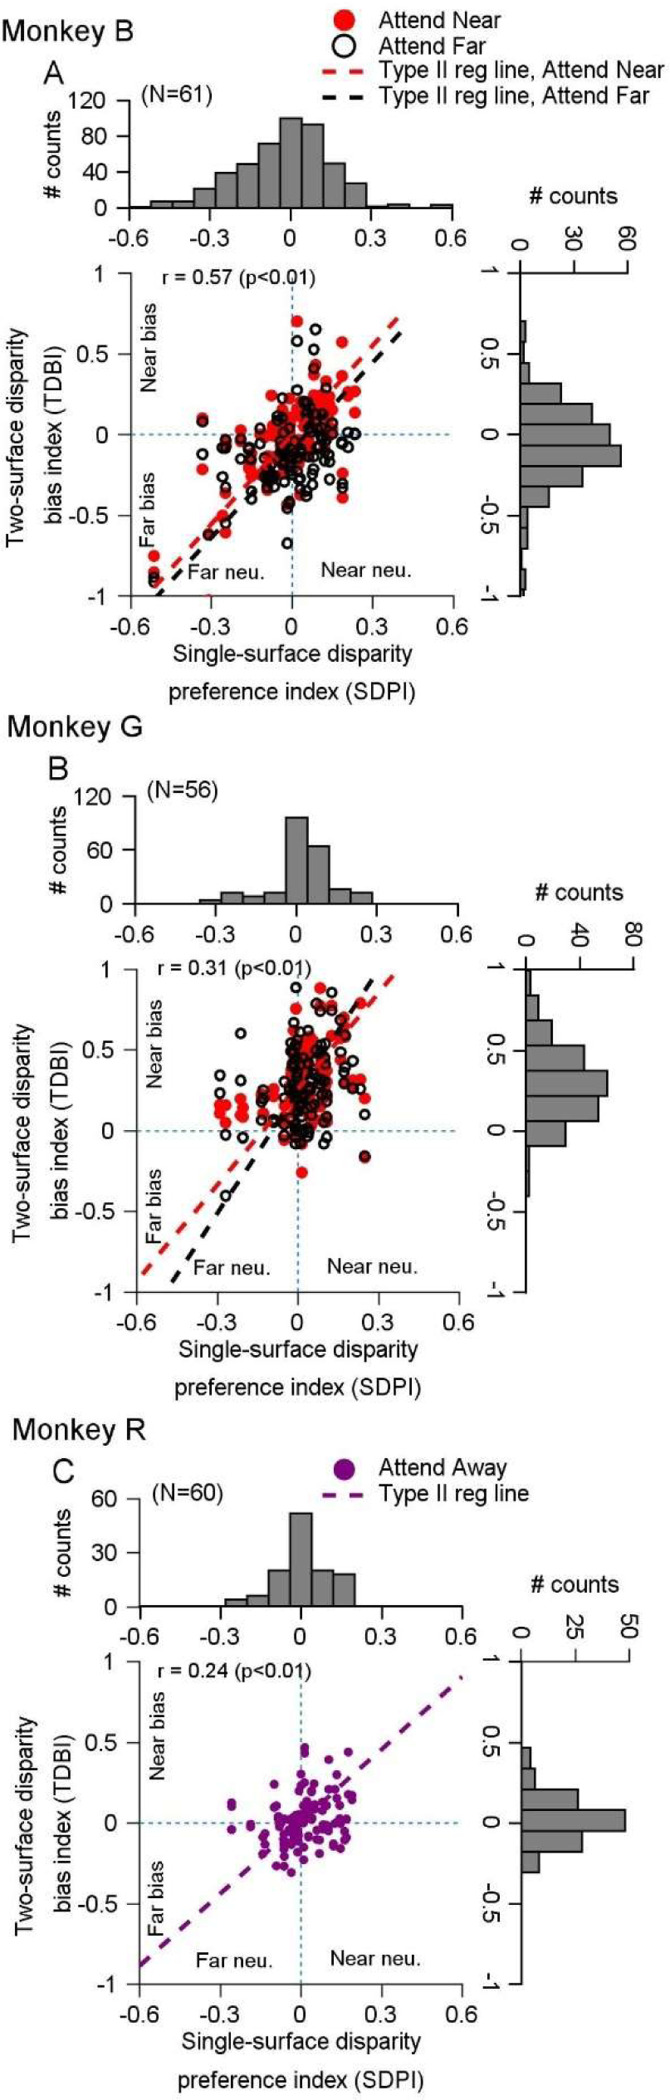
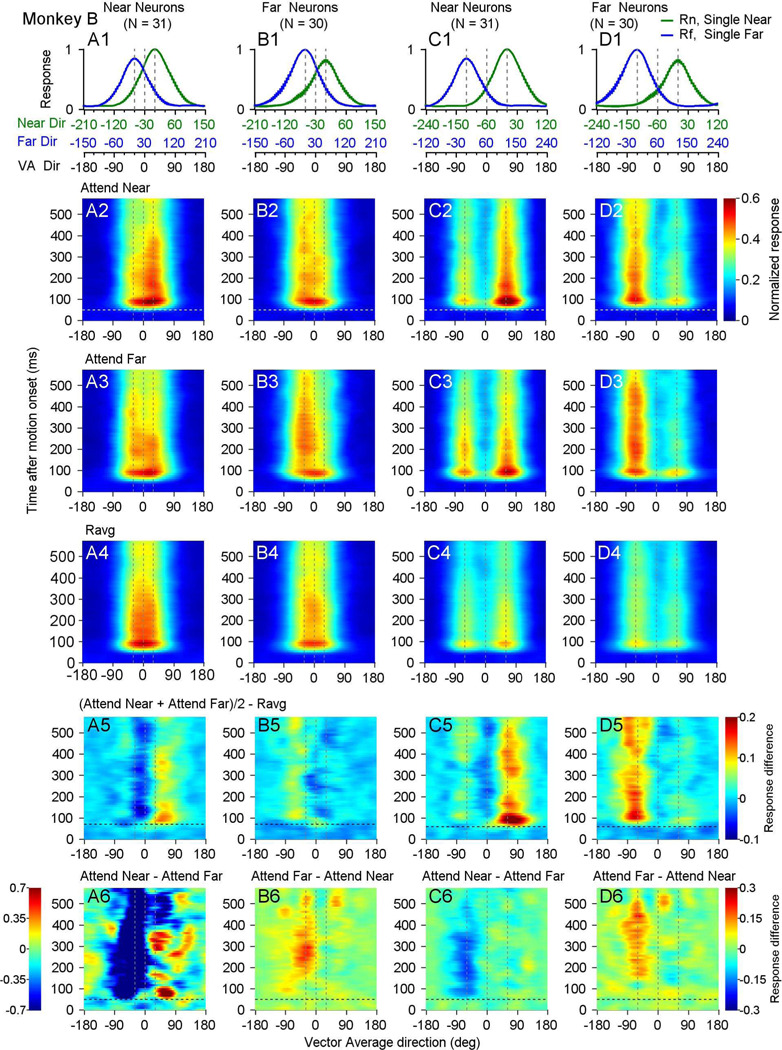
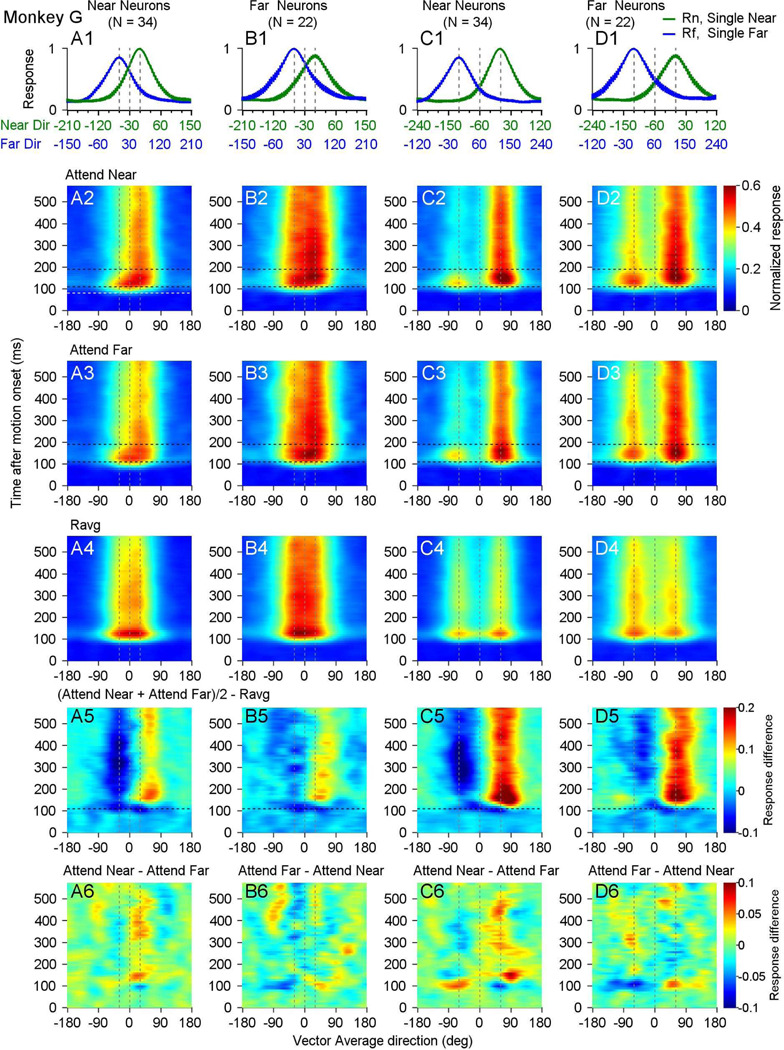
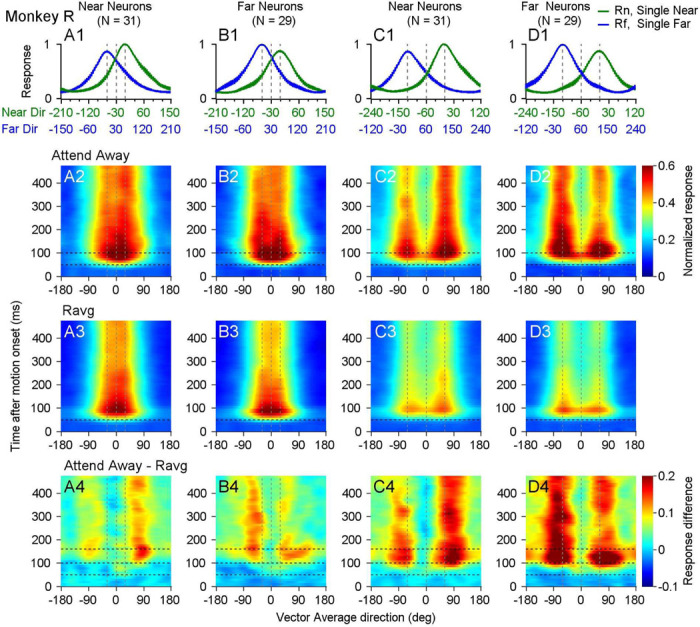
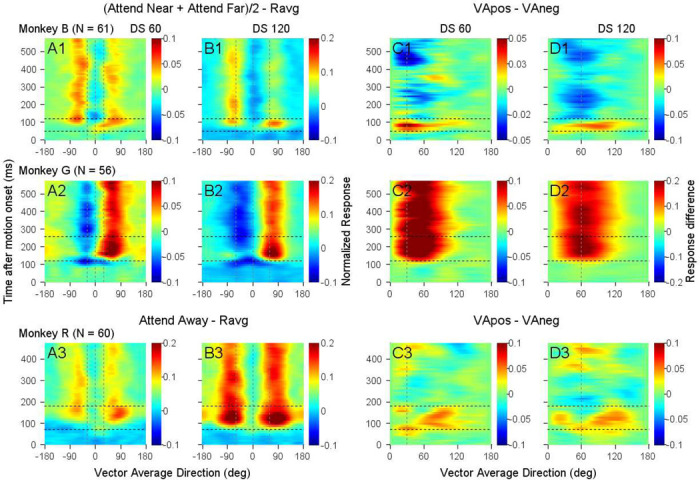
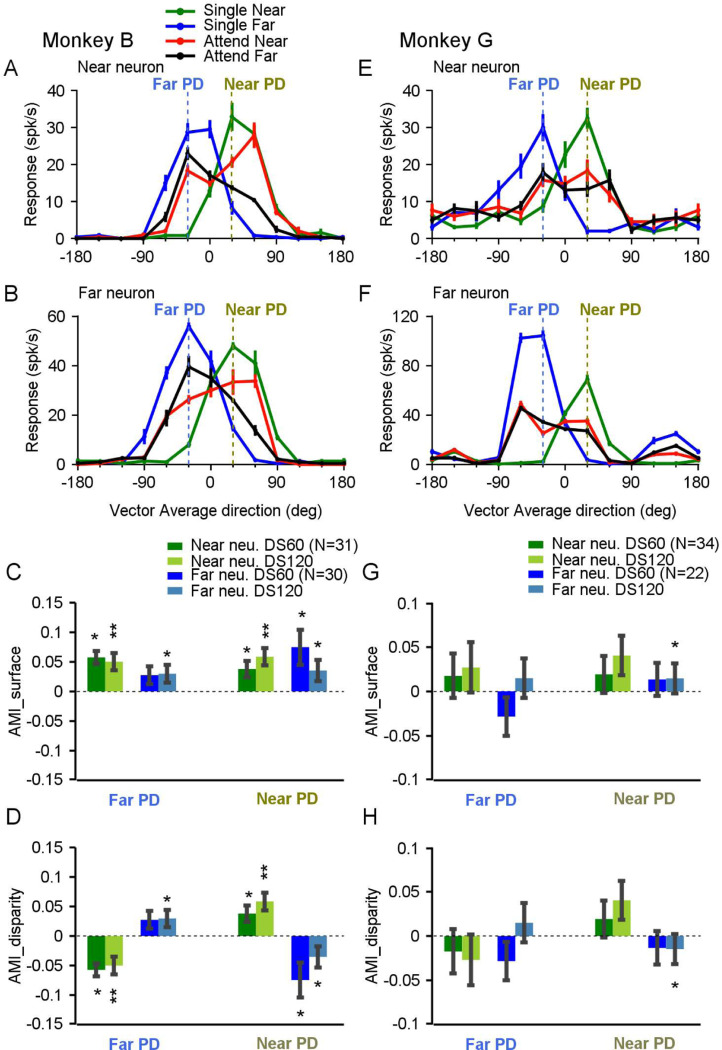
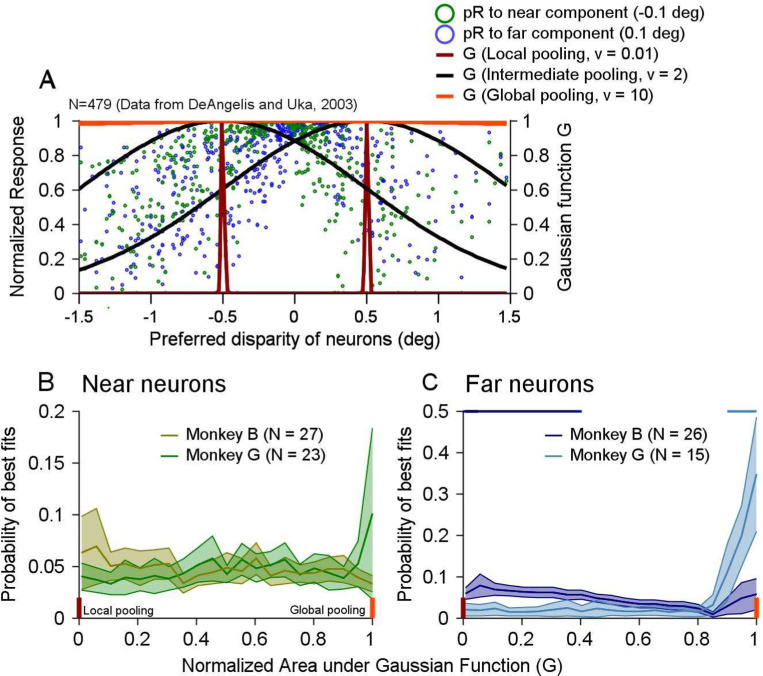
Segmenting visual scenes into distinct objects and surfaces is a fundamental visual process, with stereoscopic depth and motion serving as crucial cues. However, how the visual system uses these cues to segment multiple objects is not fully understood. We investigated how neurons in the middle-temporal (MT) cortex of macaque monkeys represent overlapping surfaces at different depths, moving in different directions. Neuronal activity was recorded from three male monkeys during discrimination tasks under varying attention conditions. We found that neuronal responses to overlapping surfaces showed a robust bias toward the binocular disparity of one surface over the other. The disparity bias of a neuron was positively correlated with the neuron's disparity preference for a single surface. In two animals, neurons preferring near disparities of single surfaces (near neurons) showed a near bias for overlapping stimuli, while neurons preferring far disparities (far neurons) showed a far bias. In the third animal, both near and far neurons displayed a near bias, though the near neurons showed a stronger near bias. All three animals exhibited an initial near bias across neurons relative to the average of the responses to the individual surfaces. Although attention modulated neuronal responses, the disparity bias was not caused by attention. We also found that the effect of attention was consistent with object-based, rather than feature-based attention. We proposed a model in which the pool size of the neuron population that weighs the responses to individual stimulus components can be variable. This model is a novel extension of the standard normalization model and provides a unified explanation for the disparity bias across animals. Our results reveal how MT neurons encode multiple stimuli moving at different depths and present new evidence of response modulation by object-based attention. The disparity bias allows subgroups of neurons to preferentially represent individual surfaces of multiple stimuli at different depths, thereby facilitating segmentation.

Keywords: MT cortex; binocular disparity; divisive normalization; encoding; macaque monkey; neural coding; segmentation; surface-based and object-based attention; transparent motion.


Conflict of interest statement

Conflict of Interest None.

Figures

Figure 1.
Figure 1.. The behavioral task and performance.
A, B. Visual stimuli were overlapping random-dot patches located at different depths and moving in different directions. Each trial started with fixation on a spot at the center of the monitor. Then, as a cue, a stationary random-dot patch (RDP) was presented for 500 ms at either the near (−0.1°) (A) or the far (0.1°) disparity (B) for 500 ms. After a 300-ms blank period, overlapping random-dot stimuli were turned on, initially stationary for 500 ms, and then moved in two directions for 600 ms. The direction separation (DS) between the two motion directions was either 60° or 120°. After the visual stimuli were turned off, 12 reporting targets were illuminated. To receive a juice reward, the monkey needed to make a saccadic eye movement to one of the targets in the direction that matched the motion direction of the cued surface of overlapping stimuli. A. Cue-near (Attend-Near) trial. B. Cue-far (Attend-Far) trial. C. D. Behavioral performance of monkey B. C shows the mean correct percentages across sessions for single and overlapping stimuli. D compares the performance between Attend Near and Attend Far conditions. Each dot in D represents the trial-averaged correct percentage in one session. E. F. Behavioral performance of monkey G, following the same convention as in C and D. Error bars in C and E represent standard deviation. (*) in E indicates p < 0.001 (paired signed-rank test).
Figure 2.
Figure 2.. Direction tuning curves of example MT neurons in response to overlapping bi-directional stimuli and the constituent stimulus components.
A-D. Stimlus configurations. The Direction separation between the two stimulus components was either 60° (A, B) or 120° (C, D). The motion direction at the near surface can either be at the clockwise (A, C) or counter-clockwise side (B, D) of the two motion directions. Responses of a near neuron (A1-D1) and a far neuron (A2-D2) from monkey B. Responses of a near neuron (A3-D3) and a far neuron (A4-D4) from monkey G. The red and black curves indicate the responses under attend-near and attend-far conditions, respectively. The green and blue curves indicate the responses to single motion directions of the near-surface and far-surface, respectively, when they were presented individually. The gray dash line indicates the average of the responses to the component directions (i.e. average of the green and blue curves). The abscissas in green and blue show the directions for the near component and the far component, respectively, of the corresponding bi-directional stimuli for which the vector average (VA) direction is shown by the black abscissa. The green and blue axes are shifted by 60° relative to each other in columns A and B, and by 120° in columns C and D. VA direction of 0° is aligned with each neuron’s preferred direction (PD). Error bars indicate the standard error.
Figure 3.
Figure 3.. Population-averaged direction tuning curves to overlapping stimuli moving at different depths.
Tuning curves to the bi-directional stimuli with 60° direction separation (DS60) (A, B) and 120° direction separation (DS120) (C, D), and the corresponding component directions. A, C. Tuning curves averaged across near neurons. B, D. Tuning curves averaged across far neurons. A1-D1. Responses from monkey B. A2-D2. Responses from monkey G. A3-D3. Responses from monkey R when attention was directed away from the RFs. The width of the curve for Rn, Rf, and Rnf represents the standard error. The tuning curve of each neuron was spline-fitted, normalized, and shifted circularly such that each neuron’s PD was aligned with VA 0°. The tuning curves to the bi-directional stimuli that had the near component at the clockwise side (Near C/Far CC) and at the counter-clockwise side (Near CC/Far C) of the two component directions were averaged. The tuning curves were then averaged across neurons. As a result, in all panels, the near component is always at the clockwise side of the two motion directions.
Figure 4.
Figure 4.. Disparity bias of near and far neurons and the effect of attention.
A. B. Scatter plots and marginal distributions of weight bias indices (WBI) of near (green) and far (blue) neurons under attend-near and attend-far conditions, for monkeys B (A) and G (B). In the scatter plots, each point represents the WBI based on one bi-directional tuning curve from one neuron. Each neuron contributed to four points, from direction separations of 60° (circle) and 120° (diamond), and stimulus configurations of Near C/Far CC and Near CC/Far C. The p-value in the scatter plot was from a paired signed-rank test. The histograms show the marginal distributions of WBI in the attend-near (top) and attend-far (right) conditions, for near (green) and far (blue) neurons. C. The distributions of WBI for monkey R when attention was directed away from the RFs, for near (green) and far (blue) neurons. In all histograms, (**) indicates p < 0.001, (*) indicates p < 0.01, (ns) indicates p > 0.05 (one-sided signed-rank test). The triangles show the mean WBI values for near and far neurons. The p value (A) and ns (B) in the scatter plots indicate significance level of comparing WBI between attending near and attending far conditions for all neurons combined.
Figure 5.
Figure 5.. Relationship between the disparity bias to two surfaces and the disparity preference for a single surface.
A. Scatter plot showing two-surface disparity bias index (TDBI) versus single-surface disparity preference index (SDPI) for each neuron from monkey B. Solid red circles represent attending near conditions, and open black circles represent attending far conditions. Each neuron contributes four data points (60° and 120° direction separations under both attention conditions). Dashed lines show Type II regression fits for attending near (red) and far (black) conditions. The Pearson correlation coefficient (r) is based on pooled results. Histograms display the distributions of TDBI (right) and SDPI (top). B. Results from monkey G. C. Results from monkey R, with attention directed away from the RFs.
Figure 6.
Figure 6.. Timecourse of response tuning to bi-directional stimuli moving at different depths in monkey B.
Columns A, B. Responses to 60° direction separation. Columns C, D. Responses to 120° direction separation. Columns A, C. Near neurons. Columns B, D. Far neurons. A1-D1. Population-averaged response tuning curves to single component directions at near (green) or far (blue) depth. The width of the curve for Rn, Rf represents the standard error. Vertical dashed lines mark the VA direction at the neuron’s PD (0°) (middle line), and when far (left line) or near (right line) components move in the PD. A2-D2. Timecourse of population-averaged tuning curves to bi-directional stimuli under Attend Near condition. Horizontal dashed lines at 50 ms after motion onset roughly mark the response onset. A3-D3. Responses under Attend Far condition. A4-D4. Average responses to near and far components (Ravg). A5-D5. Average responses under Attend Near and Attend Far conditions, subtracting Ravg. Horizontal dashed lines at 70 ms (A5) roughly indicate the onset of near bias at 60° direction separation. Horizontal dashed lines at 60 ms (C5) roughly indicate the onset of near bias at 120° direction separation. The far bias of far neurons is later than the near bias of near neurons (B5, D5). A6-D6. Difference between responses under two attention conditions. A6, C6. Attend Near – Attend Far. B6, D6. Attend Far – Attend Near. Horizontal dashed lines at 50 ms (A6-D6) roughly indicate the onset of attention effect for near neurons (A6, C6). The effect of attention for far neurons is later than for near neurons (B6, D6).
Figure 7.
Figure 7.. Timecourse of response tuning to bi-directional stimuli moving at different depths in monkey G.
The convention follows that of Figure 6. A1-D1. Population-averaged response tuning curves to single component directions at near (green) or far (blue) depth. A2-D2. Timecourse of population-averaged tuning curves to bi-directional stimuli under Attend Near condition. In A2, the white horizontal dashed line at 80 ms indicates response onset and the two black dashed lines at 110 ms and 190 ms indicate the time period during which the near bias of near neurons develops. A3-D3. Responses under Attend Far condition. The black dashed lines at 110 ms and 190 ms are also plotted in B2-D2 and A3-D3 for reference. A4-D4. Average responses to near and far components (Ravg). A5-D5. Average responses under Attend Near and Attend Far conditions, subtracting Ravg. The black dashed lines are at 110 ms as a reference. A6-D6. Difference between responses under two attention conditions. Vertical dashed lines in all panels mark the VA direction at the neuron’s PD (0°) (middle line), the far PD (left line), and the near PD (right line).
Figure 8.
Figure 8.. Timecourse of response tuning to bi-directional stimuli moving at different depths in monkey R.
The convention is similar to that of Figures 6 and 7. A1-D1. Population-averaged response tuning curves to single component directions at near (green) or far (blue) depth. A2-D2. Timecourse of population-averaged tuning curves to bi-directional stimuli with the animal’s attention directed away from the RFs. The two horizontal dashed lines are at 50 ms and 100 ms after motion onset as refenerences. A3-D3. Average responses to near and far components (Ravg). The horizontal dashed line is at 50 ms. A4-D4. Responses to bi-directional stimuli subtracting Ravg. The three horizontal dashed lines are at 50 ms, 100 ms, and 160 ms after motion onset. Vertical dashed lines in all panels mark the VA PD (middle line), the far PD (left line), and the near PD (right line).
Figure 9.
Figure 9.. Early near bias across all neurons in three monkeys.
A1-D1. Responses from monkey B. Horizontal dashed lines indicate 50 and 120 ms after motion onset. A2-D2. Responses from monkey G. Horizontal lines indicate 120 and 260 ms. A3-D3. Responses from monkey R. Horizontal lines indicate 70 and 180 ms. Columns A, C. Responses to 60° DS. Columns B, D. Responses to 120° DS. A1, B1, A2, B2. Average responses under Attend Near and Attend Far conditions, subtracting Ravg. A3, B3. Responses to bi-directional stimuli with attention directed away from the RFs, subtracting Ravg. Vertical dashed lines in columns A and B mark VA PD (middle line), far PD (left line), and near PD (right line). Columns C, D. Responses at negative VA directions were flipped relative to VA 0° and subtracted from responses at positive VA directions. The vertical dashed line indicates the component PD.
Figure 10.
Figure 10.. Attention modulation of neuronal responses to bi-directional stimuli moving at two depths for monkey B (A-D) and monkey G (E-H).
A, B, E, F. Tuning curves of four example neurons to bi-directional stimuli. The convention follows that of Figure 2. Error bars represent the standard error. The vertical dashed lines indicate the Near PD and the Far PD. C, G. Population-averaged object-based attention modulation indices (AMIsurface) were calculated separately using responses to bi-directional stimuli at the Far PD and the Near PD, across near neurons and far neurons, and for 60° and 120° DSs. D, H. Disparity-based attention modulation indices (AMI_disparity). Responses of monkey B were calculated from 0 to 600 ms following the motion onset. Responses of monkey G were calculated from 110 to 410 ms. (**) indicates p < 0.01, (*) indicates p < 0.05, and no asterisk indicates p > 0.05 (one-sided signed-rank test to compare AMI with zero).
Figure 11.
Figure 11.. Modeling neural responses to bi-directional stimuli at two depths.
A. MT population neural responses to component disparities of −0.1° and 0.1°, illustrating local, intermediate, and global pooling. The population responses are based on the disparity tuning curves of 479 MT neurons from DeAngelis and Uka (2003). v is the standard deviation of the Gaussian function, centered on the disparities of −0.5° and 0.5°, as two example dpref,i of neurons under study. B. Distribution of pooling size providing the best fit for near neurons’ responses from monkeys B and G. C. Distribution for far neurons, with significant differences between monkeys B and G indicated by horizontal blue and cyan lines at those pooling sizes. Error bands show 95% confidence intervals measured by bootstrapping. Short vertical brown and red bars in B and C represent local and global pooling sizes. Only neurons for which complete disparity tuning curves were obtained were included in this analysis.

Similar articles

References

    1. Albright T. D. (1984). Direction and orientation selectivity of neurons in visual area MT of the macaque. Journal of Neurophysiology, 52(6), 1106–1130. 10.1152/jn.1984.52.6.1106 - DOI - PubMed
    1. Bao P., & Tsao D. Y. (2018). Representation of multiple objects in macaque category-selective areas. Nature Communications, 9(1), 1774. 10.1038/s41467-018-04126-7 - DOI - PMC - PubMed
    1. Born R. T., & Bradley D. C. (2005). Structure and function of visual area MT. Annual Review of Neuroscience, 28(1), 157–189. 10.1146/annurev.neuro.26.041002.131052 - DOI - PubMed
    1. Bradley D. C., Chang G. C., & Andersen R. A. (1998). Encoding of three-dimensional structure-from-motion by primate area MT neurons. Nature, 392(6677), 714–717. 10.1038/33688 - DOI - PubMed
    1. Bradley D. C., Qian N., & Andersen R. A. (1995). Integration of motion and stereopsis in middle temporal cortical area of macaques. Nature, 373(6515), 609–611. 10.1038/373609a0 - DOI - PubMed

Publication types