[Preprint]. 2023 Jul 2:2023.07.01.547328.
doi: 10.1101/2023.07.01.547328.

A bistable inhibitory OptoGPCR for multiplexed optogenetic control of neural circuits

Affiliations

A bistable inhibitory OptoGPCR for multiplexed optogenetic control of neural circuits

Jonas Wietek et al. bioRxiv. .

Update in

  • A bistable inhibitory optoGPCR for multiplexed optogenetic control of neural circuits.
    Wietek J, Nozownik A, Pulin M, Saraf-Sinik I, Matosevich N, Gowrishankar R, Gat A, Malan D, Brown BJ, Dine J, Imambocus BN, Levy R, Sauter K, Litvin A, Regev N, Subramaniam S, Abrera K, Summarli D, Goren EM, Mizrachi G, Bitton E, Benjamin A, Copits BA, Sasse P, Rost BR, Schmitz D, Bruchas MR, Soba P, Oren-Suissa M, Nir Y, Wiegert JS, Yizhar O. Wietek J, et al. Nat Methods. 2024 Jul;21(7):1275-1287. doi: 10.1038/s41592-024-02285-8. Epub 2024 May 29. Nat Methods. 2024. PMID: 38811857 Free PMC article.

Abstract

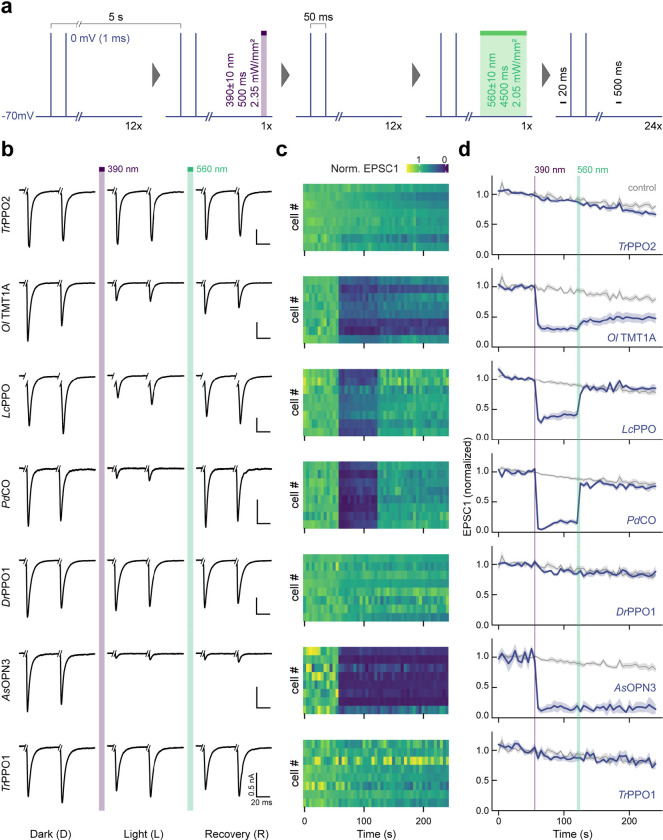
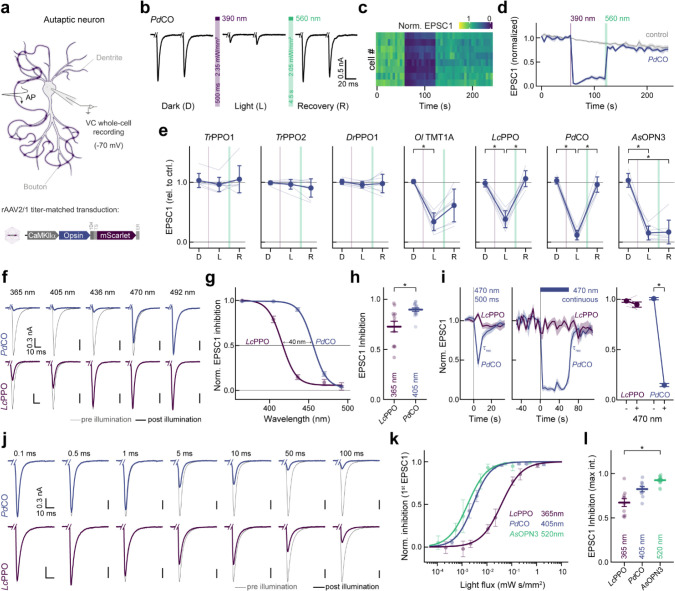
Information is transmitted between brain regions through the release of neurotransmitters from long-range projecting axons. Understanding how the activity of such long-range connections contributes to behavior requires efficient methods for reversibly manipulating their function. Chemogenetic and optogenetic tools, acting through endogenous G-protein coupled receptor (GPCRs) pathways, can be used to modulate synaptic transmission, but existing tools are limited in sensitivity, spatiotemporal precision, or spectral multiplexing capabilities. Here we systematically evaluated multiple bistable opsins for optogenetic applications and found that the Platynereis dumerilii ciliary opsin (PdCO) is an efficient, versatile, light-activated bistable GPCR that can suppress synaptic transmission in mammalian neurons with high temporal precision in-vivo. PdCO has superior biophysical properties that enable spectral multiplexing with other optogenetic actuators and reporters. We demonstrate that PdCO can be used to conduct reversible loss-of-function experiments in long-range projections of behaving animals, thereby enabling detailed synapse-specific functional circuit mapping.


Figures

Extended Data Fig. 1:
Extended Data Fig. 1:. Curated literature data of optoGPCRs.
Overview of all optoGPCR and their properties from literature (for references please see source data file). Left: phylogenetic tree. Middle section (squares): optoGPCR properties. Right: UniProt identifiers and species of origin of optoGPCRs.
Extended Data Fig. 2:
Extended Data Fig. 2:. GsX assay of optoGPCR candidates.
Time course of averaged bioluminescence reads for Gs-protein chimeras (columns) and optoGPCRs (rows). For OlTMT1A, TrPPO2, and BbOPN a 1s 470nm light pulse (Time=0s) was used for optoGPCR activation, while all other optoGPCRs were activated with a 1s 365nm light pulse. Please note different scales for AsOPN3 and OlTMT1A. All data is shown as mean ± SEM (n= 2–6).
Extended Data Fig. 3:
Extended Data Fig. 3:. Quantification of optoGPCR expression in cultured neurons.
a, Representative maximum intensity projection confocal images of neurons expressing the optoGPCRs together with a cytosolic EYFP. From top to bottom row: EYFP, mScarlet and merge of both signals. Inverted grayscale images are gamma corrected (1.25). The merged projections are false color coded by green (EYFP) and duo intense purple (mScarlet) lookup tables. b, PdCO example for quantification of fluorescence measurements. Zoomed in single z-slices are shown for each channel in the lower row together with the calculated binary masks. To quantify the membrane expression only (bottom row, right), the calculated mask for the cytosolic EYFP channel was subtracted from the mScarlet channel mask. Color coding and lookup tables as in a, but gamma (1.75) for single z-slice images. c, Quantification of total mScarlet (left) and EYFP (right) fluorescence mean gray intensities, determined from equatorial z-slices. n=10–16. All data is shown as mean ± SEM.
Extended Data Fig. 4:
Extended Data Fig. 4:. OptoGPCR GIRK coupling and benchmark summary.
a, Representative whole-cell patch-clamp recordings of cultured neurons co-transfected with the different optoGPCRs and GIRK2.1, respectively. Neurons were kept at −70mV holding potential and a 0.5s light pulse at indicated wavelengths was used for optoGPCR activation, while 5s light pulse at indicated wavelengths was used for optoGPCR inactivation. Illumination intensities were adjusted to equal photon flux density for all wavelengths. No response to light could be recorded for GgOPN5l1, BbOPN, GgOPN5m, and HsOPN5m (data not shown). b, Accumulated normalized response across all assays used to benchmark optoGPCR candidates against each other. Within each assay, the mean value of each optoGPCR was normalized to the maximum mean value within the regarding assay. For positive GIRK-coupling shown in a, a value of 1 (0, in case no coupling detected) was assigned. Logarithmic GsX mean values were used. An arbitrary cutoff of 2 was chosen for the follow up benchmark in autaptic neurons.
Extended Data Fig. 5:
Extended Data Fig. 5:. Inhibition of synaptic transmission in autaptic neurons.
a, Experimental scheme of EPSC recordings in autaptic neurons. b, Representative averaged EPSC traces for the 7 investigated optoGPCR candidates recorded as described in a. Traces show 5 averaged sweeps. Current injections were cut for representation. c, Contour plot of EPSC amplitudes for 8 biological replicates. Amplitudes were normalized to the average of 5 EPSC1s prior 390 nm illumination. d, Timeplot of averaged EPSC data (across replicates) as shown in c, together with non-expressing control cells from matching autaptic cultures measured with the same protocol. Data shown as mean ± SEM (n=8).
Extended Data Fig. 6:
Extended Data Fig. 6:. Paired-pulse recordings and mEPSCs in autaptic neurons.
a, Paired-pulse recording of an LcPPO expressing neuron (left), scaled to the first EPSC (right). b, Quantification of paired-pulse ratio (EPSC2/EPSC1). n= 8 c, Representative traces of mEPSCs (left) in a non-transduced control neuron (top) and a PdCO expressing autaptic cell (bottom). Right: Quantification of the mEPSC frequency after the light flash, normalized to the frequency prior light. n= 6–7. d, Quantal EPSC amplitude in control (top trace) and PdCO-expressing (bottom trace) neurons pre and post illumination. Right: Quantification of the mEPSC amplitudes after the light flash, normalized to pre illumination; n= 6–7. All data is shown as mean ± SEM.
Extended Data Fig. 7:
Extended Data Fig. 7:. Biophysical properties in autaptic neurons.
a, Quantification of EPSC inhibition versus applied wavelengths for LcPPO (right) and PdCO (left) including single cell measurement data points. For each cell, the inhibition was normalized to the maximum inhibition. Lines show dose-response fits. n= 6–15. b, Wavelength sensitivity of light induced recovery including single cell measurement data for LcPPO (right) and PdCO (left). n= 4–7. c, Quantification of absolute inhibition for the first EPSC post sample illumination versus light flux for (from left to right) LcPPO (365 nm), PdCO (405 nm) and AsOPN3 (520 nm) including single cell measurement data points. Lines depict sigmoidal fits to calculate half maximal inhibition light flux (EC50) values. n= 3–17. d, Top: schematic of 2-photon (2p) recordings in HEK293T cells co-transfected with PdCO-mScarlet and GIRK2.1 in a 1:3 ratio. Whole-cell patch-clamp recordings were performed and PdCO was activated with 2p raster scanning. Bottom: example recordings at various 2p wavelengths while applying a voltage ramp from −120 to +40mV. e, Top: example recordings of one representative HEK293T cell at −120mV holding potential for different scan wavelengths as indicated. Bottom: Quantification of 2p wavelength sensitivity; n= 6–8. Data was fitted with a 3-parametric Weibull distribution (red line) f, Top: example recordings of arepresentative HEK293T cell at −120mV for different 2p intensities of 800 nm. Bottom: Quantification of 2p sensitivity at 800 nm; n= 6–8. Data was fitted with a logistic dose response curve to determine the EC50 value (red line). All data is shown as mean ± SEM.
Extended Data Fig. 8:
Extended Data Fig. 8:. TRUPATH assay and pertussis toxin treatment in autaptic cultures.
a, TRUPATH netBRET data for all G-protein classes integrated over 3 minutes post optoGPCR activation (light colors) and 17–20 minutes post activation (saturated colors). n= 4. b, EPSC recordings in autaptic neurons as described for initial benchmark of optoGPCRs with additional pertussis toxin (PTX) treatment. PTX strongly reduces optoGPCR-mediated EPSC inhibition, and therefore indicates a Gi/o-dependent mechanism. n= 6–8. All data is shown as mean ± SEM.
Extended Data Fig. 9:
Extended Data Fig. 9:. Electrophysiological measurements in organotypic slices.
a, Two-photon maximum-intensity projections of CA3 neurons expressing PdCO-mScarlet (delivered via electroporation). b, Axons (originating from CA3 neurons shown in a) projecting into stratum radiatum of CA1. c, Experimental design, and representative current trace for bidirectional optogenetic control of synaptic transmission at Schaffer collateral synapses using somBiPOLES and PdCO. d, Quantification of absolute PSC amplitudes from bidirectional optogenetic experiments. n= 8–9. e, Normalized PSC amplitudes from control cultures expressing somBiPOLES alone, same as right panel in b. n= 8. f, Time course of normalized PSC amplitudes from control cultures expressing PdCO alone, without light stimulation. n= 4–6. g, Time course of normalized PSC amplitudes from control, non-expressing cultures, before and after light stimulation. n= 5–6. All data is shown as mean ± SEM.
Extended Data Fig. 10:
Extended Data Fig. 10:. cell-attached calcium imaging and blue-light fluorescence increase.
a, Voltage recording under tight-seal current-clamp conditions. 1 nA current pulses (40ms duration) were injected through the intact membrane patch at 0.2 Hz to evoke a train of action potentials. Top: magnified voltage recordings at selected time points. Middle: voltage recording of the complete experiment. Bottom: current injection. b, Top: raw ΔF/F signal from the neuron shown in a. Bottom: raw ΔF/F signal from a neuron in the same field of view recorded simultaneously. c, manually corrected ΔF/F signal as shown in b, top.
Figure 1:
Figure 1:. Benchmarking of inhibitory optoGPCR candidates.
a, Scheme of inhibitory optoGPCRs that couple via the Gi/o-pathway. A dark, inactive optoGPCR bound to the heterotrimeric Gαβγ protein is shown. Once the optoGPCR is activated by light, the heterotrimeric G-protein separates into the active Gα and Gβγ subunits. Gβγ activates G-protein coupled inward rectifying potassium channels (GIRK), inhibits voltage-gated calcium channels (VGCCs) and may interfere with the SNARE (soluble N-ethylmaleimide-sensitive-factor attachment receptor) vesicle fusion apparatus. The Gα subunit inhibits adenylyl cyclases (ACs), thus reducing production of cAMP. OptoGPCRs can relax thermally (kBT) to the non-signaling ground state. If their active state is spectrally separated from the ground state (see inset: absorption), absorption of a second photon with longer wavelength (hν) can terminate the signaling activity. b, Overview of optoGPCR candidates investigated in this study. Left, phylogenetic tree of optoGPCRs. Right, properties of optoGPCRs as reported in available literature. AT: all-trans. c, Design of DNA constructs used for initial characterization. d, Characterization of each optoGPCR’s Gα-protein signaling profile using the GsX assay. Photoactivation of the optoGPCR activates a chimeric Gαs subunit harboring the C-terminus from one other Gα-protein. This chimeric Gα-protein activates an adenylate cyclase (AC), which generates cAMP from ATP. cAMP activates a cAMP-dependent luciferase (Luc) whose bioluminescence is detected by a plate reader. e, Time course of averaged bioluminescence reads for Gαsz, Gαsi, and Gαso activation by OlTMT1A. The bioluminescence signal was normalized to the signal of cells not expressing optoGPCR and to pre-illumination baseline. A 1 s 470 nm light pulse was used for activation. n= 6. f, Maximum bioluminescence response for light-activated optoGPCRs coupling to Gαsi (blue circles) and Gαso (green diamonds). n.d.: not determined, n= 6. g, HEK-cell experiments to measure optoGPCR-evoked GIRK currents with whole-cell voltage-clamp recordings. h, Representative GIRK current traces recorded in HEK cells expressing the indicated optoGPCRs. Arrowheads and narrow bars indicate light application of 0.5 s, while wide bars indicate 10 s light activation (see Online Methods). i, Quantification of optoGPCR-evoked peak GIRK currents (n= 6 – 16). j, Maximum intensity projection images from confocal stacks of neurons expressing the nine best-expressing optoGPCRs fused to mScarlet together with a cytosolic EYFP. Inverted grayscale images are gamma corrected (1.25). The merged projections are false color-coded by green (EYFP) and duo intense purple (mScarlet) lookup tables. k, Quantification of membrane expression index (blue circles) and the membrane fluorescence (green diamonds) of each optoGPCR, determined from equatorial z-slices (n = 10 – 16). All data is shown as mean ± SEM.
Figure 2:
Figure 2:. Comparison of optoGPCR performance and biophysical characterization in autaptic neurons.
a, Schematic representation of an autaptic neuron recorded in the whole-cell configuration. Autaptic neurons were depolarized to fire unclamped action potentials, which triggered excitatory postsynaptic potentials (EPSCs). Neurons were transduced with rAAVs (bottom) encoding different optoGPCRs. b, Representative EPSCs traces evoked by a pair of 1 ms depolarizing current injections (50 ms inter-stimulus interval, every 5 s) in a PdCO-expressing autaptic neuron before (left, Dark) and after (middle, Light) UV-light illumination, followed by green light-induced recovery (right, Recovery). Traces show 5 averaged sweeps. Current injection transients were removed for visualization. c, Contour plot representing EPSC amplitudes in 8 neurons expressing PdCO, activated with 390 nm light for 500 ms and recovered by 560 nm light for 4.5 s. EPSCs were normalized to the average amplitudes of 5 EPSCs prior to 390 nm illumination. d, Averaged EPSC data (across replicates, n = 8) as shown in c, together with control EPSC recordings from non-expressing autaptic cultures measured with the same protocol. e, Quantification of EPSC inhibition for all optoGPCR candidates as shown in b-d. For dark (D; 2 EPSCs prior to UV light), light (L; 2 EPSCs post UV light and 2 EPSCs prior to green light) and recovery (R; 2 EPSCs 20s after green light) were averaged and normalized for EPSC rundown by the same quantification of non-expressing control cells from matching autaptic cultures as shown in c. Statistics: * indicates significance p<0.05; Friedman test followed by the Dunn-Sidak multiple comparison; OlTMT1A: p(D,L)= 3.46E-03, p(D,R) 1.78E-02; LcPPO: p(D,L)= 3.68E-02, p(L,R)= 1.40E-03; PdCO: p(D,L)= 1.40E-03, p(L,R)= 3.68E-02; AsOPN3: p(D,L)= 3.46E-03, p(D,R)= 1.78E-02. Data is shown as mean ± SD, n = 8. f, Example EPSCs (average of 7) pre illumination (gray) and post illumination (blue and purple), activated with light of different wavelengths (equal photon flux density) as indicated for PdCO (top) and LcPPO (bottom) from the same autaptic neuron respectively. g, Quantification of normalized EPSC inhibition for different wavelengths. For each cell, EPSC inhibition at each wavelength was normalized to the maximum inhibition. Lines show dose-response fit (n = 6 – 15). h, Quantification of the absolute EPSC inhibition at indicated wavelengths for experiments shown in f,g (n = 12 – 15). i, EPSC inhibition by blue light (470 nm) for PdCO and LcPPO. Illumination with blue light for 0.5 s (left, n = 10 – 14) or 60 s (middle, n = 5) evoked EPSCs inhibition by PdCO but not LcPPO. EPSCs recovered spontaneously for PdCO with a time constant τrec (monoexponential fit, see main text). (right) quantification of the EPSC reduction by sustained application of blue light, n= 5. Statistics: * indicates significance p<0.05; two-sided Wilcoxon Rank Sum Test; p= 6.27E-03. j, Representative EPSCs traces (average of 7) pre (gray) and post illumination with different light pulse durations (blue and purple) recorded in the same autaptic neuron, for PdCO (top) and LcPPO (bottom). k, Quantification of release inhibition post illumination versus light flux for PdCO, LcPPO and AsOPN3, normalized to the inhibition for maximum light flux used. Solid lines show sigmoidal fits (n = 3 – 17) l, Quantification of the absolute EPSC inhibition over 30 s post illumination at indicated wavelengths and maximum light flux for experiments as shown in j,k (n = 9 – 17). Statistics: * indicates significance p<0.05; Kruskal-Wallis test followed by Dunn-Sidak multiple comparison; p(LcPPO, AsOPN3)= 1.82E-04. If not stated otherwise all data is shown as mean ± SEM.
Figure 3:
Figure 3:. G-protein signaling in potent inhibitory optoGPCRs.
a, Scheme of GIRK activation and inhibition. Gβγ-complex signaling by photoactivated optoGPCRs activates GIRK channels, which are inhibited by SCH23390. b, Average current traces from cells expressing the indicating optoGPCRs, showing GIRK channel activation induced by light application in autaptic neurons. c, Quantification of maximum GIRK channel currents (n = 8). d, Quantification of the rise time to the half maximum current determined from the neurons shown in b. e, GIRK channel currents activated by light and inhibited by local application of SCH23390 in autaptic neurons (n = 5). f, EPSC1 inhibition of the same neurons shown in e. Application of SCH23390 does not alter EPSC inhibition. g, TRUPATH assay. Activation of the optoGPCR reduces the bioluminescence energy transfer (BRET) between the luciferase-fused Gα and the GFP-fused Gβγ subunits. h, Relative -netBRET means (n = 4) for major Gα subtypes integrated for 0–3 min post light activation (1s 390 nm; light shaded area) and integrated for 17–20 min post light activation (dark shaded area). i, EPSC1 inhibition as measured in Fig. 2a–e in autaptic neurons (open circles) and pertussis toxin (PTX) treated neurons from matched neuronal cultures. Cells were incubated with PTX for 12–16 h (n = 6 – 8). j, The GloSensor assay for inhibition of adenylyl cyclase (AC) activity by optoGPCRs. Forskolin (FSK) stimulates cAMP production by ACs, which can be inhibited by Gαi signaling induced by optoGPCRs. Changes in cAMP levels can be detected by cAMP-dependent Luciferase (Luc). k, Time course of cAMP response measured with the GloSensor assay for PdCO and LcPPO, after addition of FSK (t = 0 min; black arrow) and after activation of LcPPO and PdCO (purple arrow). Data is normalized to bioluminescence reads pre-FSK application (n = 6). l, Normalized cAMP changes after light application, calculated by division of minimum response post illumination by maximum pre-illumination response of data as shown in k (n = 6). All data is shown as mean ± SEM.
Figure 4:
Figure 4:. Characterization and performance of optoGPCRs in organotypic hippocampal slice cultures.
a, Illustration of experimental setup in organotypic hippocampal slice cultures (single cell plasmid electroporation, circles). Activation spectrum and light sensitivity were measured by recording GIRK-mediated currents from CA3 neurons expressing either PdCO or LcPPO in response to optogenetic stimulation through the microscope’s objective at varying light parameters. b, Quantification of GIRK current amplitudes recorded in cells expressing PdCO and LcPPO at the indicated light wavelengths and intensities. Activation light pulse: 500 ms. Inactivation light pulse: 5 s at 525 nm. Inset scale bar: 100 pA, 2 s. n = 6 – 8 c, Quantification of GIRK current amplitudes recorded in cells expressing PdCO and LcPPO at their optimal activation wavelength at varying light durations (n = 4 – 14). d, Illustration of experimental design for bidirectional optogenetic control of synaptic transmission. e, Representative current traces of patched CA1 neurons in response to optogenetically-induced presynaptic APs (625 nm, 5 ms) under baseline conditions (left), after activation (middle) and inactivation (right) of the optoGPCRs. Top: LcPPO group. Bottom: PdCO group. Gray: single trials; black: averaged traces. f, Normalized EPSC amplitudes from LcPPO group (top) and PdCO group (bottom). n = 9. Statistics: * indicates significance p<0.05; Repeated measures one-way ANOVA with the Geisser-Greenhouse correction followed by Tukey’s comparison; PdCO: p(B,L)< 1.00E-04, p(L,R)= 1.00E-04. g, Illustration of experimental setup for electrical stimulation of Schaffer collaterals and optogenetic inhibition of synaptic transmission. h, Time course of normalized PSC amplitudes from all the recorded postsynaptic CA1 neurons, before, during and after activation/inactivation of PdCO. Representative voltage-clamp traces are shown on top. Gray: single trials; black: average trials. Light was applied locally in CA1 for activation and inactivation of PdCO (ON light: 500ms, 405 nm, 1 mW/mm2; OFF light: 5 s, 525 nm, 1 mW/mm2). n= 3 – 7. All data is shown as mean ± SEM.
Figure 5:
Figure 5:. Single-photon spectral multiplexing of PdCO
a, Example traces of experiments used to determine the spectral features and light sensitivity of optoGPCR inactivation in autaptic neurons. Samples were first illuminated with 390 nm (LcPPO) or 405 nm (PdCO) light for 500 ms, respectively, to inhibit EPSCs (black circles), followed by recovery with light delivery at the indicated wavelengths (equal photon flux density) for 4.5 s (colored traces) and finally completely recovered with 520 nm for at least 10s (gray traces). An average of 7 EPSC traces are shown, scaled to the fully recovered EPSC. b, Wavelength sensitivity of light-induced recovery. To correct for potential EPSC rundown, recovery z-scores were calculated using the mean of 4 EPSC post inhibition, prior recovery light at different wavelengths and the mean of 4 EPSC post full recovery with green light. n = 4 – 7. c, Light titration of light induced recovery. Experiments were conducted as in b but at a fixed wavelength of 560 nm, while varying the light intensity between trials. n = 7 – 8. d, Top: spectra of PdCO activation (solid blue line) and inactivation (dashed blue line), excitation (solid magenta line) and emission (dashed magenta line) spectra of FR-GECO1c and stimulation light properties used for activation/ excitation (blue/ magentas shaded areas). Bottom (upper left): representative epifluorescence pseudocolor image of neuronal culture transduced with AAVs encoding PdCO-EGFP and FR-GECO1c. Bottom (upper right): schematic approach of the cell-attached tight-seal patch-clamp configuration. Bottom: constructs used for spectral multiplexing calcium imaging experiments. e, Average (across replicates) FR-GECO1c calcium traces during repetitive current injections (top) and with additionally expressing PdCO (lower trace). Example pictures from left to right: averaged signal before, during, and after blue light illumination. f, Quantification FR-GECO1c only (Top), co-expressed with PdCO (middle) and (bottom) additionally blocking GIRK currents with SCH23390 (SCH). n = 5 – 6. g, Spectra of PdCO activation (solid blue line) and inactivation (dashed blue line), together with the action spectra recorded from stChrimsonR-EGFP-P2A-PdCO (see e) expressing neurons measured with TTX, CNQX, AP-5 at −70 mV holding potential. Action spectra were recorded twice per cell in both directions (UV to red and vice versa) with equal photon flux density (2 ms light pulse) and then averaged. Stimulation light properties (purple/green/magenta shaded areas) are shown. n = 7. h, Construct design (top), schematic representation of expression (bottom left) and experiment (bottom right) are shown. Red-light activation (632 nm, 5 ms, 5 Hz) evoked APs in stChrimsonR-EGFP-P2A-PdCO expressing cells (upper trace), while in non-expressing cells a pronounced PSC could be recorded (lower trace). i, Quantification of maximum photocurrent amplitudes in stChrimsonR-EGFP-P2A-PdCO expressing cells mediated by either calcium-phosphate transfection or viral transduction. n = 10 – 13. j, Upper left trace: Representative recording of a postsynaptic non-expressing cell, where red light application evoked reliable PSCs. Upper right trace: The same neuron as before but UV-light activation of PdCO prior to ChrimsonR activation completely abolishes generation of PSCs. Bottom trace: Full time scale of the experiment showing repetitive suppression and recovery of ChrimsonR induced PSCs by toggling the activity of PdCO by UV and green light. k, Quantification of experiments shown in g for 5 biological replicates. All data is shown as mean ± SEM.
Figure 6:
Figure 6:. PdCO applications in cardiomyocytes and in vivo.
a, Schematics of the experimental setup and hypothesis. Top: schematic of the PdCO construct. Middle: experimental timeline. Bottom: Bilateral expression of PdCO in SNc dopaminergic neurons and unilateral light-mediated suppression of their striatal projections would induce an ipsiversive side bias during free locomotion. b, Locomotion trajectories of representative PdCO mice, over successive 10-min periods: (top to bottom) before, during and after light delivery. Magenta and black color code ipsilateral or contralateral angle trajectory segments, respectively. c, Top: Representative cumulative angle traces of the individual PdCO-expressing mice shown in e, over 30 min of free locomotion in an open field arena. Magenta and black colors depict ipsilateral or contralateral segments, respectively. Bottom: Average cumulative angle across PdCO-expressing (blue) and EYFP-expressing control mice (gray). Each mouse underwent two unilateral stimulations of each hemisphere, respectively, that was then averaged per mouse. n= 13–14 d, Quantification of the accumulated angle prior illumination (min. 9) compared to post UV-illumination (min. 20) for PdCO-expressing (blue, n=14) and EYFP-expressing control mice (gray, n= 13). The paired mean difference for both comparisons is shown as Cumming estimation plot. Each paired mean difference is plotted as a bootstrap sampling distribution. Mean differences are depicted as dots; 95% confidence intervals are indicated by the ends of the vertical error bars. Statistics: * indicates significance p<0.05; two-sided permutation t-test; 5.80E-03. e, Schematic of pupil experiment (see methods). f, Representative frames from pupil video recording at t=−5 (top),10 (middle) and 30 s (bottom) relative to 40 Hz laser stimulation onset. g, Mean pupillometry traces (bold lines, n=6) for 1 Hz (left), 10 Hz (middle), and 40 Hz (right) laser stimulation. Each time course denotes the median time-course of ipsilateral pupil diameter across trials in each subject in the basal forebrain (BF, gray) and the Edinger-Westphal nucleus (EW, blue). The vertical blue shaded area represents laser stimulation interval. Thin traces, individual mice; Thick traces, mean (n=6). h, Average pupil constriction (n=6 mice, matching the minimal value in time-courses shown in panel j) as a function of stimulation frequency (x-axis). Magenta dots and black diamonds represent EW stimulation effect on ipsilateral pupil or contralateral pupil, respectively. Bold dots/diamonds, average across mice (n=6). Error bars, SEM across mice. Light dots, average of trials in each mouse. Note that EW stimulation is associated with dose-dependent pupil constriction, and this is stronger for ipsilateral pupils. Statistics: * indicates significance p<0.05; multiple way ANOVA; p(placement)= 1.22E-20, p(frequency)= 9.62E-12, p(eye laterality)= 1.98E-04, p(placement·frequency)= 5.42E-10, p(placement·eye laterality)= 8.71E-03. i, Top: representative beating trace (one dash per beat) of an atrial cardiomyocyte expressing PdCO, activated with different UV-light intensities and inactivated with green light. Bottom: Analysis of beats per minute (BPM) over time. j, Quantification of normalized beating frequency vs applied UV-light intensities from n = x different cells. Solid line depicts dose-response fit used for EC50 estimation. k, Quantification of beating reduction at 81 μW/mm2 UV-light compared to non-illuminated conditions. Statistics: * indicates significance p<0.05; two-tailed paired t-test; p= 5.35E-05. If not stated otherwise all data is shown as mean ± SEM.

References

    1. Emiliani V. et al. Optogenetics for light control of biological systems. Nat Rev Methods Primers 2, 1–25 (2022) doi: 10.1038/s43586-022-00136-4. - DOI - PMC - PubMed
    1. Economo M. N. et al. A platform for brain-wide imaging and reconstruction of individual neurons. eLife 5, e10566 (2016) doi: 10.7554/elife.10566. - DOI - PMC - PubMed
    1. Ciocchi S., Passecker J., Malagon-Vina H., Mikus N. & Klausberger T. Selective information routing by ventral hippocampal CA1 projection neurons. Science 348, 560–563 (2015) doi: 10.1126/science.aaa3245. - DOI - PubMed
    1. Stuber G. D. et al. Excitatory transmission from the amygdala to nucleus accumbens facilitates reward seeking. Nature 475, 377–380 (2011) doi: 10.1038/nature10194. - DOI - PMC - PubMed
    1. Mangieri L. R. et al. A neural basis for antagonistic control of feeding and compulsive behaviors. Nat Commun 9, 52 (2018) doi: 10.1038/s41467-017-02534-9. - DOI - PMC - PubMed

Publication types