[Preprint]. 2023 Jun 26:2023.06.26.546603.
doi: 10.1101/2023.06.26.546603.

Cell Type- and Tissue-specific Enhancers in Craniofacial Development

Affiliations

Cell Type- and Tissue-specific Enhancers in Craniofacial Development

Sudha Sunil Rajderkar et al. bioRxiv. .

Abstract

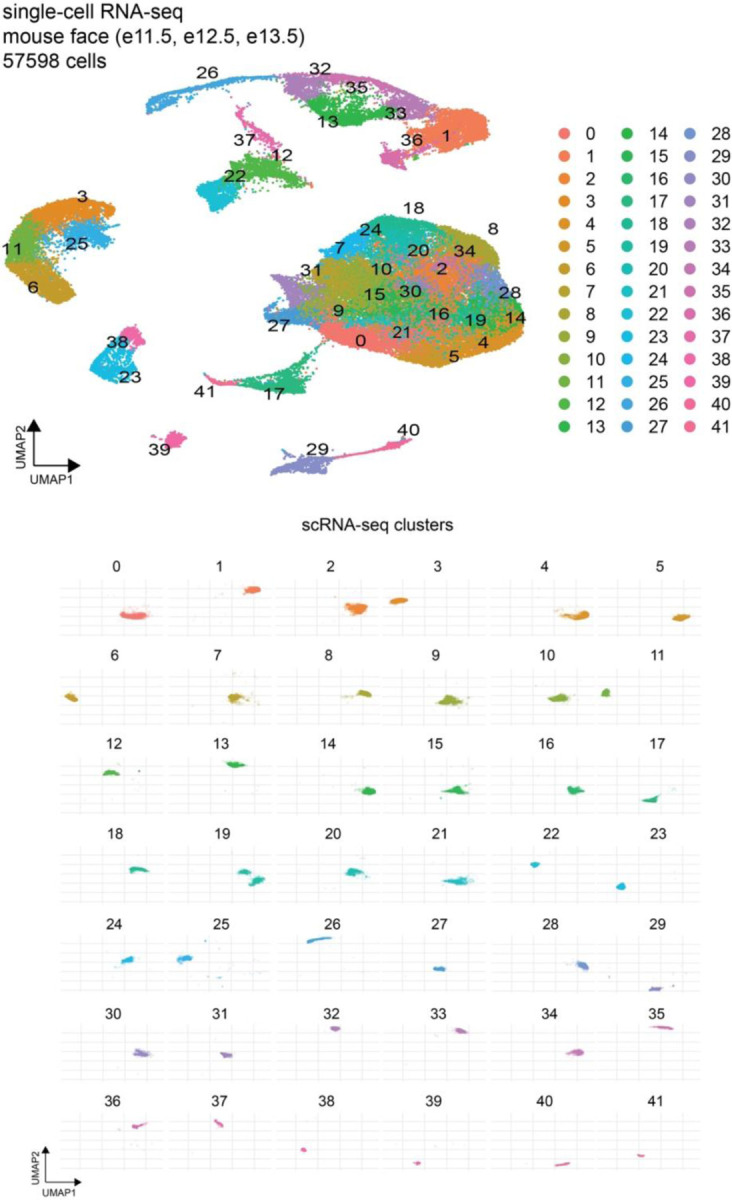
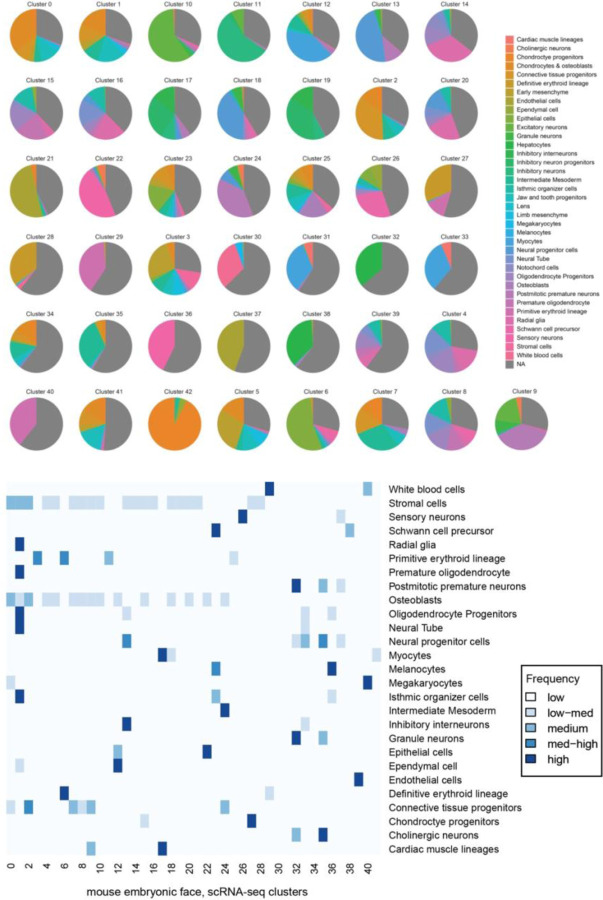
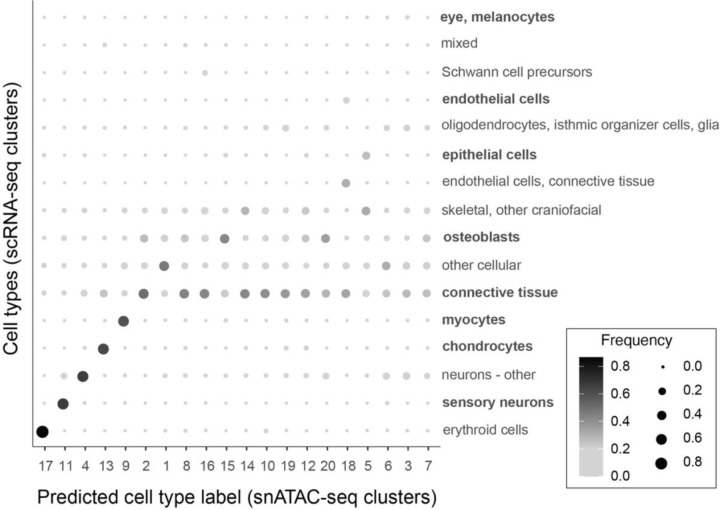
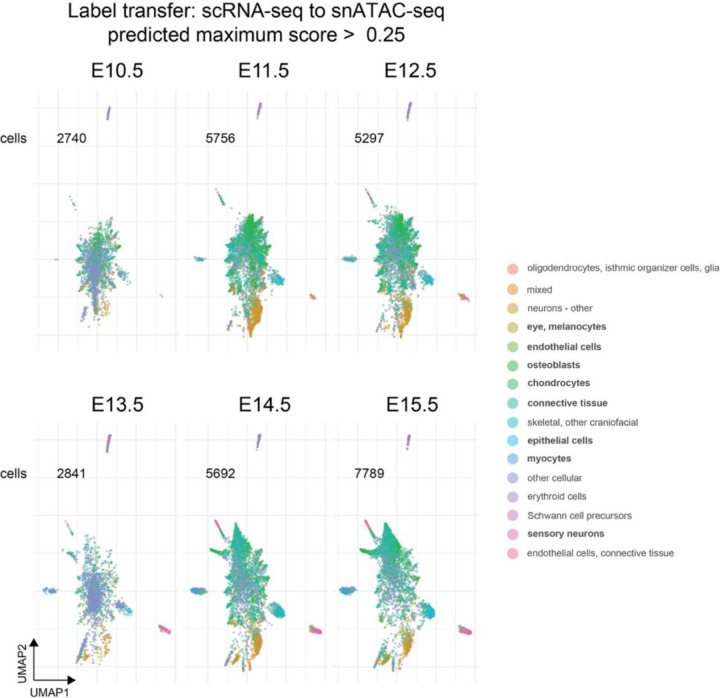
The genetic basis of craniofacial birth defects and general variation in human facial shape remains poorly understood. Distant-acting transcriptional enhancers are a major category of non-coding genome function and have been shown to control the fine-tuned spatiotemporal expression of genes during critical stages of craniofacial development1-3. However, a lack of accurate maps of the genomic location and cell type-specific in vivo activities of all craniofacial enhancers prevents their systematic exploration in human genetics studies. Here, we combined histone modification and chromatin accessibility profiling from different stages of human craniofacial development with single-cell analyses of the developing mouse face to create a comprehensive catalogue of the regulatory landscape of facial development at tissue- and single cell-resolution. In total, we identified approximately 14,000 enhancers across seven developmental stages from weeks 4 through 8 of human embryonic face development. We used transgenic mouse reporter assays to determine the in vivo activity patterns of human face enhancers predicted from these data. Across 16 in vivo validated human enhancers, we observed a rich diversity of craniofacial subregions in which these enhancers are active in vivo. To annotate the cell type specificities of human-mouse conserved enhancers, we performed single-cell RNA-seq and single-nucleus ATAC-seq of mouse craniofacial tissues from embryonic days e11.5 to e15.5. By integrating these data across species, we find that the majority (56%) of human craniofacial enhancers are functionally conserved in mice, providing cell type- and embryonic stage-resolved predictions of their in vivo activity profiles. Using retrospective analysis of known craniofacial enhancers in combination with single cell-resolved transgenic reporter assays, we demonstrate the utility of these data for predicting the in vivo cell type specificity of enhancers. Taken together, our data provide an expansive resource for genetic and developmental studies of human craniofacial development.


Conflict of interest statement

Declaration of Interests Bing Ren is a co-founder of Arima Genomics, Inc, and Epigenome Technologies, Inc.

Figures

Extended Data Figure 1.
Extended Data Figure 1.. Comparison of human face enhancers and VISTA craniofacial enhancers.
Y-axis shows terms for recorded expression of enhancer driven lacZ for elements reported in the VISTA Enhancer Browser, numbers in parentheses denote the total number (N) of such observations in the VISTA catalog. Specific craniofacial terms are denoted in blue, “any craniofacial” comprises the seven craniofacial terms shown here plus “melanocytes”. Terms with fewer than 40 elements, incl. melanocytes, are not shown individually. Bars on the right indicate the percentage of VISTA enhancers (x-axis) for the relevant expression category that overlap human developmental face enhancers in this study (n=13,983). The number in bold by each bar denotes the absolute number of such overlaps out of the total N for each expression category. See Supplemental Table 4 for a full list of elements positive for craniofacial terms.
Extended Data Figure 2.
Extended Data Figure 2.. Unbiased clustering of single-cell gene expression data of the developing mouse face.
For clarity, individual UMAPs are shown to demonstrate the spatial extent along x-y coordinates for each cluster (0–41) that comprises the final UMAP shown in Figure 3.
Extended Data Figure 3.
Extended Data Figure 3.. Cluster-wise marker genes in single-cell (sc) gene expression data of the developing mouse face.
Heatmap shows top 10 marker genes, i.e., genes highly enriched for expression in a cluster over all clusters (y-axis) for each of the 42 original clusters (x-axis) defined in the single-cell gene expression data.
Extended Data Figure 4.
Extended Data Figure 4.. Distribution of cells in the single-cell gene expression data by mouse embryonic stage.
UMAP shows distribution of cells from respective mouse embryonic stages e11.5 (gray: 49,882 cells), e12.5 (black: 2,340 cells) and e13.5 (magenta: 5,376).
Extended Data Figure 5.
Extended Data Figure 5.. Cluster-wise proportion of cell-types in mouse single-cell gene expression data.
Our single-cell gene expression data was queried to a previously published scRNA-seq large dataset of whole embryo developmental timepoints (Cao et al., 2019) using Seurat-based auto referencing as a first step for assigning cell-type identities in an unbiased manner. Heatmap shows frequency (low to high) of cell types from the reference (n=27, y-axis) that are reflected in each of the 42 clusters (x-axis). These collectively informed the first broad annotations of cell types for our ScanFaceX data.
Extended Data Figure 6.
Extended Data Figure 6.. Assignment of cell-type identities in ScanFaceX.
UMAP shows raw results from Seurat-based automated referencing and cell type annotations for ScanFaceX data. A down-sampled (100K cells) subset from Cao et al., 2019 whole-embryo single cell data was used as reference.
Extended Data Figure 7.
Extended Data Figure 7.. Expression of select marker genes across all clusters in ScanFaceX.
Dot plot shows expression of select marker genes across all original clusters (consolidated per final annotations in Supplemental Table 12) of ScanFaceX, a subset of this plot is shown in main Figure 3. Color scale denotes low (light grey) to high (black) expression while increasing circle diameters denote corresponding higher proportion of cells within respective clusters.
Extended Data Figure 8.
Extended Data Figure 8.. Differentially accessible regions in snATAC-seq, mouse face.
Heatmap shows the top 20 DARs map exclusively to each of the 20 clusters in snATAC-seq (mouse face).
Extended Data Figure 9.
Extended Data Figure 9.. Correlation of scRNA-seq and snATAC-seq face data.
Dot plot shows correlation, i.e., strength of label transfer between gene expression quantification (scRNA-seq; y-axis; n=16) and accessibility in TSS and gene bodies (snATAC-seq; x-axis; n=20) for integrated gene expression and open chromatin data for final annotated cell-types. Color scale denotes low (light grey) to high (black) degree of correlation while increasing circle diameters denote corresponding higher proportion of cells within correlated cell types for the respective clusters. Cell types in bold are cell types shown in Figures 3–5.
Extended Figure 10.
Extended Figure 10.. Developmental stage-wise correlation of scRNA-seq and snATAC-seq face data.
Individual UMAPs show the total number of cells in our snATAC-seq assay that pass the >0.25 threshold for the predicted maximum score for label transfer between the integrated scRNA-seq and snATAC-seq datasets for 16 final cell-type annotations (key on the right).
Extended Data Figure 11.
Extended Data Figure 11.. Differentially accessible regulatory regions correlate with cell-type specific signatures.
The genomic context and placental conservation scores for a regulatory region near Mymx promoter are shown, followed by tracks for individual snATAC-seq clusters from developing mouse face tissue (e10.5 – e15.5). This region shows distinct open chromatin signature in the myocyte-specific cluster. UMAP of ScanFaceX shows expression of Mymx in myocytes. Image for a representative mouse embryo at e11.5 shows validated in vivo lacZ-reporter activity (grey arrowheads) of this enhancer. MYMX (Myomixer) encodes an integral membrane protein that regulates myoblast fusion, is conserved across vertebrates and MYMX mutations underlie an autosomal recessive disorder, Carey-Fineman-Ziter syndrome-2 (CFZS2) in humans that is characterized by weakness of the facial musculature, hypomimic facies, micrognathia, and facial dysmorphism among a range of other defects. n, reproducibility of each pattern across embryos resulting from independent transgenic integration events.
Figure 1.
Figure 1.. Developmental enhancers in human craniofacial morphogenesis.
a. Developmental time points coinciding with critical windows of craniofacial morphogenesis are shown by Carnegie stage (CS) and post-conceptional week (PCW) in humans, and comparable embryonic (e) stages for mouse are shown in embryonic days. b. Representative embryo image at e15.5 for an in vivo validated enhancer (hs1431) shows positive lacZ-reporter activity in craniofacial structures (and limbs). Adjacent graphic shows the genomic context and evolutionary conservation of the region, with H3K27ac-bound and open chromatin regions located within the hs1431 element. c. Six examples of human craniofacial enhancers discovered in this study with in vivo activity validated in e11.5 transgenic mouse embryos. Enhancers hs2578, hs2580, hs2724, hs2740, hs2741 and hs2752 show lacZ-reporter activity in distinct subregions of the developing mouse face. Lateral nasal process (lnp), medial nasal process (mnp), maxillary process (mx), and mandibular process (md). n, reproducibility of each pattern across embryos resulting from independent transgenic integration events.
Figure 2.
Figure 2.. Developmental dynamics and conservation of human craniofacial enhancers.
a. Results of rGREAT ontology analysis for 13,983 highly reproducible human craniofacial enhancers, ranked by Human Phenotype q-value. The ontology terms indicate that our predictions of human craniofacial enhancers are enriched near presumptive target genes known to play important roles in craniofacial development (examples in boxes). b. Predicted activity windows of 13,983 candidate human enhancers (rows) arranged by gestational week 4–8 of human development (columns). Blue, active enhancer signature; white, no active enhancer signature. c/d. Left: Genomic position and evolutionary conservation of human candidate enhancer hs2656 (c) and its mouse ortholog mm2280 (d). The human sequence, but not the orthologous mouse sequence, shows evidence of H3K27ac binding at corresponding stages of craniofacial development (beige tracks). Right: Representative embryo images at e12.5 show that human enhancer hs2656, but not its mouse ortholog mm2280, drives reproducible lacZ-reporter expression in the developing nasal and maxillary processes at e12.5. n, reproducibility of each pattern across embryos resulting from independent transgenic integration events.
Figure 3.
Figure 3.. Gene expression in the mammalian craniofacial complex at single cell resolution.
a. Uniform Manifold Approximation and Projection (UMAP) clustering, color-coded by inferred cell types across clusters from aggregated scRNA-seq for the developing mouse face at embryonic days 11.5–13.5, for 57,598 cells across all stages. Cartoon shows the outline of dissected region from the mouse embryonic face at e11.5, corresponding regions were excised at other stages. b. Same UMAP clustering, color-coded by main cell lineages. c. Expression of select marker genes in cell types shown in (a). d. UMAP plots comprising cells with >1.5-fold gene expression for marker genes representing specific cell types as shown in (a) and (c).
Figure 4.
Figure 4.. Differential chromatin accessibility at craniofacial in vivo enhancers correlates with cell type-specific expression of nearby genes.
a. Unbiased clustering (UMAP) of open chromatin regions from snATAC-seq of the developing mouse face for stages e10.5–15.5 for approximately 41,000 cells. The cell types are assigned based on label transfer (Seurat) from cell-type annotations of the ScanFaceX data. b. Correlation between normalized gene expression (x-axis) from ScanFaceX and normalized accessibility (y-axis) from snATAC-seq for select genes (Epcam, Dsp, Cthrc1, Cldn5) and their transcription start sites with the highest correlation evident in relevant cell types. c. Genomic context and evolutionary conservation (in placentals) for corresponding regulatory regions in the vicinity of the Isl2/Scaper locus, and an intronic distal enhancer within Lrrk1. Tracks for individual snATAC-seq clusters from developing mouse face tissue (e10.5 to e15.5), with cluster-specific open chromatin signatures for relevant annotated cell types are shown for the same genomic regions. UMAP of ScanFaceX data shows expression of Isl2 and Aldh1a3 (gene adjacent to Lrrk1) in expected cell-types. Images for a representative mouse embryo at e11.5 for both loci show validated in vivo lac-Z-reporter activity of the respective regions. n, reproducibility of each pattern across embryos resulting from independent transgenic integration events.
Figure 5.
Figure 5.. Cell type-specific chromatin accessibility of craniofacial in vivo enhancers.
a. Heatmap indicates the chromatin accessibility of 77 craniofacial in vivo enhancers in 11 major cell type clusters. cpm: counts per million. b. Representative images of transgenic embryos from VISTA Enhancer Browser, showing in vivo activity pattern of 35 selected enhancers at e11.5. Embryo images are grouped by example cluster-types from (a) in this retrospective assignment.
Figure 6.
Figure 6.. Cell type-specific enhancer activity at single-cell resolution.
a. in vivo activity pattern of select craniofacial enhancers (hs1431, hs746, hs521) at e11.5, visualized by lacZ-reporter assays (top). In separate experiments, the same enhancers were coupled to an mCherry-fluorescent reporter gene and examined by scRNA-seq of craniofacial tissues of resulting embryos. UMAPs show enhancer-driven mCherry expression (see Fig. 3a for reference). b. Location of enhancers hs1431, hs746 and hs521 in their respective genomic context (red vertical lines), along with protein-coding genes within the genomic regions and local conservation profile (PhyloP). c. Average expression of genes (Seurat) in the vicinity of the respective enhancers, and proportion (percent) of cells expressing the genes in specific cell types. Enhancer-driven mCherry signal is plotted in the center in lieu of the approximate enhancer location in its endogenous genomic context. Bottom panels show expression of Snai2, Msx1, and Gbx2 as likely candidate target genes for each of the enhancers hs1431, hs746 and hs521 across UMAPs. IsO: Isthmic Organizer Cells.

References

    1. Attanasio C., Nord A.S., Zhu Y., Blow M.J., Li Z., Liberton D.K., Morrison H., Plajzer-Frick I., Holt A., Hosseini R., et al. (2013). Fine tuning of craniofacial morphology by distant-acting enhancers. Science 342, 1241006. - PMC - PubMed
    1. Fakhouri W.D., Rahimov F., Attanasio C., Kouwenhoven E.N., Ferreira De Lima R.L., Felix T.M., Nitschke L., Huver D., Barrons J., Kousa Y.A., et al. (2014). An etiologic regulatory mutation in IRF6 with loss- and gain-of-function effects. Hum. Mol. Genet. 23, 2711–2720. - PMC - PubMed
    1. Rahimov F., Marazita M.L., Visel A., Cooper M.E., Hitchler M.J., Rubini M., Domann F.E., Govil M., Christensen K., Bille C., et al. (2008). Disruption of an AP-2alpha binding site in an IRF6 enhancer is associated with cleft lip. Nat. Genet. 40, 1341–1347. - PMC - PubMed
    1. Richmond S., Howe L.J., Lewis S., Stergiakouli E., and Zhurov A. (2018). Facial Genetics: A Brief Overview. Front. Genet. 9, 462. - PMC - PubMed
    1. Maden M. (2001). Vitamin A and the developing embryo. Postgrad. Med. J. 77, 489–491. - PMC - PubMed

Publication types