Composition of subgingival microbiota associated with periodontitis and diagnosis of malignancy-a cross-sectional study
- PMID: 37426027
- PMCID: PMC10325785
- DOI: 10.3389/fmicb.2023.1172340
Composition of subgingival microbiota associated with periodontitis and diagnosis of malignancy-a cross-sectional study
Abstract
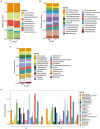
Periodontitis is one of the world's most prevalent infectious conditions, affecting between 25 and 40% of the adult population. It is a consequence of the complex interactions between periodontal pathogens and their products, which trigger the host inflammatory response, chronic inflammation, and tissue destruction. Chronic systemic low-grade inflammation is involved in numerous diseases, and it is also known that long-lasting inflammation and chronic infections predispose one to cancer. Here, we characterized and compared the subgingival microbiota associated with periodontitis and diagnosis of malignancy in a longitudinal 10-year follow-up study. The study was conducted on 50 patients with periodontitis and 40 periodontally healthy individuals. The recorded clinical oral health parameters were periodontal attachment loss (AL), bleeding on probing (BOP), gingival index (GI), probing depth (PD), and plaque index (PI). Subgingival plaque was collected from each participant, from which DNA was extracted, and 16S rRNA gene amplicon sequencing performed. Cancer diagnoses data were collected between the years 2008-2018 from the Swedish Cancer Registry. The participants were categorized based on having cancer at the time of sample collection (CSC), having developed cancer later (DCL), and controls without any cancer. The most abundant phyla across all 90 samples were Actinobacteria, Proteobacteria, Firmicutes, Bacteroidetes, and Fusobacteria. At the genus level, Treponema, Fretibacterium, and Prevotella were significantly more abundant in samples of periodontitis patients compared to non-periodontitis individuals. With regard to samples of cancer patients, Corynebacterium and Streptococcus were more abundant in the CSC group; Prevotella were more abundant in the DCL group; and Rothia, Neisseria, and Capnocytophaga were more abundant in the control group. In the CSC group, we also found that the presence of periodontal inflammation, in terms of BOP, GI, and PLI, significantly correlated with species belonging to the genera Prevotella, Treponema, and Mycoplasma. Our results revealed that several subgingival genera were differentially enriched among the studied groups. These findings underscore the need for further research to fully understand the role that oral pathogens may play in the development of cancer.
Keywords: 16S rRNA gene sequencing; cancer; malignancy; oral microbiota; periodontitis; supragingival plaque.
Copyright © 2023 Narayanan, Söder, Meurman, Lundmark, Hu, Neogi and Yucel-Lindberg.
Conflict of interest statement
The authors declare that the research was conducted in the absence of any commercial or financial relationships that could be construed as a potential conflict of interest.
Figures


References
-
- Anderson M. J. (2017). Permutational multivariate analysis of variance (PERMANOVA). Wiley StatsRef: Statistics Reference Online, 1–15. doi: 10.1002/9781118445112.stat07841 - DOI
-
- Andrews S. (2015). FASTQC a quality control tool for high throughput sequence data. Babraham Institute. Available at: https://www.bibsonomy.org/bibtex/f230a919c34360709aa298734d63dca3
LinkOut - more resources
Full Text Sources
Research Materials
Miscellaneous

