. 2023 Jun 22:3:1197310.
doi: 10.3389/fbinf.2023.1197310. eCollection 2023.

A guide for developing comprehensive systems biology maps of disease mechanisms: planning, construction and maintenance

Affiliations

A guide for developing comprehensive systems biology maps of disease mechanisms: planning, construction and maintenance

Alexander Mazein et al. Front Bioinform. .

Abstract

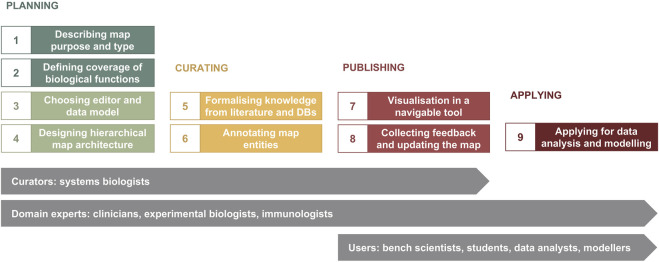
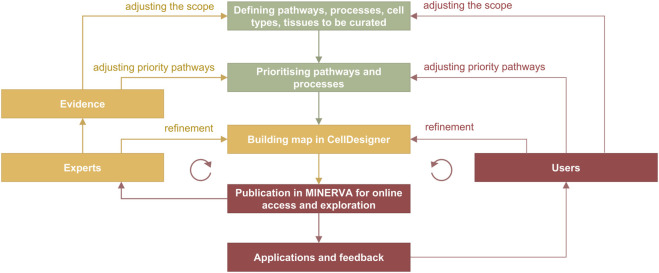
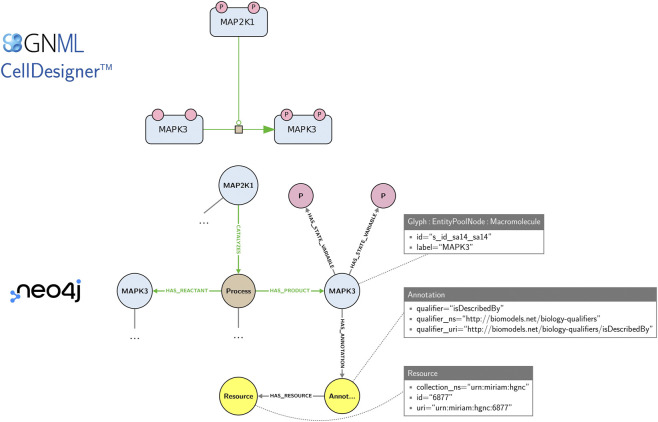
As a conceptual model of disease mechanisms, a disease map integrates available knowledge and is applied for data interpretation, predictions and hypothesis generation. It is possible to model disease mechanisms on different levels of granularity and adjust the approach to the goals of a particular project. This rich environment together with requirements for high-quality network reconstruction makes it challenging for new curators and groups to be quickly introduced to the development methods. In this review, we offer a step-by-step guide for developing a disease map within its mainstream pipeline that involves using the CellDesigner tool for creating and editing diagrams and the MINERVA Platform for online visualisation and exploration. We also describe how the Neo4j graph database environment can be used for managing and querying efficiently such a resource. For assessing the interoperability and reproducibility we apply FAIR principles.

Keywords: curation; disease mechanisms; pathway biology; systems biology; translational research.


Conflict of interest statement

Authors DR and AK were employed by company ITTM Information Technology for Translational Medicine. The remaining authors declare that the research was conducted in the absence of any commercial or financial relationships that could be construed as a potential conflict of interest.

Figures

FIGURE 1
FIGURE 1
The map development workflow [based on Kondratova et al., 2018 (Kondratova et al., 2018)]. The workflow includes nine steps in four phases (please see in the text). Curators and domain experts are involved in planning and designing the map, then curators develop the map using a diagram editor of choice, advised by domain experts. After publishing online, data analysts, modellers and other users have access to the map for exploration and applications in translational projects, as well as domain experts suggest further evolving the map.
FIGURE 2
FIGURE 2
An example that compares two representations in CellDesigner that correspond to Activity Flow (Reduced Notation palette in CellDesigner) and Process Description (default palette in CellDesigner). The two diagrams represent the same biological events but in two conceptually different languages. (A). The Process Description representation of the RAF-MEK-ERK signalling: the process of MEK1/2 phosphorylation is catalysed by RAF1 and the process of ERK1/2 phosphorylation is catalysed by the phosphorylated MEK1/2. (B). The Activity Flow representation of the RAF-MEK-ERK signalling: the activity of RAF1 stimulates the activity of MEK1/2 (MAP2K1 and MAP2K2 in official HGNC names), and the activity of MEK1/2 stimulates the activity of ERK1/2 (MAPK3 and MAPK1 in official HGNC names).
FIGURE 3
FIGURE 3
A recommended way to gradually build a hierarchical structure starting from a single PD diagram and step by step making the map architecture more complex. Each map version works as a fully functional complete resource. (A). Starting with a priority sub-pathway in PD. (B). Building a top-level view with key mechanisms partly or entirely represented in the PD diagram. (C). Automatically or manually creating an AF diagram that matches the content of the PD diagram. (D). Extending the content to multiple diagrams with one integrating top-level view diagram that represents more detailed AF and PD layers.
FIGURE 4
FIGURE 4
Curation and refinement cycle in disease map development. In green are the stages from the planning phase, in yellow from the curation phase and in red from the publication and application stages. The cycle on the left includes feedback from domain experts involved in the development, and the cycle on the right includes feedback from users. Evidence are integrated from PubMed and PubMed Central searches, from working with pathway databases such as Reactome (Gillespie et al., 2022), Recon (Thiele et al., 2013; Noronha et al., 2017) and PANTHER (Mi et al., 2019), and annotation databases such as UniProt (https://www.uniprot.org) and ChEBI (https://www.ebi.ac.uk/chebi).
FIGURE 5
FIGURE 5
An SBGN map and an excerpt of its corresponding Neo4j graph built using the StonPy software. SBGN nodes (e.g., proteins, states variables) are modelled using Neo4j nodes, while SBGN arcs (e.g., catalyses, production arcs) and relationships between concepts are modelled using Neo4j relationships (edges). Neo4j nodes are labelled (e.g., “Glyph”, “Macromolecule”) and may contain key-value pairs (e.g., the pair “label”/“MAPK3”). Additionally, annotations are stored in a structured form that can be easily queried. In the complete model (not shown), SBGN arcs are additionally modelled using Neo4j nodes, as they may contain SBGN nodes themselves.

Similar articles

Cited by

References

    1. Aghakhani S., Soliman S., Niarakis A. (2022). Metabolic reprogramming in rheumatoid arthritis synovial fibroblasts: A Hybrid modeling approach. PLoS Comput. Biol. 18 (12), e1010408. 10.1371/journal.pcbi.1010408 - DOI - PMC - PubMed
    1. Aghamiri S. S., Singh V., Naldi A., Helikar T., Soliman S., Niarakis A. (2020). Automated inference of Boolean models from molecular interaction maps using CaSQ. Bioinforma. Oxf. Engl. 36, 4473–4482. 10.1093/bioinformatics/btaa484 - DOI - PMC - PubMed
    1. Balaur I., Mazein A., Saqi M., Lysenko A., Rawlings C. J., Auffray C. (2016). Recon2Neo4j: Applying graph database technologies for managing comprehensive genome-scale networks. Bioinforma. Oxf. Engl. 33, 1096–1098. 10.1093/bioinformatics/btw731 - DOI - PMC - PubMed
    1. Balaur I., Roy L., Mazein A., Karaca S. G., Dogrusoz U., Barillot E., et al. (2020). cd2sbgnml: bidirectional conversion between CellDesigner and SBGN formats. Bioinforma. Oxf. Engl. 36, 4975. 10.1093/bioinformatics/btaa528 - DOI - PubMed
    1. Balaur I., Roy L., Touré V., Mazein A., Auffray C. (2022). GraphML-SBGN bidirectional converter for metabolic networks. J. Integr. Bioinforma. 19, 20220030. 10.1515/jib-2022-0030 - DOI - PMC - PubMed