. 2023 Jun 22:16:1182499.
doi: 10.3389/fnmol.2023.1182499. eCollection 2023.

Revisiting the expression of BDNF and its receptors in mammalian development

Affiliations

Revisiting the expression of BDNF and its receptors in mammalian development

Eli-Eelika Esvald et al. Front Mol Neurosci. .

Abstract

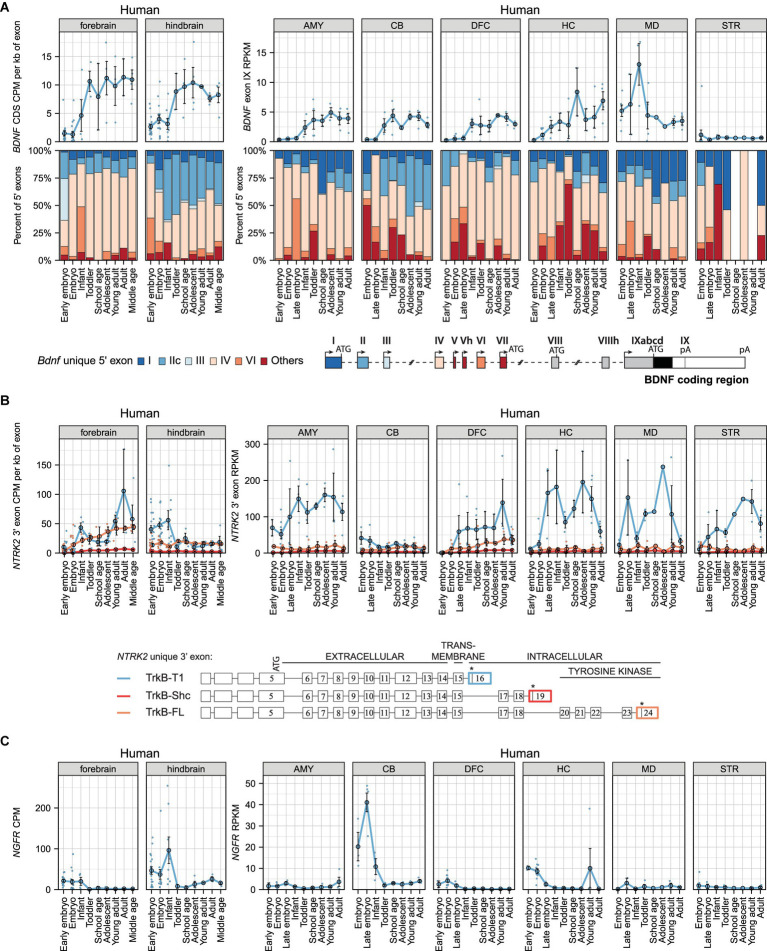
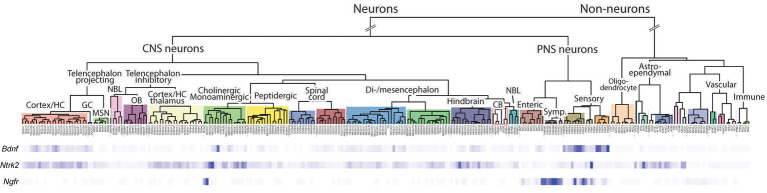
Brain-derived neurotrophic factor (BDNF) promotes the survival and functioning of neurons in the central nervous system and contributes to proper functioning of many non-neural tissues. Although the regulation and role of BDNF have been extensively studied, a rigorous analysis of the expression dynamics of BDNF and its receptors TrkB and p75NTR is lacking. Here, we have analyzed more than 3,600 samples from 18 published RNA sequencing datasets, and used over 17,000 samples from GTEx, and ~ 180 samples from BrainSpan database, to describe the expression of BDNF in the developing mammalian neural and non-neural tissues. We show evolutionarily conserved dynamics and expression patterns of BDNF mRNA and non-conserved alternative 5' exon usage. Finally, we also show increasing BDNF protein levels during murine brain development and BDNF protein expression in several non-neural tissues. In parallel, we describe the spatiotemporal expression pattern of BDNF receptors TrkB and p75NTR in both murines and humans. Collectively, our in-depth analysis of the expression of BDNF and its receptors gives insight into the regulation and signaling of BDNF in the whole organism throughout life.

Keywords: BDNF; RNA-Seq; TrkB; Western blot; development; evolution; p75NTR.


Conflict of interest statement

E-EE, JT, AP, KP, and TT were employed by Protobios LLC. JT was employed by dxlabs LLC. The remaining authors declare that the research was conducted in the absence of any commercial or financial relationships that could be construed as a potential conflict of interest.

Figures

Figure 1
Figure 1
The expression levels of mRNAs encoding BDNF and its receptors TrkB (Ntrk2 mRNA) and p75NTR (Ngfr mRNAs) during murine development in different brain regions. Meta-analysis of Bdnf, Ntrk2 (encoding TrkB) and Ngfr (encoding p75NTR) expression levels in mouse (A,C,E) and rat (B,D,F) brain regions throughout development. Levels in embryo (E10.5-E14.5/E11-E15 mouse/rat), late embryo (E15.5-E18.5/E17-E20 mouse/rat), postnatal (P0-P14), adolescent (P22-56) and adult (P62+) animals are shown. (A,B) Total Bdnf expression measured by levels of Bdnf coding sequence (CDS, upper panel) and distribution of Bdnf 5′ exons (lower panel) are shown as depicted on the schematics of murine gene structure with different colors. The exons indicated with gray color were not included in the analysis of 5′ exons. (C,D) The mRNA levels of different TrkB isoforms based on the levels of unique 3′ exons of the Ntrk2 gene (rat or mouse counterpart of human NTRK2 exons 16, 19, 24). The 3′ exons specific for TrkB isoforms TrkB-T1, TrkB-Shc, and TrkB-FL were measured as shown with colors on the schematics [adapted from Luberg et al. (2010)]. Asterisks on the schematics mark stop-codons. (E,F) Total Ngfr mRNA expression levels. Data from individual animals are shown as small dots, circles indicate mean values and error bars represent standard error of the mean (SEM). All used datasets and underlying data are shown in Supplementary Table 3. WB – whole brain, CTX – cerebral cortex, CB – cerebellum, HC – hippocampus, HTH – hypothalamus, MB – midbrain, NT – neural tube, CDS – coding sequence, CPM – counts per million.
Figure 2
Figure 2
The expression levels of mRNAs encoding BDNF and its receptors TrkB (Ntrk2 mRNAs) and p75NTR (Ngfr mRNAs) during development in murine non-neural tissues. Meta-analysis of Bdnf, Ntrk2 (encoding TrkB) and Ngfr (encoding p75NTR) expression in mouse (A,C,E) and rat (B,D,F) non-neural tissues during development. The expression levels in embryo (E10.5-E14.5/E11-E15 mouse/rat), late embryo (E15.5-E18.5/E17-E20 mouse/rat), postnatal (P0-P14), adolescent (P22-56) and adult (P62+) animals are shown. (A,B) Total Bdnf expression measured by levels of Bdnf coding sequence (CDS, upper panel) and distribution of levels of Bdnf 5′ exons (lower panel) are shown as depicted on the schematics of murine gene structure. The exons indicated with gray color were not included in the analysis of 5′ exons. White box in the proportion of Bdnf 5′ exons indicates that the expression of Bdnf was too low for this calculation. (C,D) The mRNA levels of different TrkB isoforms based on the levels of unique 3′ exons of the Ntrk2 gene (rat or mouse counterpart of human exon 16, 19, 24). The 3′ exons specific for TrkB isoforms TrkB-T1, TrkB-Shc, and TrkB-FL are shown on the schematics (adapted from Luberg et al. (2010)). Asterisks on the schematics mark stop-codons. (E,F) Total Ngfr mRNA expression levels. Data from individual animals are shown as small dots, circles indicate mean values and error bars represent standard error of the mean (SEM). All used datasets and underlying data are shown in Supplementary Table 7. CDS – coding sequence, CPM – counts per million.
Figure 3
Figure 3
The expression levels of mRNAs encoding BDNF and its receptors TRKB (NTRK2 mRNAs) and p75NTR (NGFR mRNAs) in human brain regions throughout development. Visualization of BDNF, NTRK2 (encoding TRKB) and NGFR (encoding P75NTR) expression data from Cardoso-Moreira et al. (2019) (left panels) and human developmental transcriptome data from BrainSpan project (right panels). The expression levels in early embryo [0–9 postcoital week (PCW)], embryo (10–19 PCW), late embryo (20–39 PCW), infant (younger than 12 months), toddler (1–4 years old), school age (7–8 years old), adolescent (10–17 years old), young adult (18–29.99 years old), adult (30–39.99 years old), and middle-aged (40–58 years old) humans are shown. (A) Total BDNF expression measured by levels of BDNF coding sequence (CDS, upper panel) and distribution of levels of BDNF 5′ exons (lower panel) are shown as depicted on the schematics of human gene structure. The exons indicated with gray color were not included in the analysis of 5′ exons. (B) The mRNA levels of different TrkB isoforms based on the levels of unique 3′ exons of NTRK2 gene (exon 16, 19, 24). The 3′ exons specific for TRKB isoforms TRKB-T1, TRKB-SHC, and TRKB-FL are shown on the scheme (adapted from Luberg et al. (2010)). Asterisks on the schematics mark stop-codons. (C) Total NGFR mRNA expression levels. Data from individual animals are shown as small dots, circles indicate mean values and error bars represent standard error of the mean (SEM). All used datasets and underlying data are shown in Supplementary Table 10. AMY – amygdaloid complex, CB – cerebellar cortex, DFC – dorsolateral prefrontal cortex, HC – hippocampus (hippocampal formation), MD – mediodorsal nucleus of thalamus, STR – striatum, CDS – coding sequence, CPM – counts per million.
Figure 4
Figure 4
The expression levels of mRNAs encoding BDNF and its receptors TRKB (NTRK2 mRNAs) and p75NTR (NGFR mRNAs) in human non-neural tissues. The expression levels of BDNF, NTRK2 (encoding TRKB), and NGFR (encoding P75NTR) mRNAs in early embryo [0–9 postcoital week (PCW), embryo (10–19 PCW), late embryo (20–39 PCW), infant (younger than 12 months), toddler (1–4 years old), school age (7–8 years old), adolescent (10–17 years old), young adult (18–29.99 years old), adult (30–39.99 years old), and middle-aged (40–58 years old) humans are shown (data from Cardoso-Moreira et al. (2019)]. (A) Total BDNF mRNA levels measured by levels of BDNF coding sequence (CDS, upper panel) and distribution of levels of BDNF 5′ exons FIGURE 4 (Continued)(lower panel) are shown as depicted on the schematics of human BDNF gene structure. The exons indicated with gray color were not included in the analysis of 5′ exons. (B) The mRNA levels of different TRKB isoforms based on the levels of unique 3′ exons of NTRK2 gene (exon 16, 19, 24). The 3′ exons specific for TRKB isoforms TRKB-T1, TRKB-SHC, and TRKB-FL are shown on the scheme (adapted from Luberg et al. (2010)). Asterisks on the scheme mark stop-codons. (C) Total NGFR mRNA expression levels. All used datasets and underlying data are shown in Supplementary Table 11. Data from individual animals are shown as small dots, circles indicate mean values and error bars represent standard error of the mean (SEM). CDS – coding sequence, CPM – counts per million.
Figure 5
Figure 5
BDNF mRNA expression levels in the brain of different mammals. Total BDNF mRNA levels in forebrain (A) and hindbrain (B) measured by levels of BDNF coding sequence (CDS, upper panels) and distribution of levels of BDNF 5′ exon-specific mRNAs (lower panels) are shown with the exons depicted below in the schematics of murine Bdnf gene structure. The exons indicated with gray color were not included in the analysis of expressed 5′ exons. BDNF mRNA levels in humans are shown in early embryo (0–9 postcoital week (PCW)), embryo (10–19 PCW), late embryo (20–39 PCW), infant (younger than 12 months), toddler (1–4 years old), school age (7–8 years old), adolescent (10–17 years old), young adult (18–29.99 years old), adult (30–39.99 years old), and middle-aged (40–58 years old); in rhesus macaques in embryo (E93-E109), late embryo (PE112-E130), postnatal (P0-P24), pre-adolescent (0.5–1 years old), adolescent (2–3 years old), young adult (8–11 years old), adult (14–15 years old), and middle-aged (20–26 years old) animals; in mouse and rats in embryo (E10.5-E14.5/E11-E15 mouse/rat), late embryo (E15.5-E18.5/E17-E20 mouse/rat), postnatal (P0-P14), adolescent (P22-56), and adult (P62+) animals; in rabbits in embryo (E12-E19.5), late embryo (E21-E27), postnatal (P10-P14), adolescent (P84), and adult (P186-P548) animals; in opossums in late embryo (E13.5), young postnatal (P0-P6), late postnatal (P10-P21), young adolescent (P28-P60), adolescent (P90-P120), and adult (P150-P180) animals [data from (2019)]. All used datasets and underlying data are shown in Supplementary Table 13. Data from individual animals are shown as small dots, circles indicate mean values and error bars represent standard error of the mean (SEM). CDS – coding sequence, CPM – counts per million.
Figure 6
Figure 6
The proportion of BDNF transcripts with long 3′ untranslated region in the brain of different mammals. The ratio of BDNF transcripts with long 3′ untranslated region (UTR) is shown in forebrain (A) and hindbrain (B) relative to total BDNF mRNA levels measured by levels of BDNF coding sequence (CDS). All used datasets and underlying data are shown in Supplementary Table 15. For more information on age classifications, see legend of Figure 5 (data from Cardoso-Moreira et al., 2019). Data from individual animals are shown as small dots, circles indicate mean values and error bars represent standard error of the mean (SEM). CDS – coding sequence.
Figure 7
Figure 7
The expression of Bdnf, TrkB (Ntrk2 gene), and p75NTR (Ngfr gene) mRNA in adolescent mouse nervous systems according to single cell RNA sequencing. Single cell RNA sequencing data of postnatal day 10–30 mice from Zeisel et al. (2018) was visualized using Mouse Brain Atlas from the Linnarson lab (http://mousebrain.org/). A deeper blue color indicates stronger expression of the indicated gene. The different cell types and their origins are shown above.
Figure 8
Figure 8
The epitope of Icosagen 3C11 anti-BDNF antibody resides between BDNF amino acids 147–155. (A) The specificity of the anti-BDNF 3C11 antibody (Icosagen) was tested in cultured rat cortical neurons. Bdnf gene expression was silenced using CRISPR interference system (dCas9-KRAB) targeting Bdnf promoters I and IV. The neurons were treated at 8 DIV with 25 mM KCl for 6 h. Total Bdnf mRNA levels were measured by RT-qPCR. (B) BDNF protein levels in adult murine cerebral cortex and in BDNF-silenced and KCl-treated cultured cortical neurons along with recombinant proBDNF and mature BDNF were measured by Western blot. Note that the endogenous proBDNF in rat neurons has slower mobility compared to the bacterially expressed recombinant human proBDNF probably due to glycosylation. Red asterisk marks an unspecific signal. (C) The efficiency of the anti-BDNF 3C11 antibody to detect proBDNF and mature BDNF was also tested in HEK293 cells by overexpressing BDNF-V5 and performing Western blot with anti-V5 and anti-BDNF antibody. (D,F,G,H) The epitope of the anti-BDNF 3C11 antibody (Icosagen) was determined using mimotope variation analysis (MVA). x-axis indicates the amino acid position of mouse BDNF (D), NGF (F), NT-3, (G), or NT-4 (H) protein (Uniprot IDs P21237, P01139, P20181, Q80VU4, respectively). Pre, pro and mature neurotrophin domains are shown below the graph. Alignment load for each amino acid position was calculated as the sum of normalized counts of aligning 12-mer peptides (with maximum 6 mismatches) obtained from MVA or from direct sequencing of the input phage library. y-axis depicts anti-BDNF antibody alignment load fold enrichment compared to the alignment load of the input library. Specific signal of antibody binding can be seen for amino acids 147SEWVTAADK155, residing in the N-terminal region of mature BDNF. (E) Depiction of the identified epitope (Ser147-Lys155) on the 3D structure model of the mature BDNF protein (residues Ser132-Arg249). The epitope (in orange) of the 3C11 anti-BDNF antibody (combined cartoon and surface representation, gray). The protein model was obtained from the AlphaFold Protein Structure Database (AF-P21237-F1-model-v4) and visualized using PyMOL.
Figure 9
Figure 9
The dynamics of BDNF protein expression in BALB/c mouse, C57BL/6 J mouse and Wistar rat brain regions during development. BDNF protein levels measured by Western blot in BALB/c and C57BL/6 J mouse, and Wistar rat different brain regions throughout development. Fifty micro gram total protein lysate was loaded per lane. (A) BDNF protein levels in the whole brain of BALB/c and C57BL/6 J mice (upper panel) and densitometric quantification (lower panel). The maximal BDNF expression level in the respective mouse line in the respective brain region was set as 1. BDNF protein levels in different brain regions of (B) BALB/c mouse, (C) C57BL/6 J mouse, and (D) Wistar rat during development. (E) Densitometric quantification of BDNF protein expression levels. The maximal BDNF expression level in the respective animal model brain region was set as 1. E – embryonic day, P – postnatal day, OB – olfactory bulb, CTX – cerebral cortex, STR – striatum, HC – hippocampus, HTH – hypothalamus, TH – thalamus, MB – midbrain, CB – cerebellum, NA – not analyzed.
Figure 10
Figure 10
The expression of BDNF protein in adult BALB/c and C57BL/6 J mice, and Wistar rat brain regions. Shown are BDNF protein levels measured by Western blot in BALB/c (A) and C57BL/6 J (B) mouse, and Wistar rat (C) different brain regions at postnatal day 60 (P60). Fifty micro gram total protein lysate was loaded per lane. (D) Densitometric quantification of BDNF protein and calculated amounts using calibration curve based on recombinant BDNF protein levels. P – postnatal day, OB – olfactory bulb, CTX – cerebral cortex, STR – striatum, HC – hippocampus, HTH – hypothalamus, TH – thalamus, MB – midbrain, CB – cerebellum, WB – whole brain, NA – not analyzed.
Figure 11
Figure 11
BDNF protein levels in non-neural tissues of BALB/c and C57BL/6 J mice and Wistar rat during development. BDNF protein levels measured by Western blot in BALB/c (A) and C57BL/6 J (B) mouse, and Wistar rat (C) non-neural tissues throughout development. Fifty micro gram total protein lysate was loaded per lane. (D) Quantification of BDNF protein levels based on recombinant BDNF (rec BDNF) signals that were used to calculate calibration curve for each blot. Numbers in the heatmap show BDNF protein quantity in pg. per 50 μg of total protein. Red asterisk marks an unspecific signal in mice plasma and blood cells, possibly masking the BDNF protein signal (A,B) and therefore no quantification of BDNF protein was performed [NA in white boxes in panel (D)]. NA – not available, P – postnatal day.

Similar articles

Cited by

References

    1. Abdollahi M., Fahnestock M. (2022). Nurr1 is not an essential regulator of BDNF in mouse cortical neurons. Int. J. Mol. Sci. 23:6853. doi: 10.3390/ijms23126853 - DOI - PMC - PubMed
    1. Afsar B., Afsar R. E. (2022). Brain-derived neurotrophic factor (BDNF): a multifaceted marker in chronic kidney disease. Clin. Exp. Nephrol. 26, 1149–1159. doi: 10.1007/s10157-022-02268-z - DOI - PubMed
    1. Ahuja P., Ng C. F., Pang B. P. S., Chan W. S., Tse M. C. L., Bi X., et al. . (2021). Muscle-generated BDNF (brain derived neurotrophic factor) maintains mitochondrial quality control in female mice. Autophagy 18, 1367–1384. doi: 10.1080/15548627.2021.1985257, PMID: - DOI - PMC - PubMed
    1. Aid T., Kazantseva A., Piirsoo M., Palm K., Timmusk T. (2007). Mouse and rat BDNF gene structure and expression revisited. J. Neurosci. Res. 85, 525–535. doi: 10.1002/jnr.21139, PMID: - DOI - PMC - PubMed
    1. Altar C. A., Cai N., Bliven T., Juhasz M., Conner J. M., Acheson A. L., et al. . (1997). Anterograde transport of brain-derived neurotrophic factor and its role in the brain. Nature 389, 856–860. doi: 10.1038/39885 - DOI - PubMed

LinkOut - more resources