. 2023 Jun 7;26(7):107051.
doi: 10.1016/j.isci.2023.107051. eCollection 2023 Jul 21.

Coordinated linear and rotational movements of endothelial cells compartmentalized by VE-cadherin drive angiogenic sprouting

Affiliations

Coordinated linear and rotational movements of endothelial cells compartmentalized by VE-cadherin drive angiogenic sprouting

Kazuo Tonami et al. iScience. .

Abstract

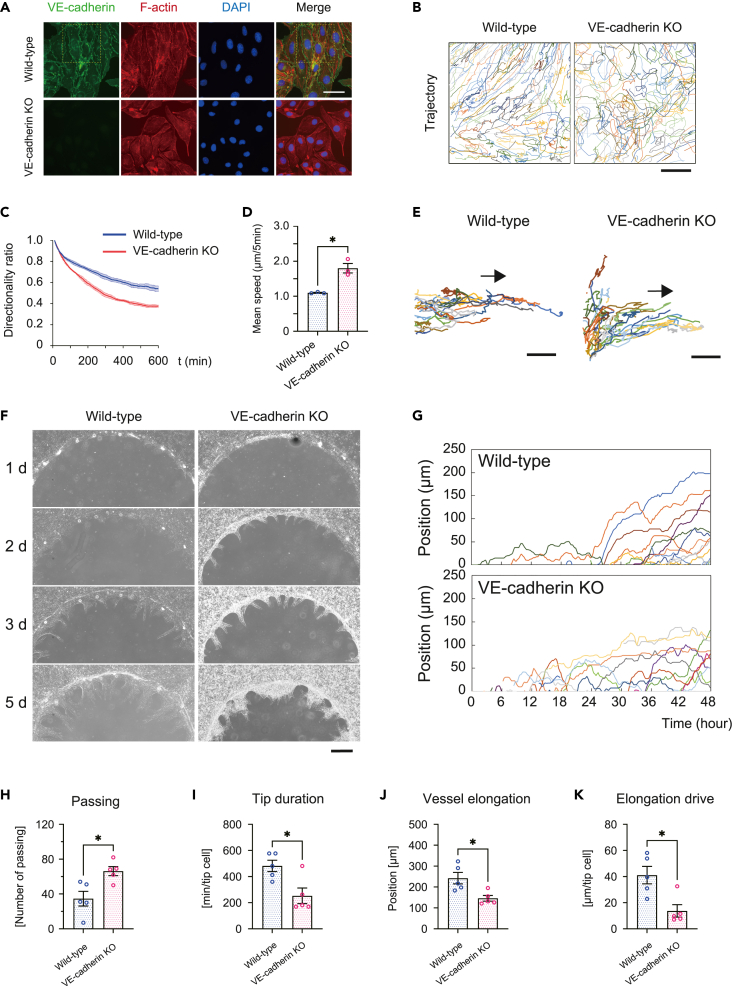
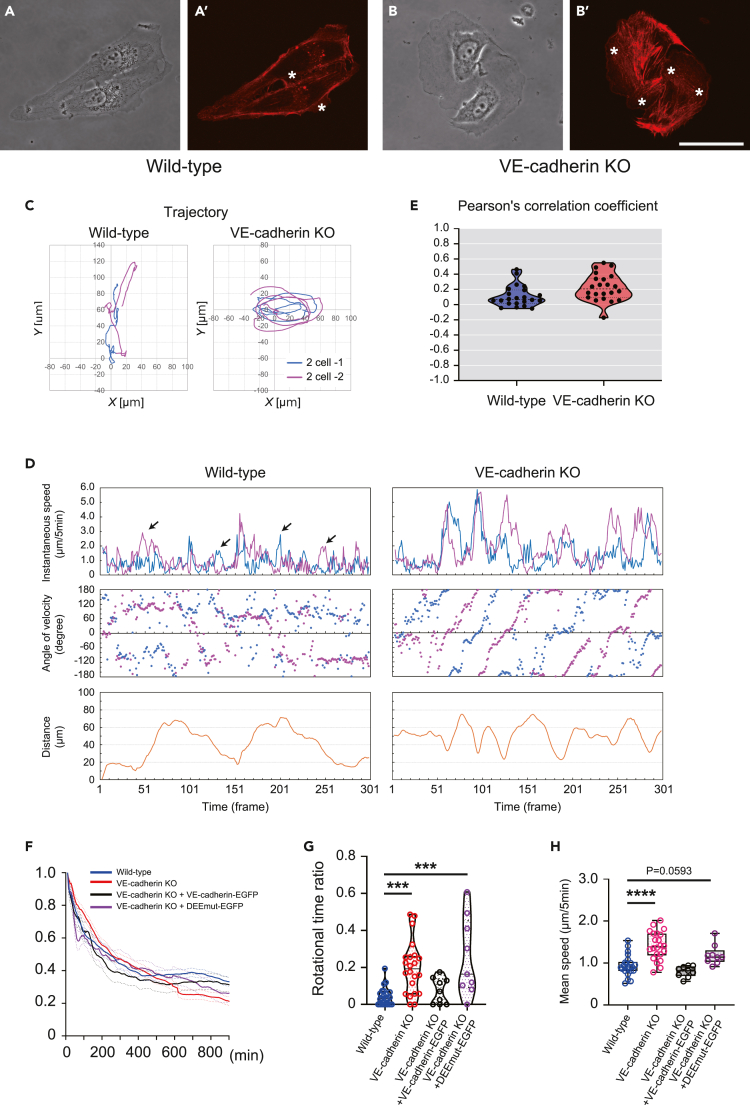
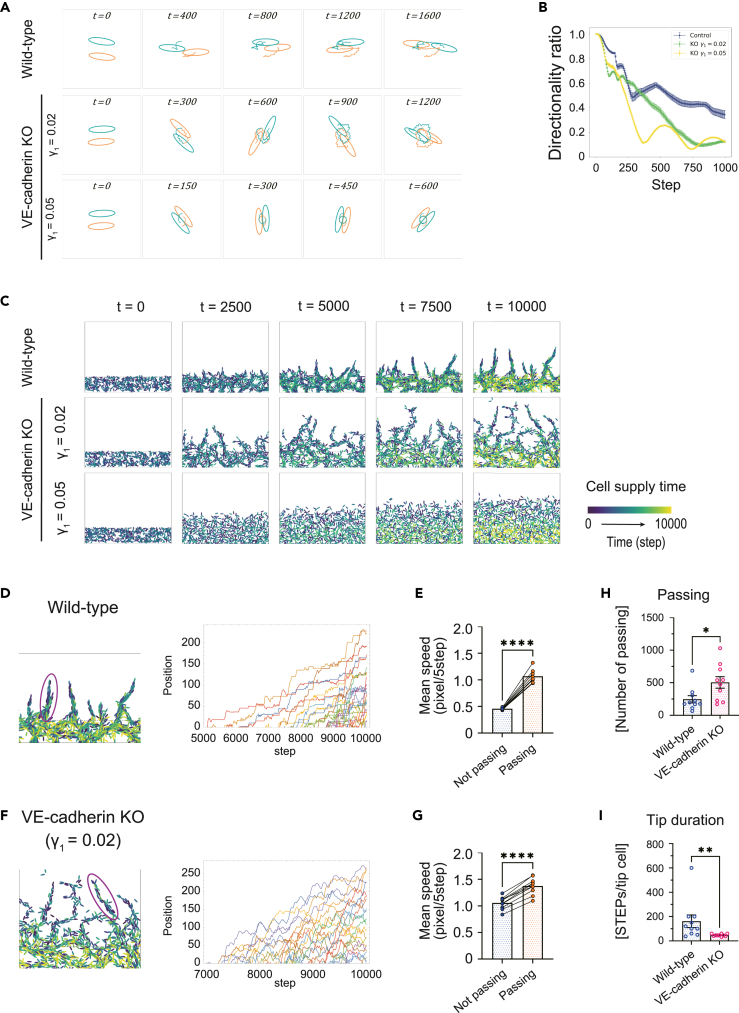
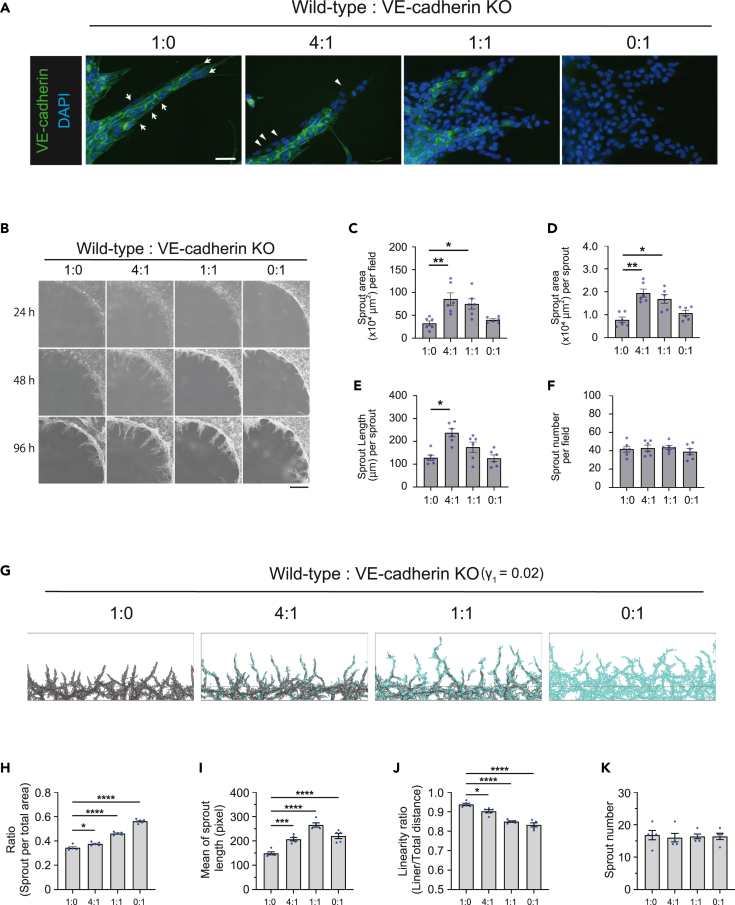
Angiogenesis is a sequential process to extend new blood vessels from preexisting ones by sprouting and branching. During angiogenesis, endothelial cells (ECs) exhibit inhomogeneous multicellular behaviors referred to as "cell mixing," in which ECs repetitively exchange their relative positions, but the underlying mechanism remains elusive. Here we identified the coordinated linear and rotational movements potentiated by cell-cell contact as drivers of sprouting angiogenesis using in vitro and in silico approaches. VE-cadherin confers the coordinated linear motility that facilitated forward sprout elongation, although it is dispensable for rotational movement, which was synchronous without VE-cadherin. Mathematical modeling recapitulated the EC motility in the two-cell state and angiogenic morphogenesis with the effects of VE-cadherin-knockout. Finally, we found that VE-cadherin-dependent EC compartmentalization potentiated branch elongations, and confirmed this by mathematical simulation. Collectively, we propose a way to understand angiogenesis, based on unique EC behavioral properties that are partially dependent on VE-cadherin function.

Keywords: Cell biology; Mathematical biosciences.


Conflict of interest statement

The authors declare no competing interests.

Figures

None
Graphical abstract
Figure 1
Figure 1
MS-1 cells exhibit angiogenic sprouting with cell mixing (A–C) Phase-contrast images of MDCK (A), NIH3T3 (B), and MS-1 (C) cells migrating into Matrigel at the indicated times after seeding. Scale bars represent 1000 μm. See also Video S1. (D) Time-lapse sequences of migrating MS-1 cells in Matrigel. Cell nuclei were visualized by SYTO16 staining. Each colored arrowhead tracks the movement of an individual cell located at the tip position. Scale bar represents 50 μm. See also Video S2. (E and F) Time evolution of individual cell positions in (D). Each line with different color (F) represents the trajectory of an individual EC along the axis of elongation (white arrow in E). (G) Comparison of the mean (left) and distribution (right) of migration speed between cells at the state of “Passing” or “Not passing”, as defined in STAR Methods. Data were extracted from 36-h trajectories of all analyzed cells in 10 elongating branches (also in H). Data are represented as scatterplots with bars indicating means. ∗∗∗∗p < 0.0001, paired t test. (H) Changes in the mean instantaneous speed of stalk and tip cells around the time of “Passing”. Data are represented as mean ± SEM for each time point.
Figure 2
Figure 2
Analysis of the directional motility of ECs and non-ECs at a two-cell state (A–C) Boxplots of mean speeds (upper) and histograms of their distribution (lower) in NIH3T3 (1-cell, n = 39; 2-cell, n = 22) (A), MDCK (1-cell, n = 12; 2-cell, n = 18) (B), and MS-1 (1-cell, n = 18; 2-cell, n = 20) (C) cells in one- and two-cell states. Mean speed at a two-cell state was calculated as an average speed of each cell pair. Data are represented as box-whisker plots. ∗p < 0.05, ∗∗p < 0.01, ∗∗∗p < 0.001, Welch’s t-test. (D–G) Averaged MSD (⟨δ(τ)2⟩) (upper) and MSD divided by time interval τ (lower) plotted on log-log and linear scales, respectively, in MS-1 (1-cell, n = 18; 2-cell, n = 40) (D), MDCK (1-cell, n = 12; 2-cell, n = 36) (E), Vero (1-cell, n = 32; 2-cell, n = 82) (F), and COS7 (1-cell, n = 24; 2-cell, n = 60) (G) cells. Blue and red lines represent 1-cell and 2-cell states, respectively. (H) Persistence time estimated from the averaged MSD data. (I) Directionality ratio over elapsed time t (min). (J) Order parameter measured in the indicated time interval. Trajectories obtained from time-lapse images for 10 h from 2 h after the onset of anaphase were analyzed here. Data in (D–J) are represented as mean ± SEM.
Figure 3
Figure 3
ECs exhibit fast rotational movement in a two-cell state (A) A representative trajectory of paired ECs showing rotational movement. (B) Tracking of rotational movements of ECs. Arrows indicate the direction of cellular rotation with blue lines connecting cell pairs at the same time. (C) Time evolution of instantaneous speed (top), angle between the velocities (middle), and internuclear distance (bottom) of the representative rotating cell pair (the same as in A and B) for 10 h. (D) Comparison of rotational time ratio between MS-1 ECs (n = 22) and other adherent cells (MDCK, n = 19; Vero, n = 46; COS7, n = 30). Total trajectories obtained from time-lapse images within 48 h were analyzed. Data are represented as violin plots. ∗∗p < 0.01, ∗∗∗p < 0.001, ∗∗∗∗p < 0.0001, Kruskal-Wallis test and Dunn’s test. (E and F) Comparison of mean speeds (E) and their distribution (F) between cells in the “Rotational” or “Not rotational” state. Data are represented as scatterplots with bars indicating means ± SEM. ∗∗p < 0.01, Welch’s t-test.
Figure 4
Figure 4
VE-cadherin is required for the coordinated linear movement that facilitates forward sprout elongation (A) Triple staining of wild-type and VE-cadherin-KO MS-1 cells with anti-VE-cadherin antibody (green), F-actin-binding fluorescent phalloidin (red), and DAPI (blue). Scale bar represents 50 μm. (B) Trajectories of wild-type and VE-cadherin-KO MS-1 cells within high-density monolayers (ECM-free region) from 48 to 60 h after seeding. Scale bar represents 50 μm. (C and D) Directionality ratio (C) and mean speed (D) of wild-type and VE-cadherin-KO MS-1 cells migrating within monolayers from 24 to 72 h after seeded. Mean values were obtained from three independent experiments. Data are represented as mean ± SEM for each time point (C) or scatterplots with bars indicating means ± SEM (D). ∗p < 0.05, Welch’s t-test. (E–K) Angiogenic sprouting of wild-type and VE-cadherin-KO MS-1 cells in the Matrigel assay. (E) Trajectories of individual ECs from 48 to 72 h after seeding. Scale bars represent 50 μm. (F) Phase-contrast images of migrating cells at the indicated days after seeding. Scale bar represents 500 μm. (G) Time evolution of individual EC positions along the axis of elongation from 24 to 72 h after seeding. (H–K) Comparison of cell motility parameters (defined in STAR Methods). Data were obtained from five branches for each group. Data are represented as scatter plots with bars indicating means ± SEM. ∗p < 0.05, Welch’s t-test.
Figure 5
Figure 5
Synchronized rotational movement was enhanced by VE-cadherin KO (A–B′) Phase-contrast images (A and B) and F-actin labeling by LifeAct-RFP (A′ and B′) of wild-type (A and A′) and VE-cadherin-KO MS-1 cells (B and B′). Scale bar represents 50 μm. (C) Representative trajectories of wild-type and VE-cadherin-KO MS-1 cells on 2-cell interplay for 25 h. See also Video S10. (D) Time evolution of instantaneous speed, angle of velocity, and spatial distance between a representative cell pair. Paired cells are represented by blue and red plots. (E) Violin plot showing Pearson’s correlation coefficient between the instantaneous speeds in wild-type (n = 22) and VE-cadherin-KO (n = 22) pairs. (F–H) Comparison of directionality ratio over elapsed time t (min) (F), rotational time ratio (rotational time per total time) (G), and mean speeds (H) among wild-type cells (n = 22), VE-cadherin-KO cells (n = 22), and VE-cadherin-KO cells transfected with VE-cadherin-EGFP (n = 9) or VE-cadherin-DEEmut-EGFP (n = 9) in two-cell states. n indicates a number of paired cells. Mean speed at a two-cell state was calculated as an average speed of each cell pair. Data are represented as violin plots (G) or box-whisker plots (H). ∗∗∗p < 0.001, ∗∗∗∗p < 0.0001, one-way ANOVA and Dunnett’s test.
Figure 6
Figure 6
Mathematical model and numerical simulation (A) Representative numerical simulation of the dynamics of wild-type and VE-cadherin- KO (γ1=0.02and0.05) cell pairs. Wild-type cells alternately move and stop, while VE-cadherin-KO cells rotate synchronously. See also Video S12. (B) Directionality ratio of wild-type and VE-cadherin-KO cell pairs. (C) Representative snapshots of collective cell migration in the numerical simulation with the parameters used in (A). Cells were supplied from the bottom area at different time steps indicated by color. See also Video S13. (D–G) Trajectory analysis of simulation results in (C). Individual cell positions in circled branches were projected onto the elongation axis (D and F) and the mean speeds were compared between cells at the state of “Passing” or “Not passing” (E and G) in wild-type (D and E) and VE-cadherin-KO (F and G) cells. (H and I) Comparison of the number of passing (H) and tip duration (I). STEPs in (I) is 5 steps. The plots in (E–I) are averaged over 10 simulations. Details of the mathematical modeling are described in STAR Methods. Data are represented as scatterplots with bars indicating means (E and G) or means ± SEM (H, I). ∗∗∗∗p < 0.0001, paired t-test (E and G), ∗p < 0.05), ∗∗p < 0.01, Mann-Whitney U test (H and I).
Figure 7
Figure 7
VE-cadherin-dependent compartmentalization of angiogenic ECs (A) Staining with anti-VE-cadherin antibody (green) and DAPI (blue) for angiogenic branches containing wild-type and VE-cadherin-KO MS-1 cells at indicated ratios. Samples were fixed 96 h after assays were started. Arrowheads indicate VE-cadherin- KO cells. Scale bar represents 50 μm. (B) Phase-contrast images of angiogenic sprouting of MS-1 cells in Matrigel at the indicated times after seeding. Wild-type and VE-cadherin-KO MS-1 cells were mixed at indicated ratios. Scale bar represents 500 μm. (C–F) Quantification of angiogenic parameters in sprouts 48 h after seeding (n = 6 for each group). Data are represented as scatterplots with bars indicating means ± SEM. ∗p < 0.05, ∗∗p < 0.01, Kruskal-Wallis test and Dunn’s test. (G) Simulation of branching morphogenesis with the mathematical model, in which wild-type (black) and VE-cadherin-KO (turquoise) cells were mixed at indicated ratios. (H–K) Quantification of angiogenic parameters in simulated angiogenic sprouts (n = 5 for each group). Data are represented as scatterplots with bars indicating means ± SEM. ∗p < 0.05, ∗∗∗p < 0.001, ∗∗∗∗p < 0.0001, one-way ANOVA and Dunnett’s test.

References

    1. Friedl P., Gilmour D. Collective cell migration in morphogenesis, regeneration and cancer. Nat. Rev. Mol. Cell Biol. 2009;10:445–457. doi: 10.1038/nrm2720. - DOI - PubMed
    1. Rørth P. Fellow travellers: emergent properties of collective cell migration. EMBO Rep. 2012;13:984–991. doi: 10.1038/embor.2012.149. - DOI - PMC - PubMed
    1. Mayor R., Etienne-Manneville S. The front and rear of collective cell migration. Nat. Rev. Mol. Cell Biol. 2016;17:97–109. doi: 10.1038/nrm.2015.14. - DOI - PubMed
    1. Chung A.S., Lee J., Ferrara N. Targeting the tumour vasculature: insights from physiological angiogenesis. Nat. Rev. Cancer. 2010;10:505–514. doi: 10.1038/nrc2868. - DOI - PubMed
    1. Kerbel R.S. Tumor angiogenesis. N. Engl. J. Med. 2008;358:2039–2049. doi: 10.1056/NEJMra0706596. - DOI - PMC - PubMed

LinkOut - more resources