. 2023 Mar 1;8(6):658-674.
doi: 10.1016/j.jacbts.2022.11.006. eCollection 2023 Jun.

PDGF-AB Reduces Myofibroblast Differentiation Without Increasing Proliferation After Myocardial Infarction

Affiliations

PDGF-AB Reduces Myofibroblast Differentiation Without Increasing Proliferation After Myocardial Infarction

Robert D Hume et al. JACC Basic Transl Sci. .

Abstract

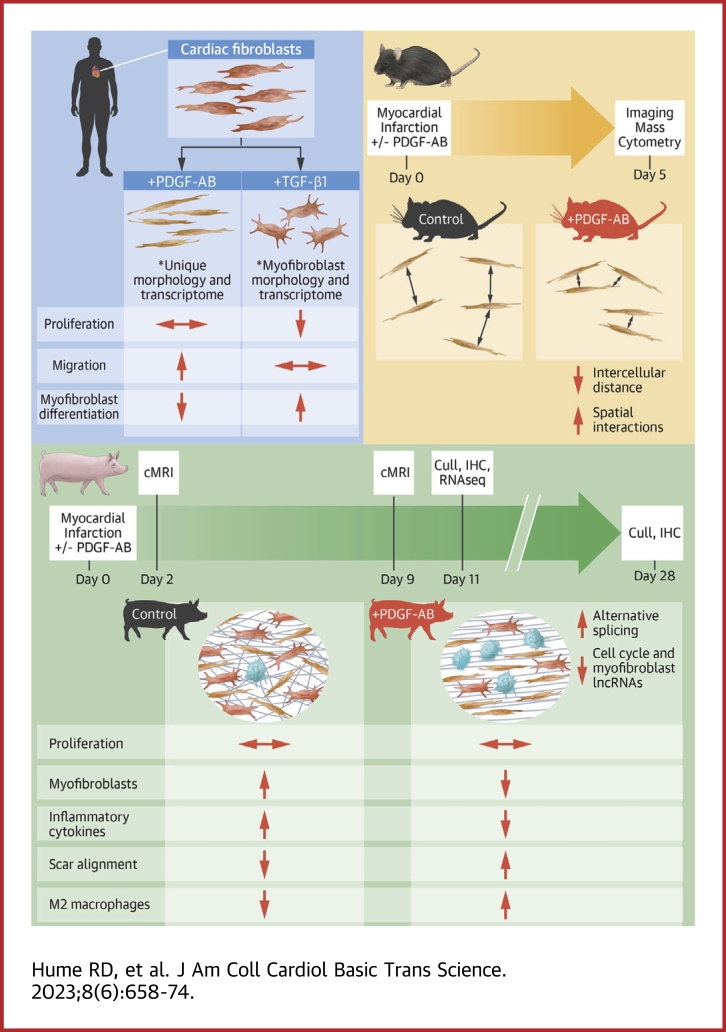
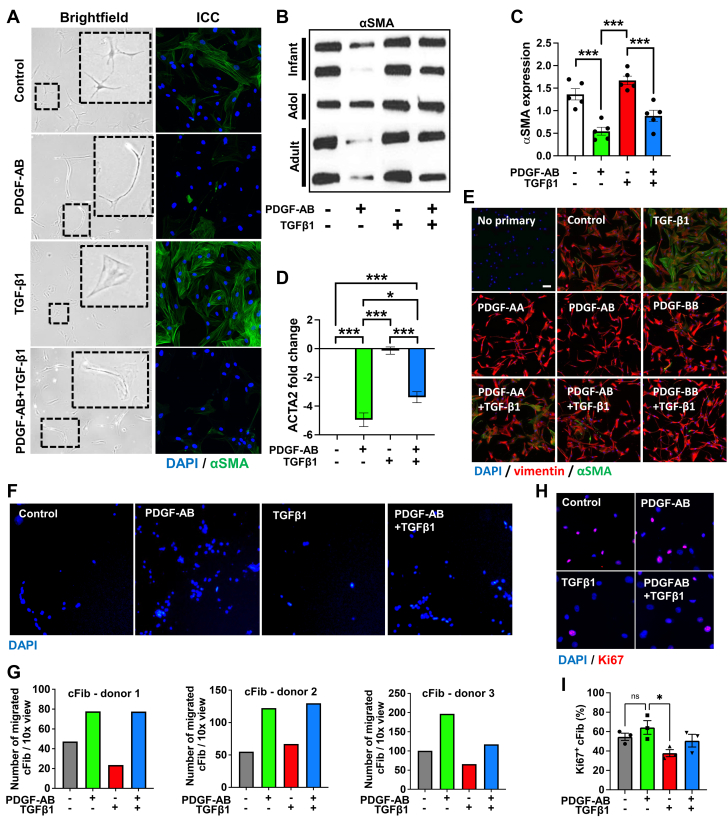
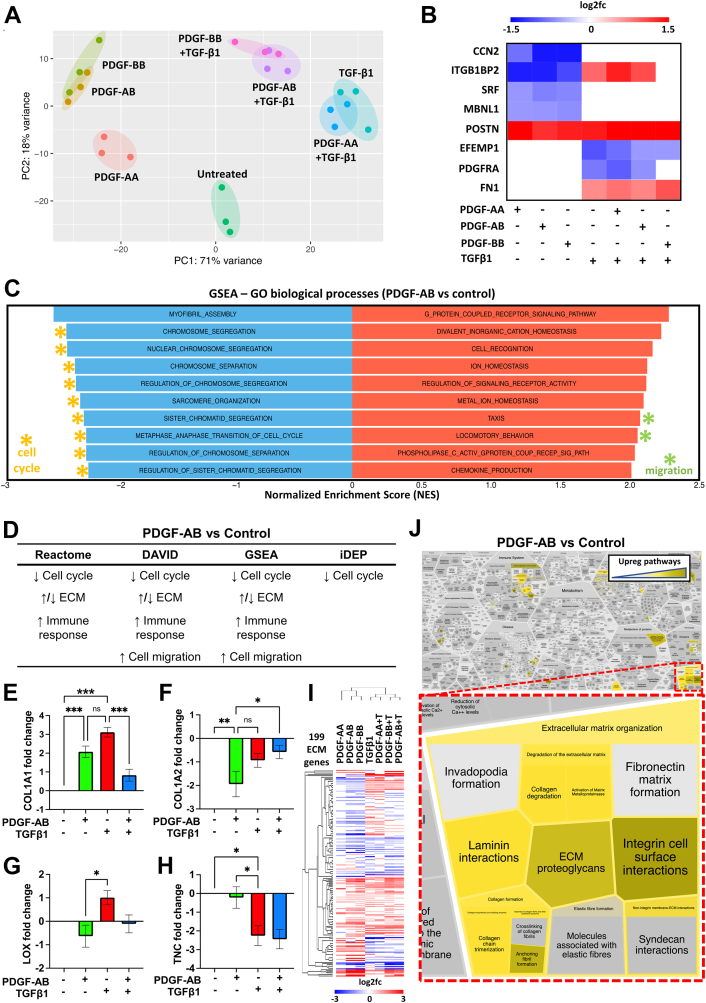
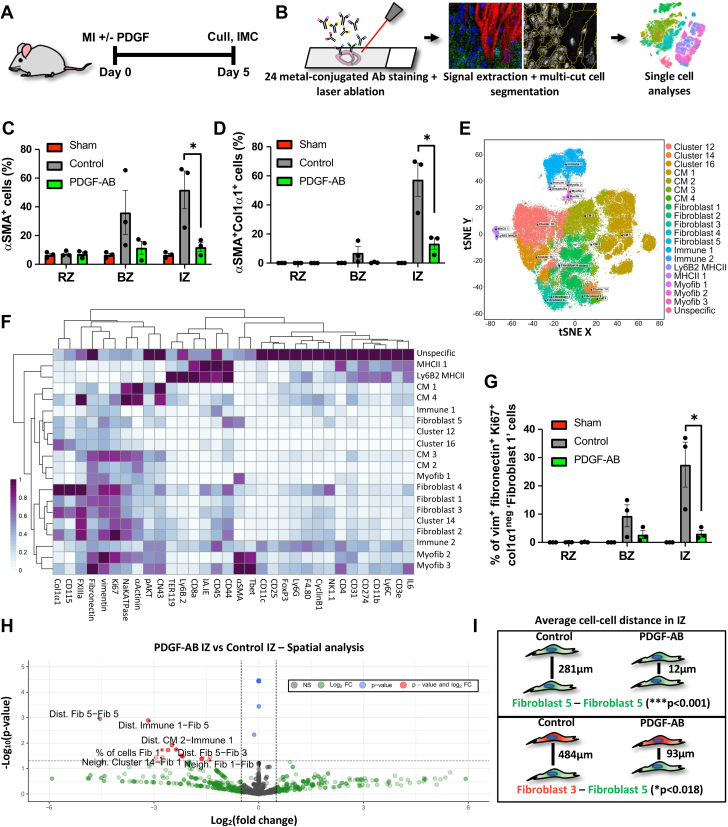
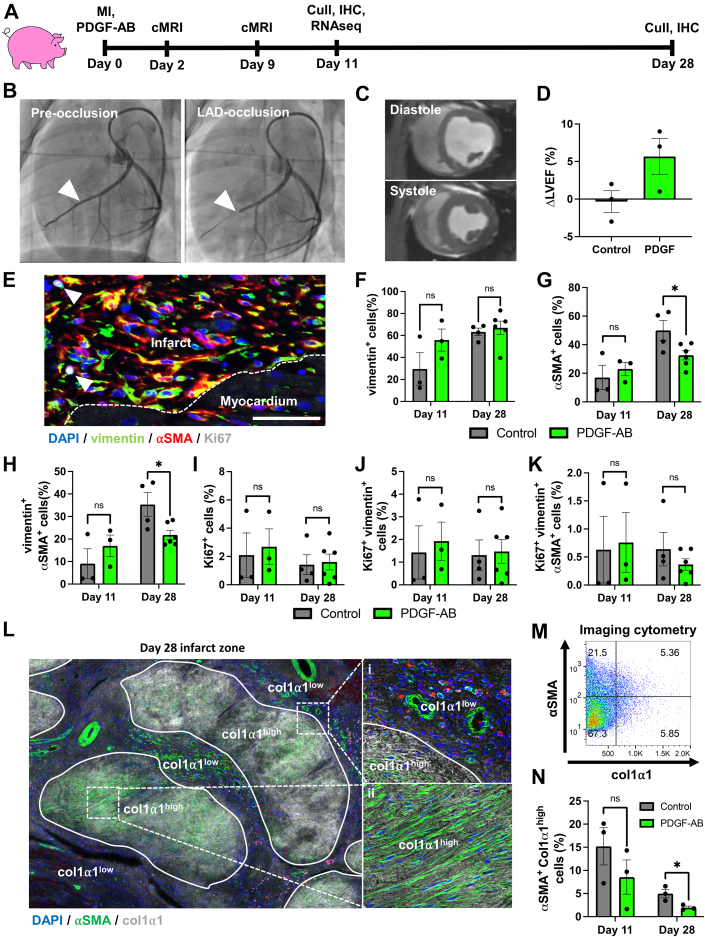
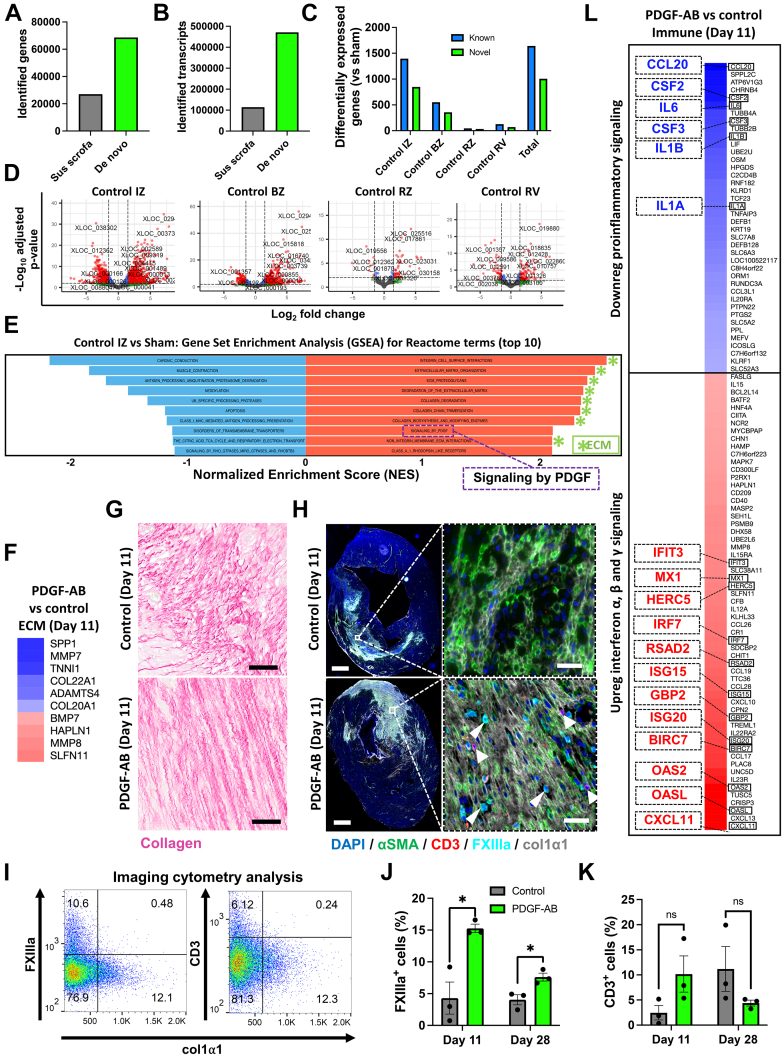
After myocardial infarction (MI), fibroblasts progress from proliferative to myofibroblast states, resulting in fibrosis. Platelet-derived growth factors (PDGFs) are reported to induce fibroblast proliferation, myofibroblast differentiation, and fibrosis. However, we have previously shown that PDGFs improve heart function post-MI without increasing fibrosis. We treated human cardiac fibroblasts with PDGF isoforms then performed RNA sequencing to show that PDGFs reduced cardiac fibroblasts myofibroblast differentiation and downregulated cell cycle pathways. Using mouse/pig MI models, we reveal that PDGF-AB infusion increases cell-cell interactions, reduces myofibroblast differentiation, does not affect proliferation, and accelerates scar formation. RNA sequencing of pig hearts after MI showed that PDGF-AB reduces inflammatory cytokines and alters both transcript variants and long noncoding RNA expression in cell cycle pathways. We propose that PDGF-AB could be used therapeutically to manipulate post-MI scar maturation with subsequent beneficial effects on cardiac function.

Keywords: myocardial infarction; platelet-derived growth factor.


Conflict of interest statement

This study was funded by grants from the National Health and Medical Research Council APP1194139 and from the New South Wales Government Office of Health and Medical Research. HAYA scientific provided funding for paired-end RNAseq of pig cardiac tissue. Drs Marcuello, Blessing, and Ounzain are shareholders and full-time employees of HAYA therapeutics. All other authors have reported that they have no relationships relevant to the contents of this paper to disclose.

Figures

None
Graphical abstract
Figure 1
Figure 1
PDGFs Reduce Fibroblast-Myofibroblast Differentiation and Increase Migration Without Increasing Proliferation of human cFib Human cardiac fibroblasts (cFib) were treated with platelet-derived growth factor (PDGF) subunits AA, AB, or BB ± transforming growth factor (TGF)-β1. (A) cFib were imaged using brightfield microscopy and immunostained with α-smooth muscle actin (SMA) (green). (B) cFib Western blotting probed for αSMA. (C) cFib Western blotting α-SMA densitometry analysis. (D) cFib quantitative polymerase chain reaction (qPCR) for actin alpha 2, smooth muscle (ACTA2) fold change normalized to glyceraldehyde-3-phosphate dehydrogenase (GAPDH) (2-ΔΔCt). (E) cFib immunostained for vimentin (red) and α-SMA (green). (F) cFib transwell assays showing 4’,6-diamidino-2-phenylindole (DAPI)–stained migratory cells. (G) Analysis of transwell assays, each graph representing a different cFib donor-derived cell line. (H) cFib immunostaining for Ki67 (red) positive DAPI (blue). (I) Image analysis of proliferating (Ki67+) cFib. Statistical analyses were performed using a 1-way analysis of variance with a Tukey’s multiple comparisons test. ∗P < 0.05. ∗∗∗P < 0.001. n.s. = not significant.
Figure 2
Figure 2
PDGFs Reduce Myofibroblast and Cell Cycle Gene Expression and Increase Migration and ECM Gene Expression of cFib cFib were treated with PDGF-AA, PDGF-AB, or PDGF-BB ± TGFβ1 followed by RNA sequencing (RNAseq). (A) Principal component analysis (PCA). (B) Differential gene expression (DE) analysis heatmap of myofibroblast markers (scale bar = log2fold change). (C) Gene set enrichment analysis (GSEA) of PDGF-AB–treated samples showing the top and bottom 10 most effected gene sets. (D) Summary of RNAseq pathway analyses for PDGF-AB samples. (E to H) cFib qPCR for extracellular matrix (ECM) genes normalized to GAPDH (2-ΔΔCt, n.s., ∗P < 0.05, ∗∗P < 0.01, ∗∗∗P < 0.001). (I) Heatmap of cFib RNAseq ECM-related genes with hierarchical clustering (scale bar = log2fold change). (J) Reactfoam pathway analysis of PDGF-AB-treated cFib RNAseq gene expression showing upregulated pathways (yellow) highlighting ECM-related pathways (red inset). Abbreviations as in Figure 1.
Figure 3
Figure 3
PDGF-AB Increases Cell-Cell Interactions Within Infarct Scar (A) Schematic of post–myocardial infarction (MI) mouse model. (B) Schematic of IMC. (C, D) Analysis of IMC for αSMA+ and αSMA+col1α1+ cells in the remote zone (RZ), border zone (BZ) and infarct zone (IZ) of sham, vehicle control, and PDGF-AB–treated post-MI mice (∗P < 0.05). (E) t-distributed stochastic neighbor embedding (tSNE) unbiased clustering analysis of IMC data with sample types labelled. (F) Heatmap of IMC marker (x-axis) expression for each cell subpopulation (y-axis) derived from tSNE unbiased clustering. (G) tSNE clustering analysis of IMC data with unbiased clusters labelled. (H) Expression plots of IMC markers. (I) Proportion of fibroblast 1 IMC cluster in RZ, BZ, and IZ in sham, vehicle control, and PDGF-AB–treated mice (∗P < 0.05). (J) IMC spatial analysis showing significantly reduced average distances of fibroblast 5 (green) and fibroblast 3 (red) IMC clusters following PDGF-AB treatment within the IZ. (K) Volcano plot of IMC spatial analysis. Red dots represent comparisons that met both P value and fold change cutoffs. IMC = imaging mass cytometry; other abbreviations as in Figure 1.
Figure 4
Figure 4
PDGF-AB Reduces Fibroblast-Myofibroblast Differentiation and Does Not Increase Proliferation in Pigs Post-MI (A) Schematic of post-MI pig model. (B) Coronary angiogram pre- and post-left anterior descending (LAD) artery balloon occlusion to induce MI. Arrowhead indicates balloon inflation point in LAD. (C) Short-axis cMRI view of the heart in end-diastole and end-systole at the mid-papillary muscle level. (D) Change in left ventricular ejection fraction (ΔLVEF) from day 2 to day 9 post-MI. (E to K) Immunohistochemistry (IHC) and analyses for fibroblasts (vimentin+), myofibroblasts (vimentin+αSMA+) and proliferating (Ki67+) cells within pig post-MI IZ (scale bar = 100 μm). (L to N) IHC and analyses of αSMA+ cells with myofibroblast morphology within col1α1high areas in pig IZs. cMRI = cardiac magnetic resonance imaging; other abbreviations as in Figures 1 and 3.
Figure 5
Figure 5
De Novo Genome Assembly Reveals Novel Pig Genes, Transcripts, and Infarct Biology and Shows That PDGF-AB Accelerates Scar Maturation and Reduces Inflammatory Cytokines in Pigs Post-MI (A, B) Number of identified genes and transcripts for current pig genome annotation (SScrofa11.1) and our de novo library assembly. (C) DE genes for control pig 11 days post-MI cardiac tissue vs shams using our de novo library assembly. (D) Volcano plots showing DE genes in control pigs (vs shams). Red dots represent genes that met both P value and log2(fold change) cutoffs. (E) GSEA for control DE genes in control pigs (vs shams). (F) Heatmap of PDGF-AB–treated pig RNAseq for DE ECM-related genes. (G) Picro-Sirius red histological staining of collagen fibers (red) in pig post-MI infarct zone (IZ, scale bar = 50 μm). (H) IHC of col1α1 scar (grey), CD3+ T cells (red, arrows), and FXIIIa+ macrophages (blue, arrowheads) in pigs post-MI. Scale bar = 2 mm (top) and 100 μm (bottom). (I to K) IHC image analyses of pig infarct zones (∗P < 0.05). (L) Heatmap of PDGF-AB–treated pig RNAseq for DE immune-related genes. Abbreviations as in Figures 1, 2, 3, and 4.

References

    1. Virani S.S., Alonso A., Benjamin E.J., et al. Heart disease and stroke statistics–2020 update: a report from the American Heart Association. Circulation. 2020;141(9):E139–E596. - PubMed
    1. Palasubramaniam J., Wang X., Peter K. Myocardial infarction — from atherosclerosis to thrombosis. Arterioscler Thromb Vasc Biol. 2019;39(8):E176–E185. - PubMed
    1. Hume R.D., Chong J.J.H. The cardiac injury immune response as a target for regenerative and cellular therapies. Clin Ther. 2020;42(10):1923–1943. - PubMed
    1. Mouton A.J., Ma Y., Rivera Gonzalez O.J., et al. Fibroblast polarization over the myocardial infarction time continuum shifts roles from inflammation to angiogenesis. Basic Res Cardiol. 2019;114(2):6. - PMC - PubMed
    1. Silva A.C., Pereira C., Fonseca A.C.R.G., Pinto-do-Ó P., Nascimento D.S. Bearing my heart: the role of extracellular matrix on cardiac development, homeostasis, and injury response. Front Cell Dev Biol. 2021;8 - PMC - PubMed

LinkOut - more resources