. 2023 Mar 8;8(6):702-719.
doi: 10.1016/j.jacbts.2022.12.006. eCollection 2023 Jun.

IGF-1 Therapy Improves Muscle Size and Function in Experimental Peripheral Arterial Disease

Affiliations

IGF-1 Therapy Improves Muscle Size and Function in Experimental Peripheral Arterial Disease

Gengfu Dong et al. JACC Basic Transl Sci. .

Abstract

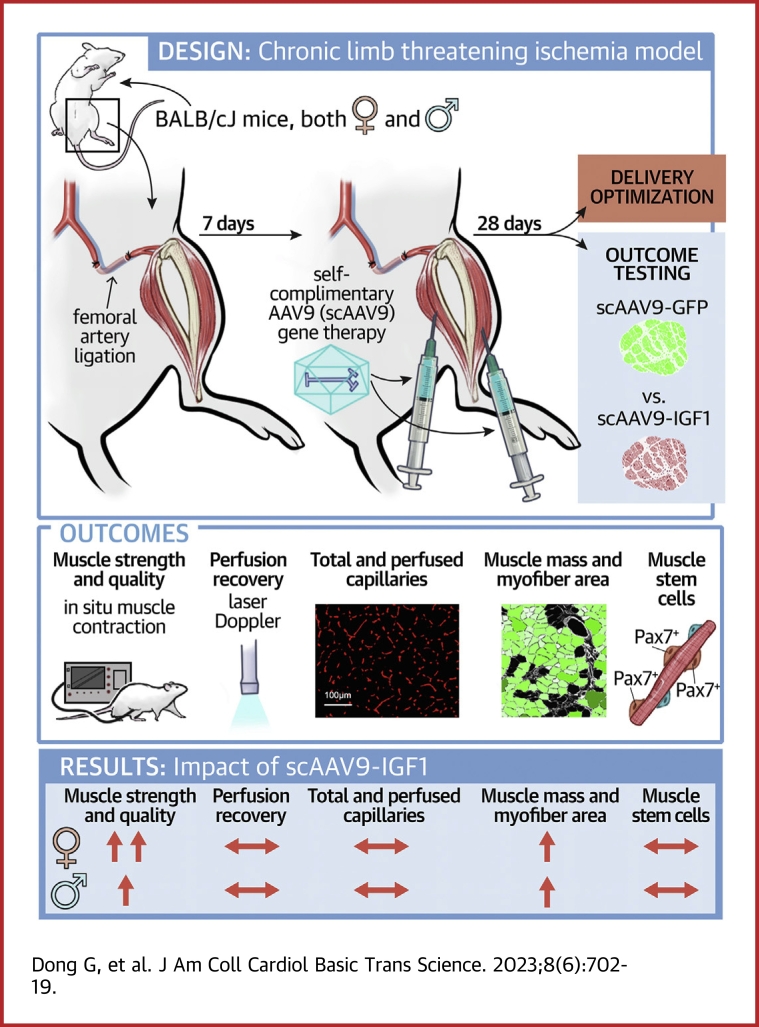
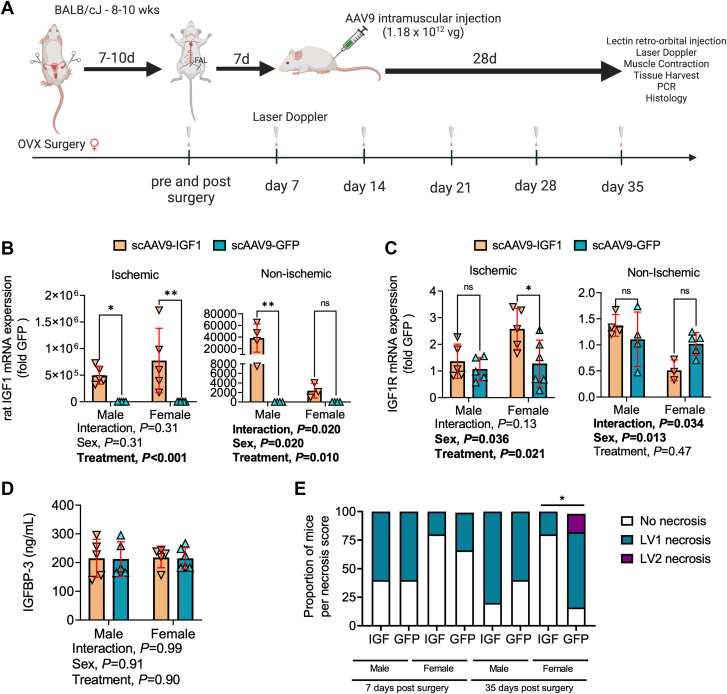
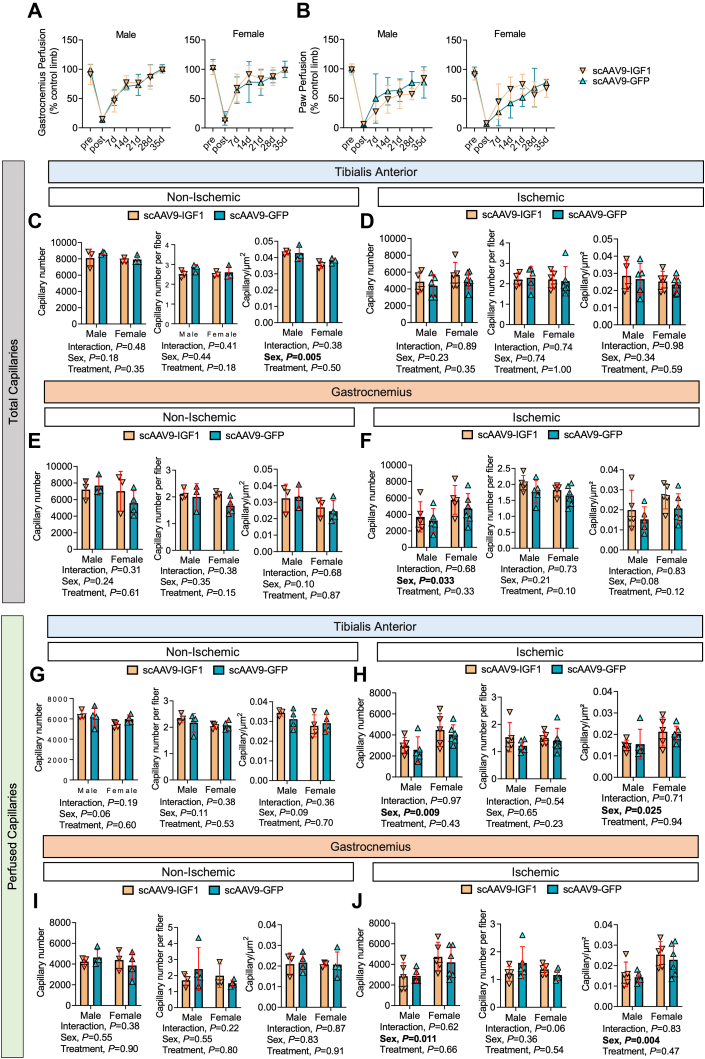
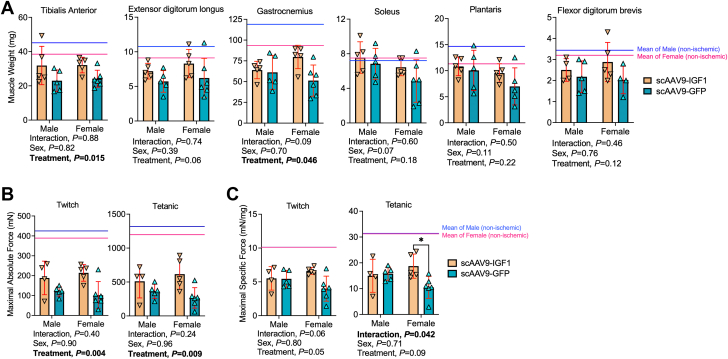
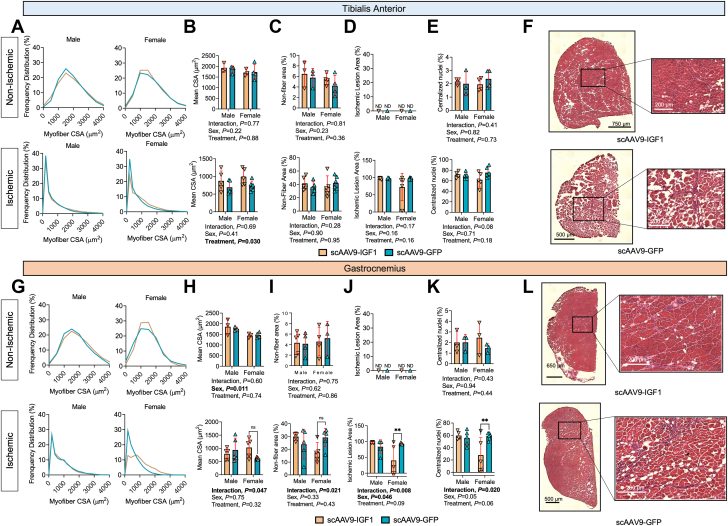
Lower-extremity peripheral arterial disease (PAD) has increased in prevalence, yet therapeutic development has remained stagnant. Skeletal muscle health and function has been strongly linked to quality of life and medical outcomes in patients with PAD. Using a rodent model of PAD, this study demonstrates that treatment of the ischemic limb with insulin-like growth factor (IGF)-1 significantly increases muscle size and strength without improving limb hemodynamics. Interestingly, the effect size of IGF1 therapy was larger in female mice than in male mice, highlighting the need to carefully examine sex-dependent effects in experimental PAD therapies.

Keywords: chronic limb threatening ischemia; gene therapy; regeneration; skeletal muscle.


Conflict of interest statement

This study was supported by National Institutes of Health (NIH) grant R01-HL149704 (to Dr Ryan). Dr Kim was supported by American Heart Association grant POST903198. Mr Thome was supported by NIH grant F31-DK128920. All other authors have reported that they have no relationships relevant to the contents of this paper to disclose.

Figures

None
Graphical abstract
Figure 1
Figure 1
Establishment of the Optimal AAV Dosing and Delivery Strategy for the Critically Ischemic Limb (A) Graphic abstract of study design and adeno-associated virus (AAV) injection volumes and titers (viral genomes [vg]), created with Biorender.com. FAL = femoral artery ligation. (B) Representative images of tibialis anterior, extensor digitorum longus, soleus, flexor digitorum brevis, and gastrocnemius muscles injected with self-complimentary (sc) AAV9-–cytomegalovirus–green fluorescent protein (GFP) (n = 5-6/group) 35 days after FAL surgery. (C) Quantification of the GFP expression intensity (integral of area and intensity) across ischemic hindlimb muscles (n = 5-6/group). (D) Laser Doppler paw and gastrocnemius muscle perfusion recovery (n = 3-6/group). Error bars represent SD. C: 1-way ANOVA with Tukey’s post hoc test; D: repeated-measures ANOVA. ∗P < 0.05; ∗∗P < 0.01; ∗∗∗P < 0.001; ∗∗∗∗P < 0.0001.
Figure 2
Figure 2
AAV Injection Does Not Alter Myofiber Size or Histopathology in Critically Ischemic Muscle (A) Representative hematoxylin-eosin images of tibialis anterior and gastrocnemius muscles injected with scAAV9-CMV-GFP. (B) Quantification of mean myofiber area of hindlimb muscles (n = 3-6/group). The solid line represents the mean and dotted lines the SD of nonischemic muscle. (C) Histograms showing distribution of myofiber in hindlimb muscles. (D) Quantification of the ischemic lesion area (percentage of muscle injured). (E) Quantification of nonfiber area (percentage of total muscle area). Error bars represent SD. B, D, and E: 1-way ANOVA with Tukey’s post hoc test. Abbreviations as in Figure 1.
Figure 3
Figure 3
Muscle Function Was Unaffected by Delivery of AAV to Critically Ischemic Muscle (A) Maximal absolute twitch and tetanic force of the ischemic tibialis anterior muscle stimulated via the sciatic nerve (n = 3-6/group). (B) Maximal specific twitch and tetanic force of the ischemic tibialis anterior muscle stimulated via the sciatic nerve (n = 3-6/group). (C) Hindlimb grip strength (normalized to body weight [BW]) measured 35 days after surgery (n = 3-6/group). The solid lines represent the mean and dotted lines the SD of nonischemic muscle. Error bars represent SD. 1-way ANOVA with Tukey’s multiple comparison test. Abbreviations as in Figure 1.
Figure 4
Figure 4
Treatment With scAAV9–IGF-1 Significantly Reduced Limb Necrosis Progression in Female CLTI Mice (A) Graphic abstract of study design, created with Biorender.com. OVX = ovariectomy. (B) mRNA levels of rat insulin-like growth factor (IGF)-1 in the ischemic and nonischemic gastrocnemius muscle (n = 3-6/group/sex). (C) mRNA levels of mice IGF1 receptor (IGF1R) in the ischemic and nonischemic gastrocnemius muscle (n = 3-6/group/sex). (D) Quantification of serum IGF-binding protein 3 (IGFBP3) concentration (n = 5-6/group/sex). (E) Distribution of limb necrosis scores at 7 and 35-days after FAL surgery (n = 5-6/group per sex). Error bars represent SD. E: Mann-Whitney U-test; D to I: 2-way ANOVA with Šidák’s post hoc test when necessary. ∗P < 0.05; ∗∗P < 0.01; ns = not significant. Abbreviations as in Figure 1.
Figure 5
Figure 5
Treatment With scAAV9–IGF-1 Does Not Improve Perfusion Recovery or Capillary Density in the Critically Ischemic Limb (A) Gastrocnemius and (B) paw perfusion recovery (n = 5-6/group per sex). Quantification of total capillary number (CD31+), total capillaries per myofiber, and total capillary number per muscle area (μm2) within the (C) nonischemic and (D) ischemic tibialis anterior muscle and the (E) nonischemic and (F) ischemic gastrocnemius muscle (n = 3-6/group per sex). Quantification of perfused capillary number, perfused capillaries per myofiber, and perfused capillary number per muscle area (μm2) within the (G) nonischemic and (H) ischemic tibialis anterior muscle and the (I) nonischemic and (J) ischemic gastrocnemius muscle (n = 3-6/group per sex). Error bars represent SD. A and B: repeated-measures ANOVA; C to J: 2-way ANOVA. Abbreviations as in Figure 1.
Figure 6
Figure 6
Treatment With scAAV9–IGF-1 Significantly Increases Muscle Size and Force Production in the Critically Ischemic Limb (A) Quantification of muscle weights in mice (n = 5-6/group per sex). (B) Maximal absolute twitch and tetanic force of the ischemic tibialis anterior muscle stimulated via the sciatic nerve (n = 4-6/group per sex). (C) Maximal specific twitch and tetanic force of the ischemic tibialis anterior muscle stimulated via the sciatic nerve (n = 4-6/group per sex). Error bars represent SD. Two-way ANOVA with Šidák’s post hoc test when necessary. The solid line represents the mean values for nonischemic muscle in each sex (blue = male; pink = female). ∗P < 0.05. Abbreviations as in Figure 1.
Figure 7
Figure 7
Impact of scAAV9–IGF-1 on Myofiber Size and Histopathology in the Critically Ischemic Limb (A) Histograms of the distribution of myofiber cross-sectional area (CSA), (B) quantification of the mean myofiber area, (C) quantification of nonfiber area (percentage of total muscle area), (D) quantification of the ischemic lesion (percentage of muscle injured), and (E) quantification of the percentage of myofibers with centralized nuclei within the tibialis anterior muscles (n = 3-6/group per sex). (F) Representative hematoxylin-eosin images of tibialis anterior muscles in female mice. (G) Histograms of the distribution of myofiber CSA, (H) Quantification of the mean myofiber area, (I) Quantification of nonfiber area (percentage of total muscle area), (J) Quantification of the ischemic lesion (percentage of muscle injured), and (K) Quantification of the percentage of myofibers with centralized nuclei within the gastrocnemius muscles (n = 3-6/group per sex). (L) Representative hematoxylin-eosin images of lateral gastrocnemius muscles in female mice. Error bars represent SD. B to E and H to K: 2-way ANOVA with Šidák’s post hoc test when necessary. ∗∗P < 0.01; ns = not significant; nd = not determined. Abbreviations as in Figure 1.
Figure 8
Figure 8
Treatment With scAAV9–IGF-1 Does Not Increase Pax7+ Satellite Cell Density in the Critically Ischemic Limb Quantification of the Pax7+ cell number per muscle area (mm2) within (A) the tibialis anterior muscle (n = 3-6/group per sex) and (B) the gastrocnemius muscle (n = 3-5/group per sex). (C) Representative immunofluorescence images of lateral gastrocnemius muscles from female mice in each treatment group. Error bars represent SD. A and B: 2-way ANOVA. Abbreviations as in Figure 1.

Similar articles

Cited by

References

    1. Conte S.M., Vale P.R. Peripheral arterial disease. Heart Lung Circ. 2018;27:427–432. - PubMed
    1. Go A.S., Mozaffarian D., Roger V.L., et al. Heart disease and stroke statistics—2014 update: a report from the American Heart Association. Circulation. 2014;129:e28–e292. - PMC - PubMed
    1. Fowkes F.G., Rudan D., Rudan I., et al. Comparison of global estimates of prevalence and risk factors for peripheral artery disease in 2000 and 2010: a systematic review and analysis. Lancet. 2013;382:1329–1340. - PubMed
    1. Novo S., Coppola G., Milio G. Critical limb ischemia: definition and natural history. Curr Drug Targets Cardiovasc Haematol Disord. 2004;4:219–225. - PubMed
    1. Kim K., Anderson E.M., Scali S.T., Ryan T.E. Skeletal muscle mitochondrial dysfunction and oxidative stress in peripheral arterial disease: a unifying mechanism and therapeutic target. Antioxidants (Basel) 2020;9 - PMC - PubMed

LinkOut - more resources