. 2023 Jun 23:14:1194087.
doi: 10.3389/fimmu.2023.1194087. eCollection 2023.

TMEM123 a key player in immune surveillance of colorectal cancer

Affiliations

TMEM123 a key player in immune surveillance of colorectal cancer

Elisa Pesce et al. Front Immunol. .

Erratum in

  • Corrigendum: TMEM123 a key player in immune surveillance of colorectal cancer.
    Pesce E, Cordiglieri C, Bombaci M, Eppenberger-Castori S, Oliveto S, Manara C, Crosti M, Ercan C, Coto M, Gobbini A, Campagnoli S, Donnarumma T, Martinelli M, Bevilacqua V, De Camilli E, Gruarin P, Sarnicola ML, Cassinotti E, Baldari L, Viale G, Biffo S, Abrignani S, Terracciano LM, Grifantini R. Pesce E, et al. Front Immunol. 2023 Jul 28;14:1256713. doi: 10.3389/fimmu.2023.1256713. eCollection 2023. Front Immunol. 2023. PMID: 37575239 Free PMC article.

Abstract

Colorectal cancer (CRC) is a leading cause of cancer-associated death. In the tumor site, the interplay between effector immune cells and cancer cells determines the balance between tumor elimination or outgrowth. We discovered that the protein TMEM123 is over-expressed in tumour-infiltrating CD4 and CD8 T lymphocytes and it contributes to their effector phenotype. The presence of infiltrating TMEM123+ CD8+ T cells is associated with better overall and metastasis-free survival. TMEM123 localizes in the protrusions of infiltrating T cells, it contributes to lymphocyte migration and cytoskeleton organization. TMEM123 silencing modulates the underlying signaling pathways dependent on the cytoskeletal regulator WASP and the Arp2/3 actin nucleation complex, which are required for synaptic force exertion. Using tumoroid-lymphocyte co-culture assays, we found that lymphocytes form clusters through TMEM123, anchoring to cancer cells and contributing to their killing. We propose an active role for TMEM123 in the anti-cancer activity of T cells within tumour microenvironment.

Keywords: TMEM123; cell adhesion; colorectal cancer; cytoskeleton organization; migration; tumor microenvironment; tumor-infiltrating lymphocytes.


Conflict of interest statement

Author Renata Grifantini is currently employed by CheckmAb Srl. The remaining authors declare that the research was conducted in the absence of any commercial or financial relationships that could be construed as a potential conflict of interest.

Figures

Figure 1
Figure 1
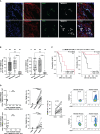
TMEM123 is over-expressed in CRC tissues and in tumor-infiltrating immune cells. (A) CRC TMA1 (see Table S1 ) was stained with an anti-TMEM123 monoclonal antibody. Black arrows indicate positive tumor areas and black arrowheads point to positive immune cells, which include both lymphocytes and macrophages, surrounding the tumor. (B) Boxplots of detected IHC scoring values in NAT and malignant tissues showed that TMEM123 is expressed almost exclusively in cancer tissues compared to the paired NAT (P<0.0001). (C) Scatter plot representation of IHC data showing negative correlation between TMEM123 positivity in cancer cells vs in infiltrating immune cells. (D) Flow cytometry analysis of major tumor-infiltrating immune cell populations. TMEM123 cell surface expression was assessed by FACS in CD3+T lymphocytes, CD19+ B lymphocytes, CD3-CD16+ and CD3-CD11b myeloid cells, CD3-CD56+ NK cells, CD3+CD56+ NKT cells isolate from tumor-infiltrating immune cells. Dot plots show representative staining of one clinical sample of three analyzed with similar cell distribution.
Figure 2
Figure 2
TMEM123 expression in intratumoral-CD8+ T lymphocytes correlated with better patient survival. (A) Representative qualitative immunofluorescence analysis of cryopreserved CRC tissues. TMEM123 expression is detected in intratumoral CD8+ (green, left) and CD4+ (green, right) T lymphocytes. (B) Boxplots represent the quantification of merged fluorescence signals of TMEM123 positive CD4+ (left) and CD8+ (right) T lymphocytes, assessed in FFPE tissue samples from two different tissue micro-arrays (see Table S1 ) containing CRC at different stages and normal tissue cores (n:83 primary cancer; n:53 metastases; n:10 normal tissues). (C) Kaplan–Meier analysis of metastasis-free survival (MFS) and overall survival (OS) stratified according to the presence (red line) or absence (black line) of TMEM123 in tumor-infiltrating CD8+ T lymphocytes. (D) FACS analysis of TMEM123 expression in TILs. Left graphs show the correlation between TMEM123+ lymphocytes present in cancer vs normal tissues and the TMEM123 positivity (%) in CD4+ and CD8+ T cells detected in tumor, non-tumor tissues and PBMC of each patient. The central graph shows the percentage of tumor-infiltrating TMEM123+CD4+ and TMEM123+CD8+ T cells detected in the same patient. Right graphs: representative FACS staining for TMEM123 expression in tumor-infiltrating CD4+ and CD8+ T cells compared to normal tissues. Statistical significance is denoted by asterisks (**= <0.01; ***=<0.001; ****= <0.0001).
Figure 3
Figure 3
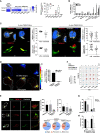
TMEM123 is induced by TCR activation and by cancer cells conditioned medium and is associated to effector T cell phenotype. (A) TMEM123 is co-expressed with activation markers in TILs. Co-expression analysis of TMEM123 in tumour infiltrating CD8+ T lymphocytes with the indicated markers. Heat-maps show the mean of 4 independent experiments. Graph shows the percentage of association of TMEM123 with each marker, in CD8+ T cells. (B) TMEM123 is induced by microenvironmental stimuli. PBMC from healthy donors were incubated with listed stimuli for 1h (white), 24h (black) and 48h (grey) and the presence of TMEM123 on the surface of CD8+ T cells was followed by FACS analysis, normalizing on the untreated samples. (C) TMEM123 distribution in Jurkat cells after stimulation with CM or CD3/CD28. Representative images at 100x magnification in confocal microscopy, where cells are shown with all channels in upper row, and with highlighted zoomed-in magnification of protrusions with evident localization of both Ezrin (green) or LFA-1 (green) and TMEM123 (red) in lower row. Cellular actin protrusions were quantified for each cell in all FOVs and dot-plots show the quantification of TMEM123+ Ezrin+ or TMEM123+ LFA-1+ protrusions in percentage towards Ezrin+ or LFA-1 protrusions (upper dot-plots), in which specifically the co-localization of both fluorophore signal was quantified in terms of Pearson Index (lower dot-plots). (D) TMEM123 nanoscale distribution in CD3 T cells after stimulation with CM and seeded on poly-lysine coating. Cells were immunolabelled for TMEM123 followed by secondary immunolabelling fluorescently conjugated with StarRED to super-resolve images with 775nm STED deletion. Three representative cells were shown in raw STED images (upper images) and in classified binary layers (lower images) to evaluate the distribution of intracellular TMEM123 spots (cyan; dimensional range 30-50nm) and clusters (yellow; dimensional range >60nm). Numbers of single TMEM123 spots (black bar) and TMEM123 clusters of molecules (grey bar) were quantified per cells in bar-chart. (E) A total of n=52 cells were analysed by STED microscopy to observe and correctly localize spatially TMEM123 immuno-labelled molecules (StarRED fluorophore, red LUT in images) relative to Ezrin, immuno-labelled as well (StarORANGE fluorophore, green LUT in images). The bar graphs show the quantification for single protein spots/cell (left) and for protein clusters/cell (right). The pie charts represent the proportion of clusters in cell edges, protrusions or all other dispersed cell areas. (F) TMEM123 is co-expressed with known T lymphocytes markers highly enriched in T cell adhesion and migration. Dot plot represents FACS analysis on CD8+ T cells for TMEM123 expression as standalone or in co-expression with tested markers. Data represent the average of at least 3 experiments. (G) TMEM123 positive CD8 T cells express high level of effector cytokines. CD3/CD28 activated CD8 T cells from PBMC of HD were treated with PMA-ionomycin-brefeldin-A and stained for indicated cytokines. Graph reports the percentage of cytokine produced from TMEM positive or TMEM negative T cells as determined by FACS analysis. (H) TMEM123 silencing impairs production of effector cytokines. CD3/CD28 activated CD8 T cells were further treated with TMEM123-FANA and cytokine expression was assessed by FACS. Statistical significance is denoted by asterisks (p-value *= <0.05; **= <0.01; *** = < 0.001; **** = < 0.0001).
Figure 4
Figure 4
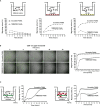
TMEM123 promotes chemotactic and trans-endothelial migration of T lymphocytes. (A, B) TMEM123 promotes migration of Jurkat and CD8 T cells. In (A) Boyden assay for CFSE-labelled Jurkat cells: the drawings schematize the set-up used for the assay; graphs represent the percentage in migrating cells. In (B) Boyden assay for CFSE-labelled activated CD8+ T cells: representative microscopic images show TMEM123 positive cells in the upper chamber during the acquisition time frame. Graph shows the percentage in migrating cells. (C) TMEM123 promotes trans-endothelial migration of Jurkat and CD8 T cells. Jurkat (left panels) or activated CD8 T cells (right panels) were suspended into the upper chamber of a Boyden chamber. Monolayer of HUVEC were seeded on the semi-permeable membrane of the chamber. Graph represent trans-endothelial migration in tested conditions. TMEM123 silencing remarkably impaired cells migration in all analysed conditions.
Figure 5
Figure 5
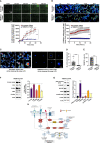
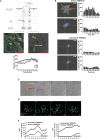
TMEM123 is a molecular regulator of the actin cytoskeleton dynamics pathway. (A, B) TMEM123 is involved in cell adherence. Upper panels: Representative images of time-recordings of Jurkat cells adherence, visualized via life-actin live-stain, following 48h incubation either with scramble FANA or with specific TMEM123 FANA. The images were acquired as whole sample (A) in large image mosaic of 9 FOVs at 10x magnification or in random FOVs at 40x magnification for better detail visualization (B). The graphs in the lower panels, show the image quantification of adherent life-act positive Jurkat cells per FOV at specific time points. N=4 biological samples/condition, n=10 technical replicates. ****= p-value< 0.0001, unpaired Mann-Withney test. (C–E) TMEM123 silencing alters actin morphology. (C) Representative images of best focal plans at 40x and 100x magnification from Jurkat cells stained with phalloidin for actin morphology following 48h incubation either with scramble FANA (left) or with specific TMEM123 FANA (right). (D, E) The graphs show a quantification of the number of actin protrusions and counts of TMEM123+ cells (90%). N= 867 cells analyzed over n=34 FOVs. **= p-value< 0.01, (ns)= not significant, unpaired Mann-Withney test. (F, G) TMEM123 silencing affects the actin cytoskeleton signaling. CD8 T cells were TMEM123 silenced by treating the cells with TMEM123 specific FANA and cell lysates was immunoblotted with antibodies against the indicated proteins. The densitometry value of each band was determined with ImageJ and normalized to β-actin. Data was presented as mean ± SE of three independent experiments. *=p-value<0.05, **=p-value<0.01, ****=p-value<0.0001. The densitometry values in the histogram are expressed as fold changes relative to scramble FANA, which was assigned a value of 1 (dotted line). (H) Proposed model of the “regulation of actin cytoskeleton” by TMEM123 was adapted from KEGG: Kyoto Encyclopedia of Genes and Genomes and created in Biorender.com. Solid arrows represent molecular interaction or relation; dash arrows represent indirect link or unknown reaction.
Figure 6
Figure 6
TMEM123 localizes at the clustering sites of TILs towards cancer cells and is essential for T cell motility. (A) Scheme of experimental procedure, representative images and derived quantifications from time-lapse analysis of cell-cell interactions and TMEM localization in CD4 and CD8 cells. Images were selected as time-frame snapshots, highlighting TMEM123 localization at T cell uropod-like protrusions. Graph shows the counts of TMEM positive CD4 (black circles) and CD8 (black squares) T cells over the time of imaging. (B) Polar plots over field of view and histograms over time show the spatial movement, in terms of movement display and path-length respectively, of positive TMEM123 CD4 (upper graphs) and CD8 (lower graphs) T cells with either TMEM 123 on the surface or internalized TMEM123. (C–E) Live-occurring cellular internalization of TMEM123 is observed within the cytoplasm of the T cells, following stable encounter with cancer cells. (C) Time frame snapshots showing TMEM123+ CD8 T cells (magenta contour) recruited towards a cluster of cancer cells (HT29) (contoured in yellow polymorphic shape). Yellow arrows point to anti-TMEM positive rafts on T cell uropods. (D) High resolution dark-field contrasted time frames. In red anti-TMEM123 mAbs (indicated by white arrows) and in green T cells membrane (WGA). (E) Graphs show numeric quantifications of surface (circles) and TMEM123-internalized (squares) CD8 (upper) and CD4 (lower) T cells over the time of imaging.
Figure 7
Figure 7
TMEM123 promotes CD8 T cells clustering on cancer cells in CRC-tumoroid co-culture models. TMEM123 silencing affects migration of CD8 T cells in co-culture with tumoroids. (A) Representative low magnification whole-well images of co-cultures (CD8 in green; CD8+TMEM123 in green+red). (B) CD8 migration was monitored and plotted over time. (C) TMEM123+ CD8 T cell migration was analyzed comparing scramble FANA-aso versus TMEM123 FANA-aso T cells (p<0.0001, 2-way ANOVA; n=4). (D) CRC-tumoroid cell survival during imaging comparing the co-culture with scramble FANA-aso CD8 T cells versus TMEM123 FANA-aso CD8 T cells (p<0.0001, 2-way-ANOVA; n=4). (E) Representative high magnification images show static frames at 140 hours of co-culture between CRC organoid (red binary contour) and either scramble FANA-aso CD8 T cells (left) or TMEM123 FANA-aso silenced CD8 Tcells. T cells already migrated within CRC-organoids are highlighted by yellow arrowheads, whereas T cells still migrating towards the organoid (even after 140 h) are highlighted by magenta arrowheads. (F) Representative images show whole-mount staining for TMEM123 (red), Pan-Keratin (yellow), CD8 (magenta) of fixed CRC organoids at the end of the live co-culture experiments monitored in (A–E). (G–I) Analysis of the CRC-organoids live-stained for live/dead labelling during the co-culture with CD8 T cells. A total of n=121 CRC-organoids and n=61430 T cells was analyzed over time. Quantification via digital segmentation and object classification shows the number of alive cells (G) and dead cells (H) within the organoid structures over time, also plotted as live/dead cellular ratio normalized for number of organoids (I). (J) Representative image of the co-culture among CRC-organoids and T cells with or without TMEM123 silencing. CRC organoids live-stained for live/dead labelling (respectively green and red) and T cells live-nuclearly labelled with live-hoechst solution. Magnification 10X, n=3 selected FOVs for each well. Mann-Whitney unpaired comparisons and Kruskal-Wallis tests for non-parametric variable analysis over time. *= p-value < 0.05, **= p-value < 0.01, ***= p-value < 0.001, ****= p-value < 0.0001.

References

    1. Nguyen KB, Spranger S. Modulation of the immune microenvironment by tumor-intrinsic oncogenic signaling. J Cell Biol (2020) 219. doi: 10.1083/jcb.201908224 - DOI - PMC - PubMed
    1. Schwörer S, Vardhana SA, Thompson CB. Cancer metabolism drives a stromal regenerative response. Cell Metab (2019) 29:576–91. doi: 10.1016/j.cmet.2019.01.015 - DOI - PMC - PubMed
    1. Ostroumov D, Fekete-Drimusz N, Saborowski M, Kühnel F, Woller N. CD4 and CD8 T lymphocyte interplay in controlling tumor growth. Cell Mol Life Sci (2018) 75:689–713. doi: 10.1007/s00018-017-2686-7 - DOI - PMC - PubMed
    1. Hendry S, Salgado R, Gevaert T, Russell PA, John T, Thapa B, et al. Assessing tumor-infiltrating lymphocytes in solid tumors: a practical review for pathologists and proposal for a standardized method from the international immunooncology biomarkers working group: part 1: assessing the host immune response, TILs in invasi. Adv Anat Pathol (2017) 24:235–51. doi: 10.1097/PAP.0000000000000162 - DOI - PMC - PubMed
    1. Fu Q, Chen N, Ge C, Li R, Li Z, Zeng B, et al. Prognostic value of tumor-infiltrating lymphocytes in melanoma: a systematic review and meta-analysis. Oncoimmunology (2019) 8. doi: 10.1080/2162402X.2019.1593806 - DOI - PMC - PubMed

Publication types

Substances