. 2023 Jul 7;7(7):e2022GH000775.
doi: 10.1029/2022GH000775. eCollection 2023 Jul.

Mapping Potential Population-Level Pesticide Exposures in Ecuador Using a Modular and Scalable Geospatial Strategy

Affiliations

Mapping Potential Population-Level Pesticide Exposures in Ecuador Using a Modular and Scalable Geospatial Strategy

Federico Andrade-Rivas et al. Geohealth. .

Abstract

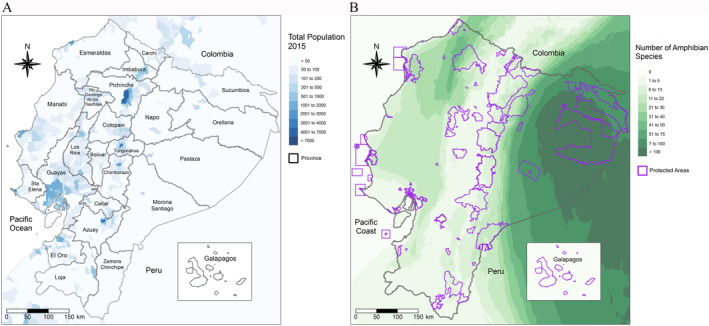
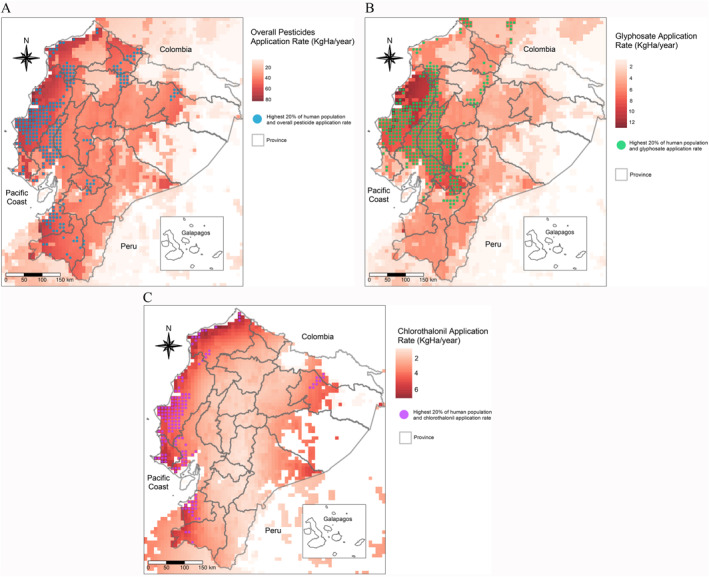
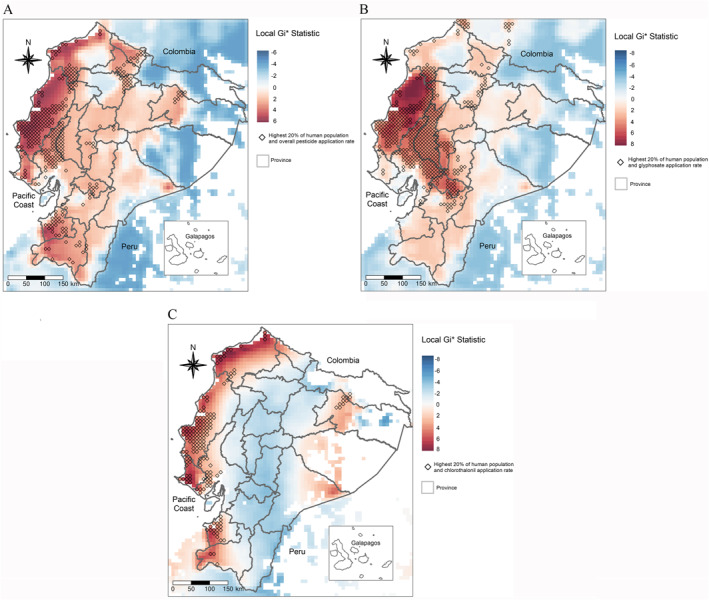
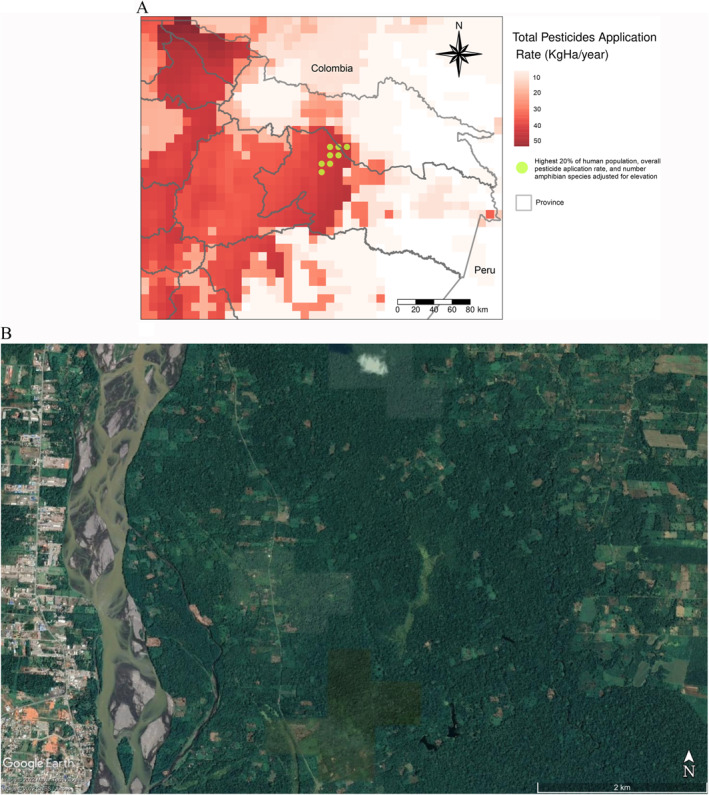
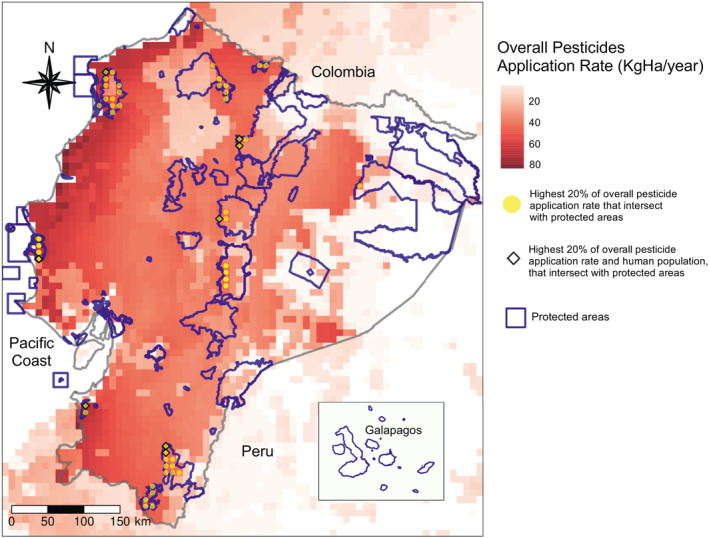
Human populations and ecosystems are extensively exposed to pesticides. Most nations lack the capacity to control pesticide contamination and have limited availability of pesticide use information. Ecuador is a country with intense pesticide use with high exposure risks to humans and the environment, although relative or combined risks are not well understood. Here, we analyzed the distribution of application rates in Ecuador and identified regions of concern because of high potential exposure. We used a geospatial analysis to identify grid cells (∼8 km × 8 km) where the highest pesticide application rates and density of human populations overlap. Furthermore, we identified other regions of concern based on the number of amphibian species as an indicator of ecosystem integrity and the location of natural protected areas. We found that 28% of Ecuador's population dwelled in areas with high pesticide application rate. We identified an area of ∼512 km2 in the Amazon region where high application rates, large human settlements, and a high number of amphibian species overlapped. Additionally, we distinguished clusters of pesticide application rates and human populations that intersected with natural protected areas. Ecuador exemplifies how pesticides are disproportionately applied in areas with the potential to affect human health and ecosystems' integrity. Global estimates of population dwelling, pesticide application rates, and environmental factors are key in prioritizing locations to conduct further exposure assessments. The modular and scalable nature of the geospatial tools we developed can be expanded and adapted to other regions of the world where data on pesticide use are limited.

Keywords: agrochemicals; ecosystem; environmental pollution; pesticides; population health; spatial analysis.


Conflict of interest statement

The authors declare no conflicts of interest relevant to this study.

Figures

Figure 1
Figure 1
Elevation in meters above the sea level (masl) in Ecuador. The country is divided into four natural regions known as Coast, Inter‐Andean, Amazon, and Galapagos Islands.
Figure 2
Figure 2
(a) Total human population of Ecuador in 2015 per pixel (∼1 km resolution at the equator). Based on the Gridded Population of the World (GPWv4); (b) Number of amphibian species based on the Global Amphibian Richness Grids 2015 (∼1 km resolution at the equator) and protected areas borders in Ecuador.
Figure 3
Figure 3
(a) Overall pesticide application rates in Ecuador. Dotted areas indicate where the highest 20% application rates and highest 20% population density overlapped; (b) Glyphosate application rates in Ecuador. Dotted areas indicate where the highest 20% application rates and highest 20% population density overlapped; (c) Chlorothalonil application rates in Ecuador. Dotted areas indicate where the highest 20% application rates and highest 20% population density overlapped. Note: Data on pesticide application rates were extracted from PEST‐CHEMGRIDSv1 (∼8 km resolution at the equator) for the year 2015. Application rates were not available for the Galapagos Province.
Figure 4
Figure 4
(a) Getis‐Ord Gi* statistic for overall pesticide application rates. Diamonds indicate areas where the highest 20% of human population density and the highest 20% of pesticide application rates overlap; (b) Getis‐Ord Gi* statistic for glyphosate application rates. Diamonds indicate areas where the highest 20% of human population density and the highest 20% of pesticide application rates overlap; (c) Getis‐Ord Gi* statistic for chlorothalonil application rates. Diamonds indicate areas where the highest 20% of human population density and the highest 20% of pesticide application rates overlap. Note: The Getis‐Ord Gi* statistic z‐score provides information on the intensity of the data clustering. Statistical significance was set to 99.9% for pesticide application rates hotspots (z‐score > 3.29). Application rates were not available for the Galapagos Province.
Figure 5
Figure 5
(a) Overall pesticide application rates in Ecuador. Data were extracted from PEST‐CHEMGRIDSv1 (∼8 km resolution at the equator) for the year 2015. Dotted areas indicate where the highest 20% application rates, highest 20% population density, and the highest 20% number of amphibian species adjusted for elevation overlapped; (b) Satellite image illustrating part of one of the eight 8 km × 8 km where the highest 20% application rates, highest 20% population density, and the highest 20% number of amphibian species adjusted for elevation overlapped. Note: CNES/Airbus image extracted from Google Earth v. 7.3.4 for 20 September 2018. Geographic coordinates: 0°24′36.07″S, 76°57′33.37″W. Eye altitude: 8.4 km.
Figure 6
Figure 6
Overall pesticide application rates in Ecuador. Data were extracted from PEST‐CHEMGRIDSv1 (∼8 km resolution at the equator) for the year 2015. Dotted areas indicate where the highest 20% application rates, and highest 20% population density overlapped. Diamonds indicate areas where the highest 20% of human population density and the highest 20% of pesticide application rates intersect with protected areas. Note: Application rates were not available for the Galapagos Province.

References

    1. Andino Padilla, D. U. (2021). Intoxicaciones ocupacionales agudas por herbicidas en Ecuador durante el periodo 2016–2020. Universidad Internacional SEK. https://repositorio.uisek.edu.ec/handle/123456789/4400
    1. Anselin, L. (1995). Local indicators of spatial association—LISA. Geographical Analysis, 27(2), 93–115. 10.1111/j.1538-4632.1995.tb00338.x - DOI
    1. Bernard, A. , Rowe, F. , Bell, M. , Ueffing, P. , & Charles‐Edwards, E. (2017). Comparing internal migration across the countries of Latin America: A multidimensional approach. PLoS One, 12(3), e0173895. 10.1371/journal.pone.0173895 - DOI - PMC - PubMed
    1. Bivand, R. , Keitt, T. , Rowlingson, B. , Pebesma, E. , Sumner, M. , Hijmans, R. , et al. (2015). Package ‘rgdal’. Bindings for the Geospatial Data Abstraction Library. Retrieved from https://cran.r-project.org/web/packages/rgdal/index. html
    1. Bivand, R. , Rundel, C. , Pebesma, E. , Stuetz, R. , Hufthammer, K. O. , & Bivand, M. R. (2017). Package rgeos. The Comprehensive R Archive Network. (CRAN).

LinkOut - more resources