. 2023 Jun 14;3(6):100501.
doi: 10.1016/j.crmeth.2023.100501. eCollection 2023 Jun 26.

Detection of endogenous translesion DNA synthesis in single mammalian cells

Affiliations

Detection of endogenous translesion DNA synthesis in single mammalian cells

Tom Egger et al. Cell Rep Methods. .

Abstract

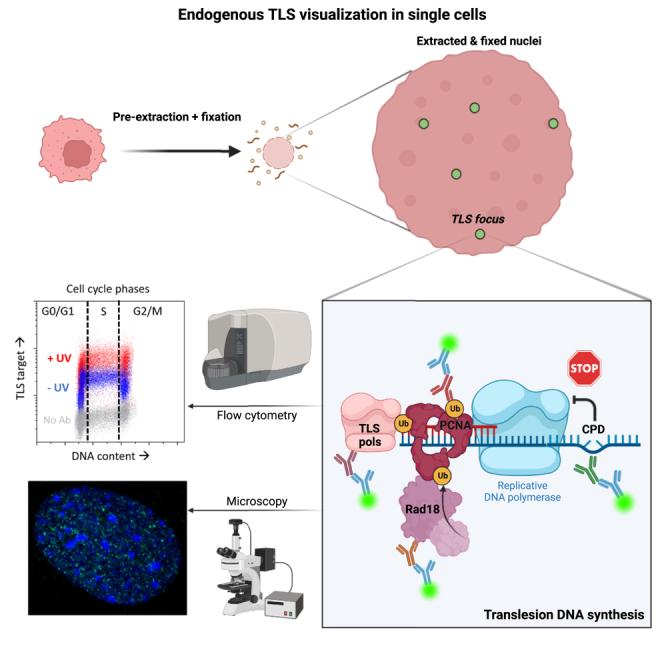
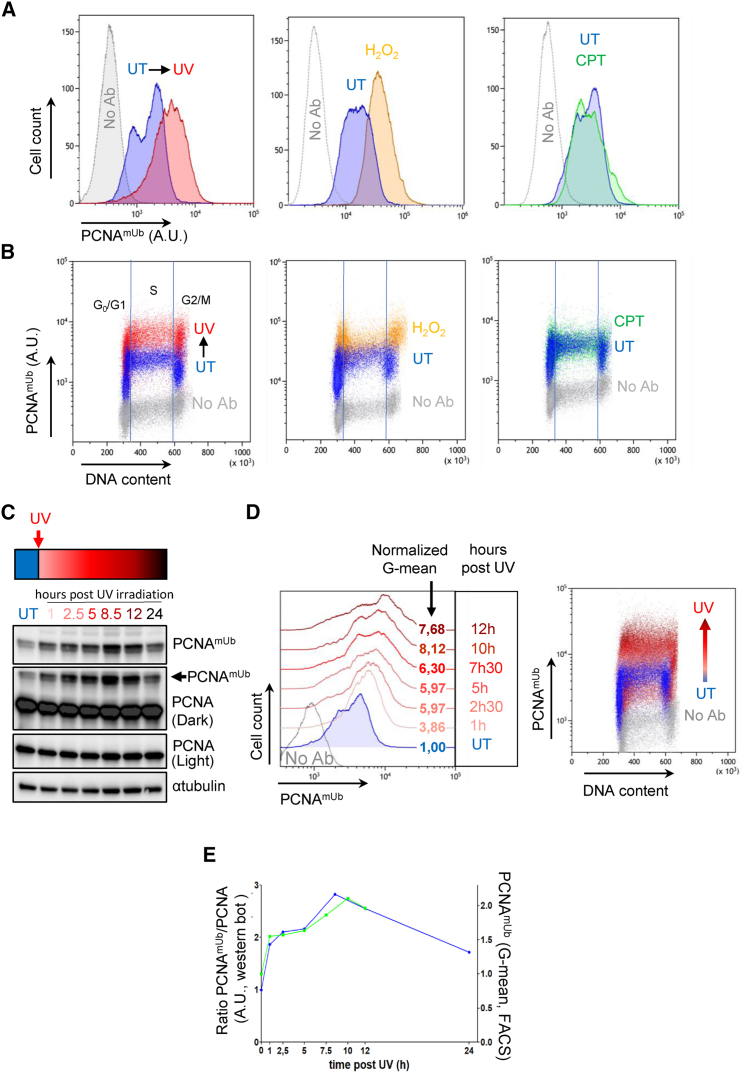
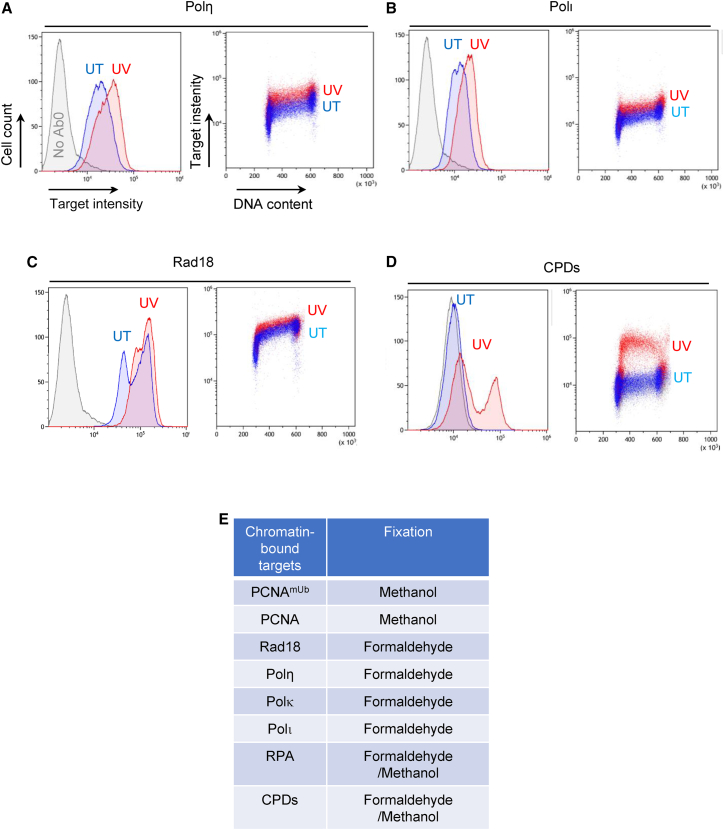
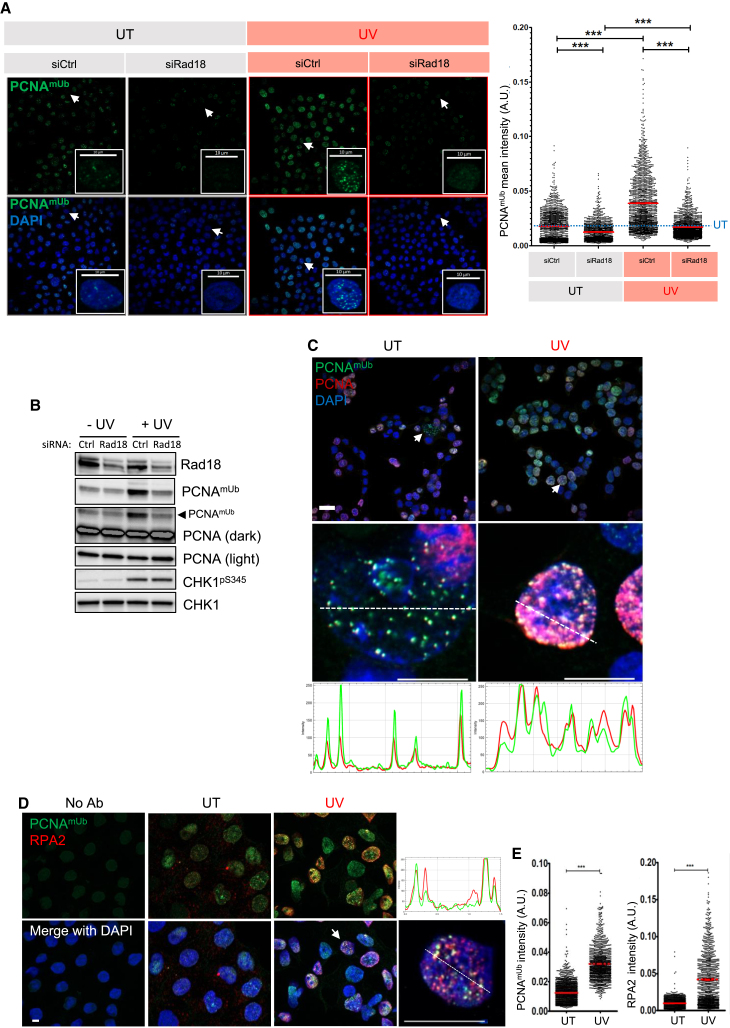
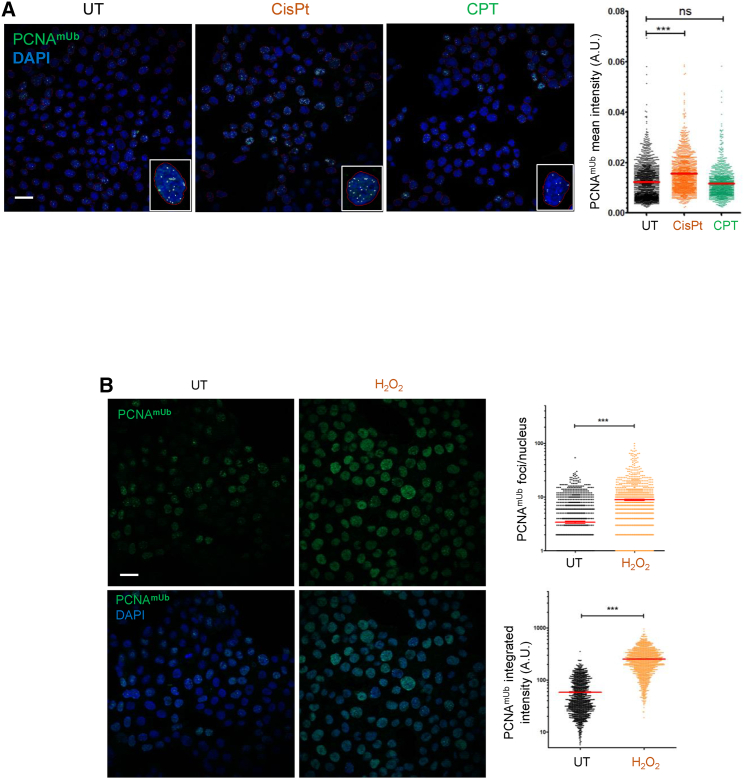
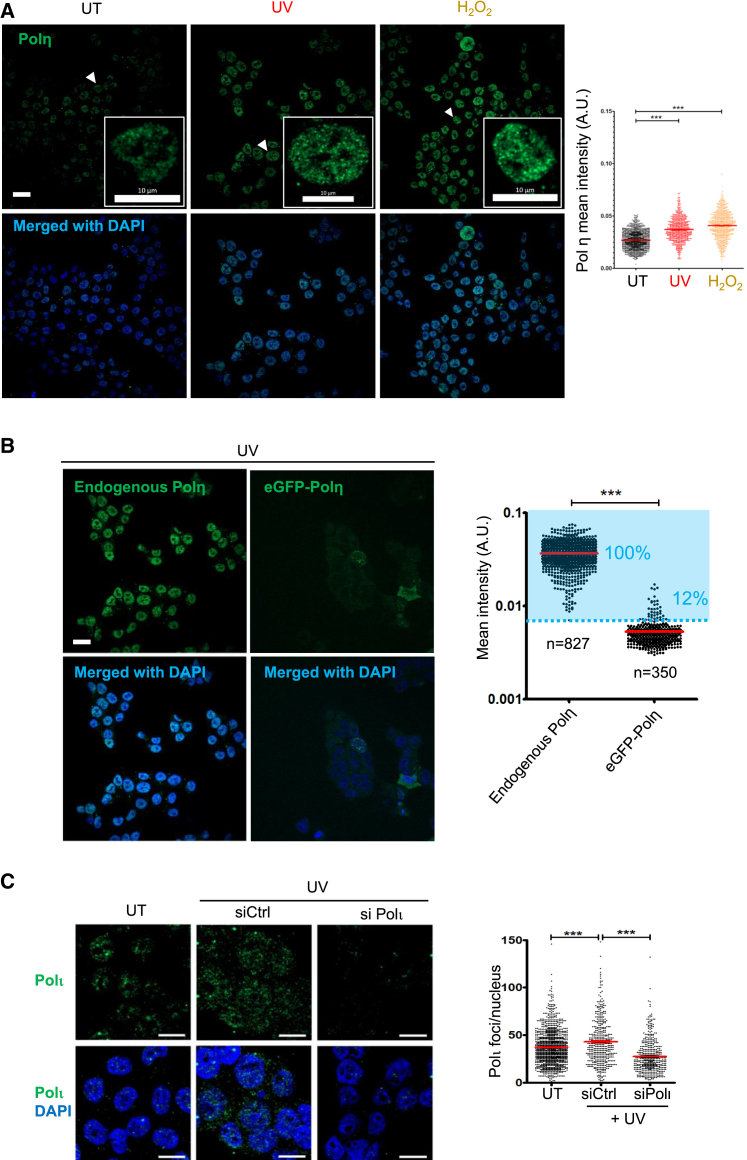
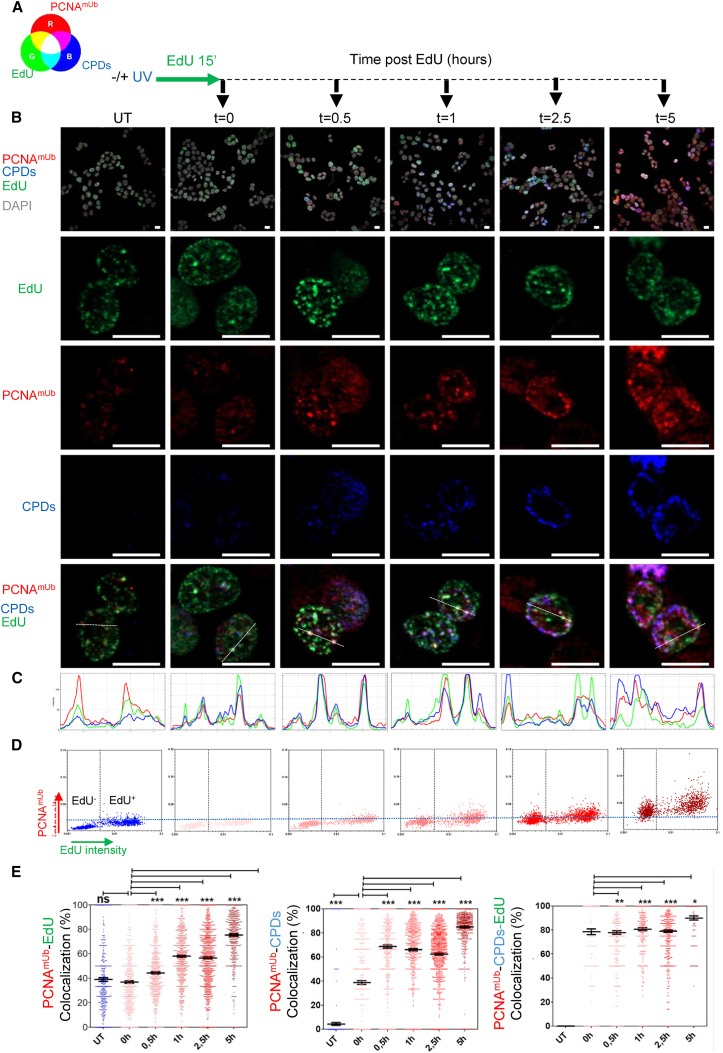
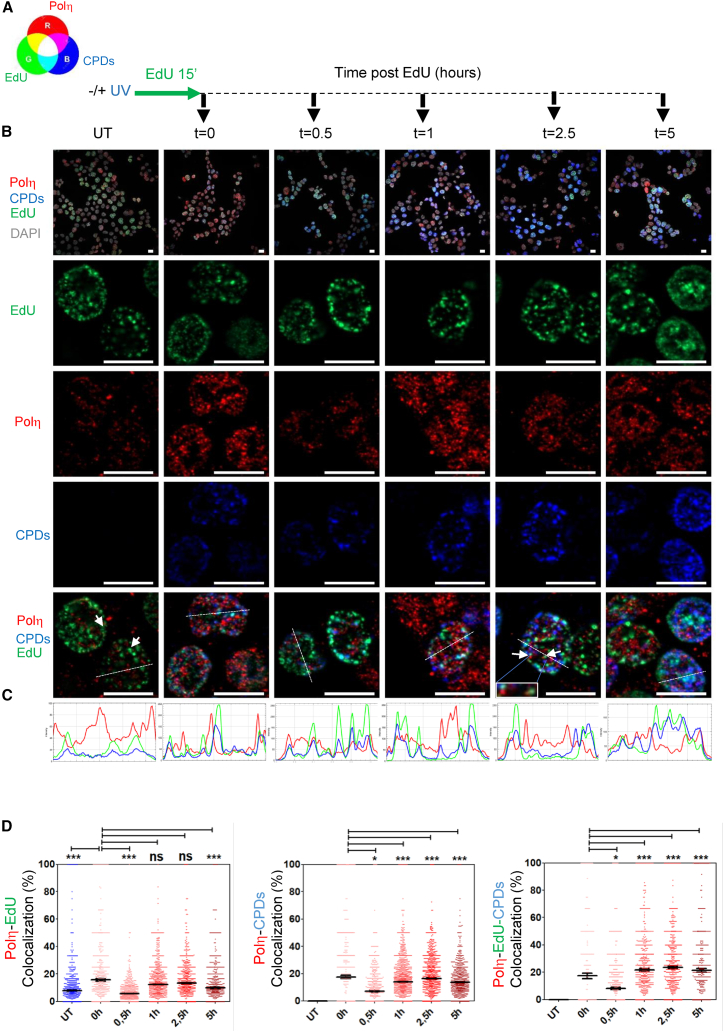
Translesion DNA synthesis (TLS) is an evolutionarily conserved process that cells activate to tolerate DNA damage. TLS facilitates proliferation under DNA damage conditions and is exploited by cancer cells to gain therapy resistance. It has been so far challenging to analyze endogenous TLS factors such as PCNAmUb and TLS DNA polymerases in single mammalian cells due to a lack of suitable detection tools. We have adapted a flow cytometry-based quantitative method allowing detection of endogenous, chromatin-bound TLS factors in single mammalian cells, either untreated or exposed to DNA-damaging agents. This high-throughput procedure is quantitative, accurate, and allows unbiased analysis of TLS factors' recruitment to chromatin, as well as occurrence of DNA lesions with respect to the cell cycle. We also demonstrate detection of endogenous TLS factors by immunofluorescence microscopy and provide insights into TLS dynamics upon DNA replication forks stalled by UV-C-induced DNA damage.

Keywords: CPDs; DNA damage tolerance; PCNAmUb; TLS pols; UV-C; XP-V; chromatin; flow cytometry; oxidative stress; replication stress.


Conflict of interest statement

The authors declare no competing interests.

Figures

None
Graphical abstract
Figure 1
Figure 1
Detection of endogenous PCNAmUb recruitment to chromatin by flow cytometry (A) Detection of endogenous PCNAmUb in HCT116 cells either untreated (UT, blue) or exposed to 20 J/m2 of UV-C light (UV, red), 1 mM hydrogen peroxide (H2O2, orange), or 1 μM camptothecin (CPT, green) by flow cytometry. A sample devoid of primary antibody (No Ab) was included as a control. Data were plotted as PCNAmUb fluorescence intensity versus the total cells count. A.U., arbitrary units. n = 3. (B) In this panel, PCNAmUb fluorescence intensity was plotted against the DAPI fluorescence that counterstains the DNA (DNA content), thus giving the cell cycle profile. n = 3. (C and D) Time course of PCNAmUb analyzed by either western blot (C) or flow cytometry (D) in HCT116 cells UT or exposed to 20 J/m2 UV. Samples were taken at the indicated times after UV irradiation (red arrow). The increase in the deepness of the red color indicates the increase in time. Data of (D) are plotted as in (A) and (B). No Ab was included as a control. n = 2. (E) Quantification of PCNAmUb time courses of (C) and (D). The western blot signals of PCNAmUb were normalized to the total PCNA level (blue line). The geometric mean (G-Mean) of cells computed by flow cytometry is plotted in green. n = 2.
Figure 2
Figure 2
Detection of endogenous Rad18 and TLS pols chromatin recruitment by flow cytometry (A–C) Detection of endogenous TLS pols (A and B) or Rad18 (C) in HCT116 cells either untreated (UT, blue) or exposed to 20 J/m2 of UV-C light (UV, red) by flow cytometry. A sample devoid of primary antibody (No Ab) was included as a control. Data are plotted as in Figures 1A and 1B. (D) Detection of UV-induced cyclobutane pyrimidine dimers (CPDs) by flow cytometry. No Ab was included as a control. Data are plotted as in Figures 1A and 1B. (E) Table describing the different fixation methods to detect chromatin-bound proteins related to the TLS pathway in human cells. n = 3. For more details see Egger et al.
Figure 3
Figure 3
Detection of nuclear PCNAmUb in single cells by immunofluorescence (A) HCT116 cells untreated (UT), or exposed to 20 J/m2 of UV-C (UV, red), treated with either siRNA control (siCtrl) or an siRNA targeting Rad18 (siRad18). Cells were stained with the PCNAmUb antibody and visualized by indirect immunofluorescence. DNA was counterstained with DAPI. Insets: magnification of single cells (indicated by a white arrow). Right: quantification of PCNAmUb foci with CellProfiler software (see STAR Methods). A.U., arbitrary units. Stars indicate significant differences, ∗∗∗p < 0.001 (non-parametric Mann Whitney test). n = 3. (B) Western blot of HCT116 cells of the experiment shown in (A), treated with the indicated siRNA, exposed (+UV) or not (−UV) to 20 J/m2 of UV-C. Proteins were detected with the indicated antibodies. The anti-PCNA antibody detects both unmodified and PCNAmUb, n = 3. (C) Top: HCT116 cells UT or exposed to UV-C (UV) were co-stained with both PCNAmUb and total PCNA and viewed by indirect immunofluorescence. DNA was visualized with DAPI. Middle: magnification of a nucleus from a single cell of each panel (indicated by a white arrow). Cross-sections were drawn with Zen Blue software to quantify the co-localized relative intensities of PCNAmUb (green) and PCNA (red) fluorescence. Bottom: quantification of the relative intensity of the cross-section for both PCNA and PCNAmUb labeling of each nucleus of the middle panel. n = 2. Scale bar: 10 μm. (D) HCT116 cells UT or exposed to UV-C (UV) were co-stained with both PCNAmUb and RPA2 antibodies and viewed by indirect immunofluorescence. DNA was visualized with DAPI. Far top right: quantification of the relative intensity of the cross-section here below for both PCNA and RPA2 labeling of the nucleus indicated by a white arrow. The cross-section was drawn with ImageJ software to visualize co-localization of PCNAmUb (green) with RPA2 (red) fluorescence. n = 2. Scale bar: 10 μm. (E) Quantification of either PCNAmUb (left) or RPA2 (right) of experiment shown in (D). Stars indicate significant differences, ∗∗∗p < 0.001. ns, non-significant (non-parametric Mann Whitney test).
Figure 4
Figure 4
PCNAmUb detection by immunofluorescence in HCT116 cells exposed to different DNA-damaging agents (A) Left: wide-field images of HCT116 cells untreated (UT) or exposed to either 30 μM cisplatin (CisPt) or 1 μM camptothecin (CPT) stained with the anti-PCNAmUb antibody and counterstained with DAPI to visualize nuclei. Insets: magnification of individual nuclei. Right: quantification of PCNAmUb immunofluorescence mean intensity of nuclei assessed with CellProfiler. Scale bar: 20 μm. n = 2. (B) Left: wide-field images of HCT116 cells UT or exposed to hydrogen peroxide (H2O2), stained with the anti-PCNAmUb antibody and counterstained with DAPI to visualize nuclei. Right: quantification of PCNAmUb of the left panel. Scale bar: 20 μm. n = 2.
Figure 5
Figure 5
Detection of nuclear Polη in HCT116 cells treated with different DNA-damaging agents (A) Left: detection of chromatin-bound Polη in HCT116 cells untreated (UT) or exposed to either 20 J/m2 of UV-C light (UV), or 1 mM hydrogen peroxide (H2O2). Scale bar: 20 μm. Insets: magnification of the nuclei indicated by a white arrow. Right: quantification of Polη mean intensity in the indicated samples. A.U., arbitrary units. n = 3. Stars indicate significant differences. ∗∗∗p < 0.001 (non-parametric Mann Whitney test). UV, n = 3; H2O2, n = 2. (B) Left detection of either endogenous or ectopically expressed EGFP-Polη chromatin bound in HCT116 cells exposed to 20 J/m2 of UV-C. Right: quantification of Polη foci intensity in the indicated samples. The percentage of Polη+ cells (blue gate) is indicated. Scale bar: 20 μm. Stars indicate significant differences. ∗∗p < 0.001 (non-parametric Mann Whitney test). n = 3. (C) Left: detection of Polι by indirect immunofluorescence in HCT116 cells treated with either control siRNA (Ctrl) or Polι-specific siRNA, UT or exposed to 20 J/m2 UV. Right: quantification of Polι foci per nucleus shown in (A). ∗∗∗p < 0.001 (non-parametric Mann Whitney test). n = 2.
Figure 6
Figure 6
Nuclear PCNAmUb co-localization with UV-C-induced DNA lesions and sites of DNA synthesis in single cells (A) Schematic drawing of the experimental procedure. A color table is included to facilitate the interpretation of the results. (B) First row: wide-field images of HCT116 cells untreated (UT −UV) or exposed to UV-C (+UV), followed by pulse labeling with the nucleotide analog EdU. Antibodies were used to detect PCNAmUb (red) and CPDs (blue), and EdU (green) was detected by click reaction (see STAR Methods) at the indicated times after UV-C exposure and viewed by indirect immunofluorescence. DNA was visualized with DAPI (gray). Other rows: magnification of single-cell nuclei from each wide field corresponding to each time point. Scale bar: 10 μm. (C) Quantification of the relative intensity of the cross sections of the nuclei magnified in the top panel. (D) Quantification of relative EdU and PCNAmUb levels at the indicated time points post-UV irradiation. The black dashed line discriminates EdU from EdU+ cells (i.e., cells that were in S phase during the EdU pulse). The blue dashed line discriminates PCNAmUb-negative from PCNAmUb-positive cells (arbitrary gates). n = 2. (E) Quantification of PCNAmUb-EdU (left), PCNAmUb-CPD (middle, and PCNAmUb-CPD-EdU (right) co-localization. Stars indicate significant differences, ∗p < 0.05, ∗∗ p < 0.01, ∗∗∗p < 0.001, ns, non-significant (non-parametric Mann Whitney test).
Figure 7
Figure 7
Nuclear Polη co-localization with UV-C-induced DNA lesions and sites of DNA synthesis by immunofluorescence in single cells (A) Schematic drawing of the experimental procedure. A color table is included to facilitate the interpretation of the results. (B) First row: wide-field images of HCT116 cells untreated (UT −UV) or exposed to UV-C light (+UV), followed by pulse labeling with the nucleotide analog EdU. Antibodies were used to detect Polη (red) and CPDs (blue), and EdU (green) was detected by click reaction at the indicated times after UV-C exposure and viewed by indirect immunofluorescence. DNA was visualized with DAPI (gray). Other rows: magnification of nuclei of single cells from each wide field corresponding to each time point. Scale bar: 10 μm. (C) Quantification of the relative intensity of the cross-sections of the nuclei magnified in the top panel. (D) Quantification of Polη-EdU (left), Polη-CPD (middle), and Polη-CPD-EdU (right) co-localization. Stars indicate significant differences, ∗p < 0.05; ∗∗∗p < 0.001; ns, non-significant (non-parametric Mann Whitney test).

References

    1. Powers K.T., Washington M.T. Eukaryotic translesion synthesis: choosing the right tool for the job. DNA Repair. 2018;71:127–134. doi: 10.1016/j.dnarep.2018.08.016. - DOI - PMC - PubMed
    1. Nayak S., Calvo J.A., Cantor S.B. Targeting translesion synthesis (TLS) to expose replication gaps, a unique cancer vulnerability. Expert Opin. Ther. Targets. 2021;25:27–36. doi: 10.1080/14728222.2021.1864321. - DOI - PMC - PubMed
    1. Russo M., Crisafulli G., Sogari A., Reilly N.M., Arena S., Lamba S., Bartolini A., Amodio V., Magrì A., Novara L., et al. Adaptive mutability of colorectal cancers in response to targeted therapies. Science. 2019;366:1473–1480. doi: 10.1126/science.aav4474. - DOI - PubMed
    1. Kannouche P.L., Wing J., Lehmann A.R. Interaction of human DNA polymerase eta with monoubiquitinated PCNA: a possible mechanism for the polymerase switch in response to DNA damage. Mol. Cell. 2004;14:491–500. - PubMed
    1. Watanabe K., Tateishi S., Kawasuji M., Tsurimoto T., Inoue H., Yamaizumi M. Rad18 guides poleta to replication stalling sites through physical interaction and PCNA monoubiquitination. EMBO J. 2004;23:3886–3896. - PMC - PubMed

Publication types

LinkOut - more resources