. 2023 May 24;3(6):100486.
doi: 10.1016/j.crmeth.2023.100486. eCollection 2023 Jun 26.

DiI-CT-A bimodal neural tracer for X-ray and fluorescence imaging

Affiliations

DiI-CT-A bimodal neural tracer for X-ray and fluorescence imaging

Ben Gerhardt et al. Cell Rep Methods. .

Abstract

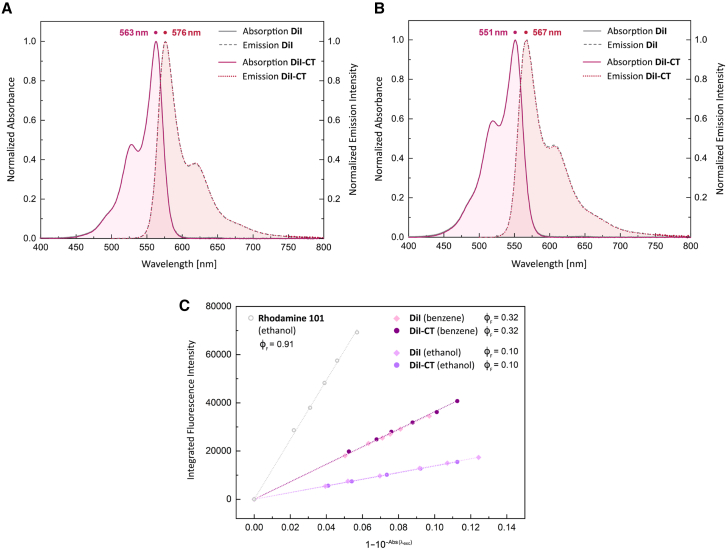
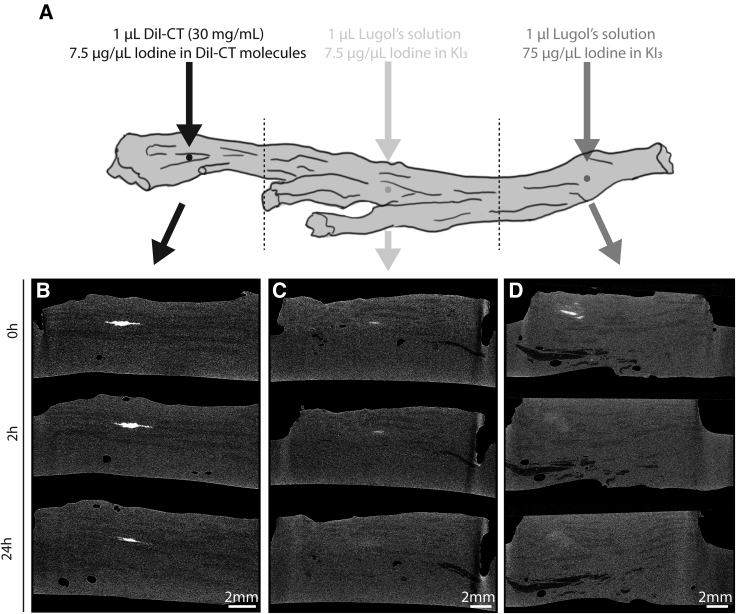
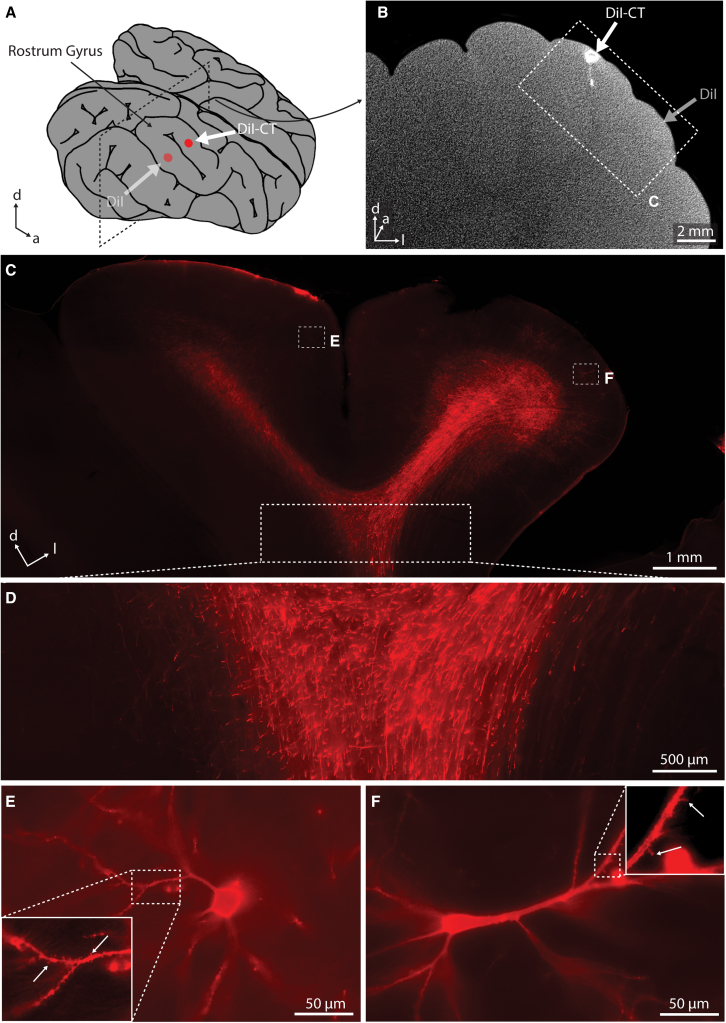
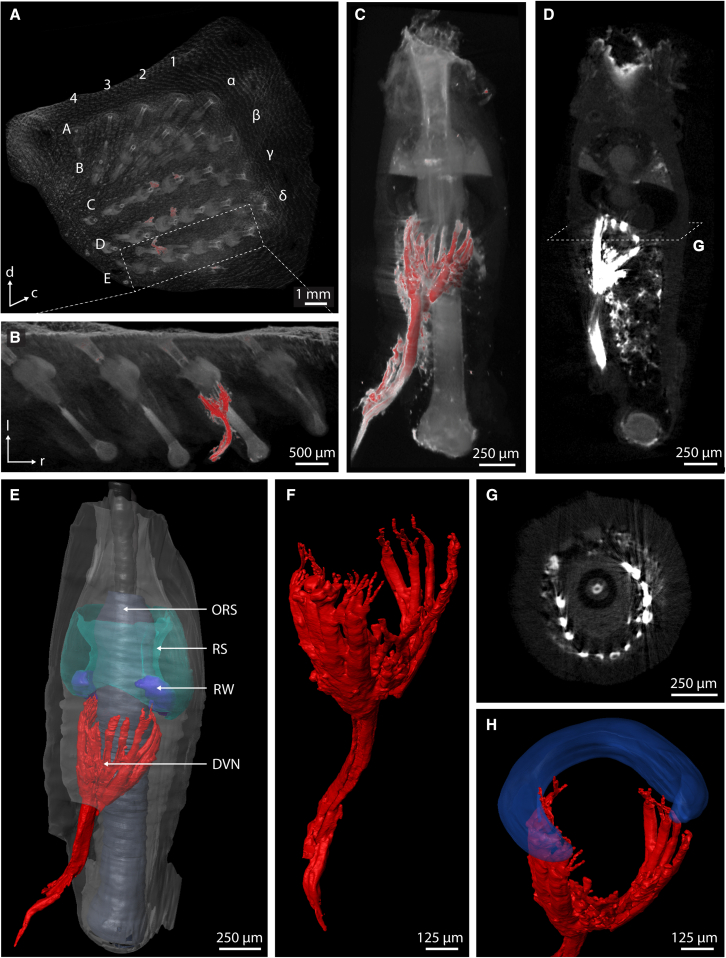
Here, we present an X-ray-visible neural tracer, referred to as DiI-CT, which is based on the well-established lipophilic indocarbocyanine dye DiI, to which we conjugated two iodine atoms. The tracer is visible with microfocus computed tomography (microCT) imaging and shares the excellent fluorescent tracing properties of DiI. We document the discovery potential of DiI-CT by analyzing the vibrissa follicle-sinus complex, a structure where visual access is poor and 3D tissue structure matters and reveal innervation patterns of the intact follicle in unprecedented detail. In the brain, DiI-CT tracing holds promise for verification evaluation of indirect connectivity measures, such as diffusion tensor imaging. We conclude that the bimodal dye DiI-CT opens new avenues for neuroanatomy.

Keywords: X-ray; dual contrast agents; indocarbocyanine dyes; microCT; neuroanatomy; tracing; volume-imaging.


Conflict of interest statement

The authors declare no competing interests.

Figures

None
Graphical abstract
Figure 1
Figure 1
Molecular structure of DiI-CT DiI-CT is a π-conjugated cyanine system (violet) comprising two indoline rings, each linked to a C16 alkyl chain via the respective nitrogen, that both contain a single iodine atom (gray) at the terminal carbon position.
Figure 2
Figure 2
Fluorescence spectra and intensity of DiI-CT and DiI (A and B) Normalized absorption and fluorescence spectra of DiI and DiI-CT in (A) benzene and (B) ethanol at 25°C. Absorbance and emission curves of DiI-CT and DiI (Figures S1 and S2), which match indistinguishably, are superimposed. (C) Linear fits of corrected integrated fluorescence intensity versus 110Abs(λexc) for DiI-CT and DiI in benzene and ethanol, as well as Rhodamine 101 in ethanol as the fluorescence reference standard at 25°C and corresponding fluorescence quantum yields.
Figure 3
Figure 3
X-ray contrast and staining behavior of DiI-CT and iodine (KI₃) solution (A) Schematic of DiI-CT and iodine (KI₃) injections into a pig ION. (B–D) Time series of microCT scans of a pig ION (virtual longitudinal section) injected with (B) 1 μL DiI-CT containing 7.5 μg iodine in DiI-CT molecules, (C) 1 μL Lugol’s solution containing 7.5 μg iodine, and (D) 1 μL Lugol’s solution containing 75 μg iodine. Virtual sections were aligned by eye to each show the respective injection site, as illustrated in (A), 0 h, 2 h, and 24 h after dye injection. MicroCT scans were performed with the same parameters of 500-ms exposure time, 40 kV, and 110 μA and projections taken every 0.2° over continuous 360° rotation with a field of view corresponding to a cube with side lengths of 27.4 mm.
Figure 4
Figure 4
Bimodal fluorescence and X-ray imaging of nerve tissue with DiI-CT (A and B) Alignment of a transverse section with (A) a bright-field image and red fluorescence superimposed and (B) microCT virtual transverse section of the same pig ION stained with DiI-CT. Insets show high magnification of the labeling, where accumulation of DiI-CT in myelin sheets can be observed with red fluorescence. DiI-CT X-ray signal spatially matches the fluorescent labeling, but single-fiber resolution was not achieved with the given scan. (C and D) Alignment of a longitudinal section with (C) a bright-field image and red fluorescence superimposed and (D) microCT virtual longitudinal section of the same pig ION stained with DiI-CT.
Figure 5
Figure 5
Fluorescent neuronal labeling of DiI and DiI-CT is equivalent (A) Piglet brain illustration with injection sites of DiI (lateral rostrum gyrus) and DiI-CT (medial rostrum gyrus). (B) MicroCT scan coronal virtual section of a piglet brain injected with DiI (lateral rostrum gyrus) and DiI-CT (medial gyrus) and counterstained with 1% phosphotungstic acid (PTA). The field of view of the microCT scan corresponds to a cube with side lengths of 46 mm. (C) Fluorescence image of the same piglet brain as in (B), zoomed in on the rostrum gyrus region as indicated with the inset in (B). Cells that are labeled with DiI or DiI-CT express strong fluorescence (red). (D) DiI- and DiI-CT-stained axon bundles projecting from and to the rostrum gyrus region. Cells labeled with either dye cannot be told apart. (E and F) (E) High magnification of a DiI-CT-stained pyramidal cell (left inset from C) and (F) a DiI-stained pyramidal cell (right inset from C). Fluorescent cell labeling through either dye allows identification of spines, a distinct sub-cellular feature (arrows in insets of E and F). d, dorsal; a, anterior; l, lateral.
Figure 6
Figure 6
DiI-CT reveals radially asymmetric innervation of the vibrissa follicle (A) MicroCT volume rendering of a rat left whisker pad. The grid-like architecture of the mystacial vibrissae was visualized by PTA counterstaining. Individual vibrissal nerves, labeled from DiI-CT microinjections, carry especially strong X-ray contrast and are shown in red. (B) High magnification of the E row from the whisker pad in (A), showing the distinct innervation of the E3 follicle through DiI-CT labeling. (C and D) 2D longitudinal virtual section (C) and 3D volume rendering (D) of the extracted E3 whisker follicle from (B). (E) Segmentation of the E3 follicle, with key structures rendered in different colors (collagenous capsule in gray, outer root sheath [ORS] in purple, ring sinus [RS] in mint green, ring wulst [RW] in blue, deep vibrissal nerve [DVN] in red). (F) Magnified reconstruction of the DVN innervating the E3 follicle, revealing the branching behavior into 13 thick arms, which further subdivide into ∼30 fine afferences. (G) 2D transverse virtual section of the E3 FSC inferior to the ring wulst, as shown in (D), shows radially asymmetric distribution of the afferent innervation around the vibrissa shaft circumference. (H) Oblique view of the radially asymmetric branches of the DVN branches and the ring wulst. This remarkably asymmetric innervation pattern with two opposing C shapes of the RW and nerve branches was seen in all DiI-CT-injected follicles. ORS, outer root sheath; c, caudal; l, lateral; r, rostral.

References

    1. Golgi C. Sulla struttura della sostanza grigia della cervello. Gazz. Med. Ital. Lobardia. 1873;6:244–246.
    1. Cajal S.R.Y. Estructura de los centros nerviosos de las aves. Rev. Trum. Histol. Norm. Pat. 1888;1:1–10.
    1. Scanziani M., Häusser M. Electrophysiology in the age of light. Nature. 2009;461:930–939. doi: 10.1038/nature08540. - DOI - PubMed
    1. Hell S.W., Wichmann J. Breaking the diffraction resolution limit by stimulated emission: stimulated-emission-depletion fluorescence microscopy. Opt. Lett. 1994;19:780–782. doi: 10.1364/ol.19.000780. - DOI - PubMed
    1. Denk W., Strickler J.H., Webb W.W. Two-photon laser scanning fluorescence microscopy. Science. 1990;248:73–76. doi: 10.1126/science.2321027. - DOI - PubMed

Publication types

LinkOut - more resources