. 2023 Jun 19;9(6):e17434.
doi: 10.1016/j.heliyon.2023.e17434. eCollection 2023 Jun.

Non-neuronal cholinergic system delays cardiac remodelling in type 1 diabetes

Affiliations

Non-neuronal cholinergic system delays cardiac remodelling in type 1 diabetes

Pujika Emani Munasinghe et al. Heliyon. .

Retraction in

Abstract

Aims: Type 1 diabetes mellitus (T1DM) is associated with increased risk of cardiovascular disease (CVD) and mortality. The underlying mechanisms for T1DM-induced heart disease still remains unclear. In this study, we aimed to investigate the effects of cardiac non-neuronal cholinergic system (cNNCS) activation on T1DM-induced cardiac remodelling.

Methods: T1DM was induced in C57Bl6 mice using low-dose streptozotocin. Western blot analysis was used to measure the expression of cNNCS components at different time points (4, 8, 12, and 16 weeks after T1DM induction). To assess the potential benefits of cNNCS activation, T1DM was induced in mice with cardiomyocyte-specific overexpression of choline acetyltransferase (ChAT), the enzyme required for acetylcholine (Ac) synthesis. We evaluated the effects of ChAT overexpression on cNNCS components, vascular and cardiac remodelling, and cardiac function.

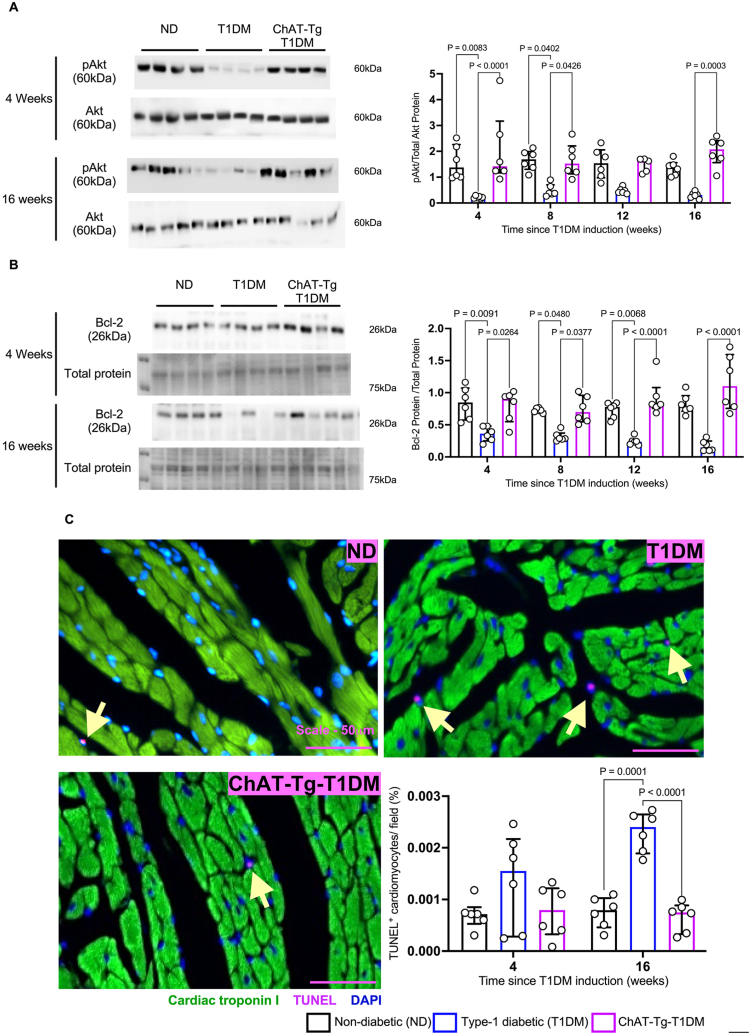
Key findings: Western blot analysis revealed dysregulation of cNNCS components in hearts of T1DM mice. Intracardiac ACh levels were also reduced in T1DM. Activation of ChAT significantly increased intracardiac ACh levels and prevented diabetes-induced dysregulation of cNNCS components. This was associated with preserved microvessel density, reduced apoptosis and fibrosis, and improved cardiac function.

Significance: Our study suggests that cNNCS dysregulation may contribute to T1DM-induced cardiac remodelling, and that increasing ACh levels may be a potential therapeutic strategy to prevent or delay T1DM-induced heart disease.

Keywords: Acetylcholine; Apoptosis; Cardiac function; Cardiac non-neuronal cholinergic system; Cardiovascular disease; Type 1 diabetes mellitus.


Conflict of interest statement

The authors declare the following financial interests/personal relationships which may be considered as potential competing interests:Rajesh Katare reports financial support was provided by 10.13039/501100001509Royal Society of New Zealand. Yoshihiko Kakinuma reports financial support was provided by 10.13039/501100001691Japan Society for the Promotion of Science. Yoshihiko Kakinuma reports financial support was provided by 10.13039/501100004330Smoking Research Foundation.

Figures

Fig. 1
Fig. 1
Representative Western blot images and quantitative scatter plot bar graphs showing the expression of Choline Acetyltransferase (ChAT, A), choline transporter-1 (CHT-1, B), Acetylcholine esterase (AChE, C), vesicular ACh transporter (VAChT, D) and type-2 muscarinic ACh receptor (M2AChR, G) at different time points after induction of type 1 diabetes mellitus (T1DM). Shapiro-Wilk test was used to test the normality of data distribution. Two-way analysis of variance yielded a significant interaction effect for ChAT (F(6, 60) = 5.76, p < 0.0001) and CHT-1 (F(6, 61) = 3.96, p = 0.0021) and a non-significant interaction for VAChT (F(6, 62) = 1.09, p = 0.374), AChE (F(6, 59) = 1.78, p = 0.119) and M2AChR (F(6, 60) = 0.96, p = 0.463). The non-parametric Kruskal-Wallis test was used to compare the expression levels between the groups. Data are presented as the ratio of the target protein to total protein as visualized by ponceau staining and are median with interquartile range. n = 6 in each group. All the western blots are repeated at least two independent times. For ChAT expression, although all the samples were run in the same blot (as shown in Supplemental Fig. 1), due to the strong expression of ChAT in the transgenic heart, the blots were first exposed to image ChAT expression in the transgenic heart, followed by exposing only the ND and T1DM groups for a longer time. A dotted line indicates this between the ND and T1DM group and the ChAT-Tg-T1DM group. E & F. Scatter plot bar graphs showing ACh levels in the study groups measured using HPLC (E, data presented as μmol/gram of heart tissue) and ACh assay kit (F). Shapiro-Wilk test was used to test the normality of data distribution. A two-tailed unpaired t-test was used to calculate the difference in ACh measured by HPLC (E) and the non-parametric Kruskal-Wallis test was used to compare the difference between the groups in ACh measured using the assay kit (F). Two-way analysis of variance yielded a significant interaction effect for ACh by assay kit (F(2, 17) = 4.04, p = 0.037). Data are presented as nmol/gram of total protein ratio of the target protein to total protein as visualized by ponceau staining and are median with interquartile range). n = at least 5 in each group. *P < 0.05, **P < 0.01 and ****P < 0.0001.
Fig. 2
Fig. 2
A&B. Representative Western blot images and quantitative scatter plot bar graphs showing the expression of pAkt and Akt (A) and Bcl-2 (B) at different time points after induction of type 1 diabetes mellitus (T1DM). Shapiro-Wilk test was used to test the normality of data distribution. Two-way analysis of variance yielded a significant interaction effect for Bcl-2 (F(6, 60) = 2.54, p = 0.0295) and a non-significant interaction for pAkt/Akt (F(6, 59) = 0.866, p = 0.525). The non-parametric Kruskal-Wallis test was used to compare the expression levels between groups. Data are presented as the ratio of the target protein to total protein as visualized by ponceau staining and are median with interquartile range. n = 6 in each group. All the western blots are repeated at least two independent times. C. Representative fluorescent microscopic images and quantitative scatter plot bar graphs showing TUNEL positive cardiomyocytes. Arrowheads points the apoptotic cell. Shapiro-Wilk test was used to test the normality of data distribution. Two-way analysis of variance yielded a significant interaction effect (F(2, 30) = 3.83, p = 0.0331) The non-parametric Kruskal-Wallis test was used to compare the TUNEL positive cardiomyocytes between the groups. Data are represented as TUNEL+ cardiomyocytes/field and are mean ± SEM. n = 6 in each group. Scale bars are 50 μm.
Fig. 3
Fig. 3
A-C. Representative microscopy images captured with polarised lens (A) and the quantitative scatterplot bar graphs showing the fold-changes in the fibrotic area compared to ND of the corresponding time point (B). Scale bars are 500 μm. Shapiro-Wilk test was used to test the normality of data distribution. Two-way analysis of variance yielded a significant interaction effect (F(2, 30) = 13.82, p < 0.0001) The non-parametric Kruskal-Wallis test was used to compare the TUNEL positive cardiomyocytes between the groups. n = 6 in each group. C-E. Representative confocal microscopy images (C) and the quantitative scatterplot bar graphs show the capillaries (isolectin, green, D) and arterioles (α-smooth muscle actin (α-SMA), red, arrowhead E) at different time points. Shapiro-Wilk test was used to test the normality of data distribution. Two-way analysis of variance yielded a significant interaction effect for capillaries (F(6, 55) = 5.232, p = 0.0003) and arterioles (F(6, 56) = 3.006, p = 0.0129). Tukey's multiple comparisons test was used to compare the capillaries and arteriole density between the groups. n = 6 in each group. Data are represented as the number of capillaries (D) and arterioles (E) per mm2 and are mean ± SD. (For interpretation of the references to colour in this figure legend, the reader is referred to the Web version of this article.)
Fig. 4
Fig. 4
Quantitative bar graphs showing the cardiac function measured using a pressure-volume catheter at different time points. EDV – Left ventricular (LV) end-diastolic volume; ESV – LV end-systolic volume; EF – LV ejection fraction; ESP – LV end-systolic pressure; EDP – LV end-diastolic pressure; HR – heart rate. Shapiro-Wilk test was used to test the normality of data distribution. The non-parametric Kruskal-Wallis test was used to compare the differences between the groups. N = 8–9 in each group.

References

    1. Federation ID . tenth ed. IDF; 2021. Diabetes Atlas.https://diabetesatlasorg
    1. Martinez-Ceron E., Garcia-Rio F. Mortality and cardiovascular disease in type 1 and type 2 diabetes. N. Engl. J. Med. 2017;377(3):300. - PubMed
    1. Rawshani A., Rawshani A., Gudbjornsdottir S. Mortality and cardiovascular disease in type 1 and type 2 diabetes. N. Engl. J. Med. 2017;377(3):300–301. - PubMed
    1. Huxley R.R., Peters S.A., Mishra G.D., Woodward M. Risk of all-cause mortality and vascular events in women versus men with type 1 diabetes: a systematic review and meta-analysis. Lancet Diabetes Endocrinol. 2015;3(3):198–206. - PubMed
    1. How O.-J., Aasum E., Severson D.L., Chan W.A., Essop M.F., Larsen T.S. Increased myocardial oxygen consumption reduces cardiac efficiency in diabetic mice. Diabetes. 2006;55(2):466–473. - PubMed

Publication types

LinkOut - more resources