

Pan-cancer analysis of the prognostic and immunological role of GJB2: a potential target for survival and immunotherapy
- PMID: 37427102
- PMCID: PMC10327570
- DOI: 10.3389/fonc.2023.1110207
Pan-cancer analysis of the prognostic and immunological role of GJB2: a potential target for survival and immunotherapy
Abstract
Background: GJB2 plays an essential role in the growth and progression of several cancers. However, asystematic pan-cancer analysis of GJB2 is lacking. Therefore, in this study, we performed a comprehensive pan-cancer analysis to determine the potential role of GJB2 in prognostic prediction and cancer immunotherapy response.
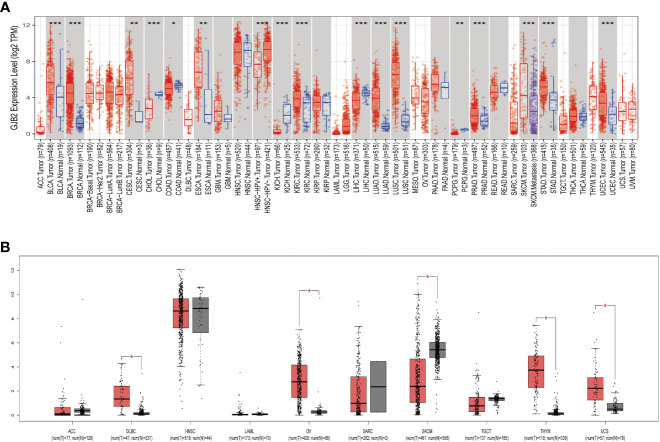
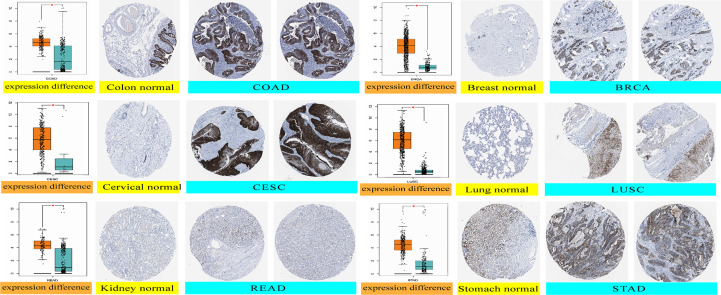
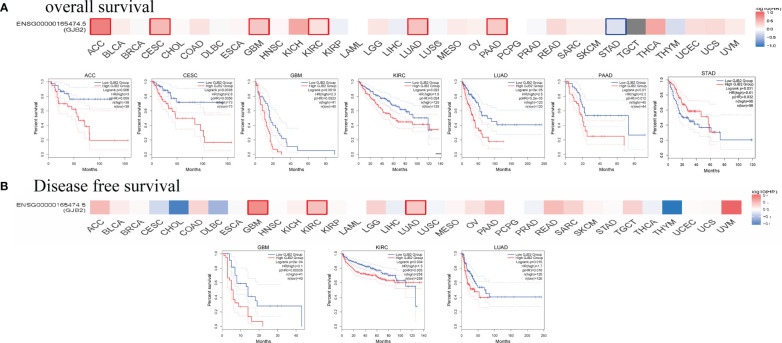
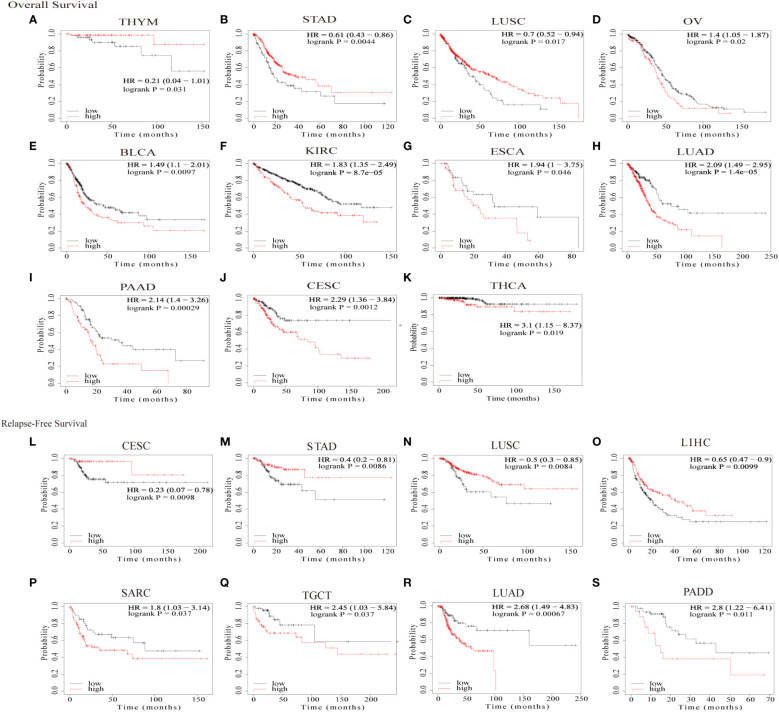
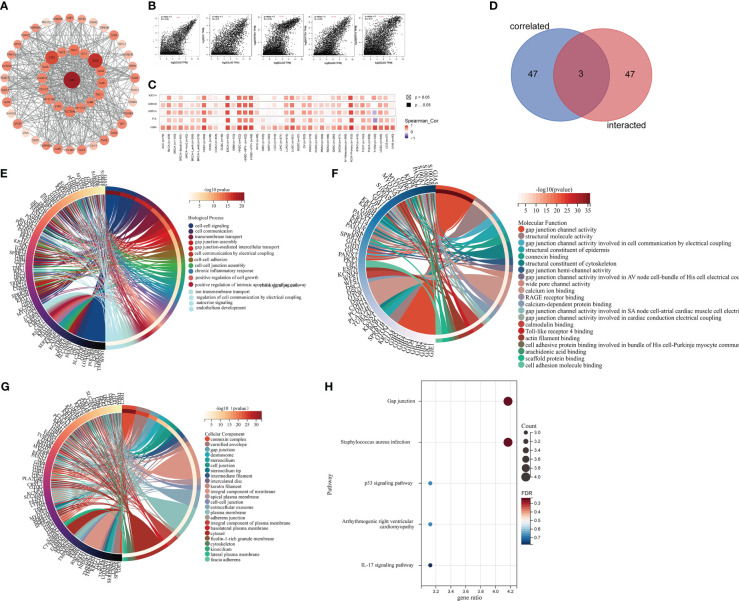
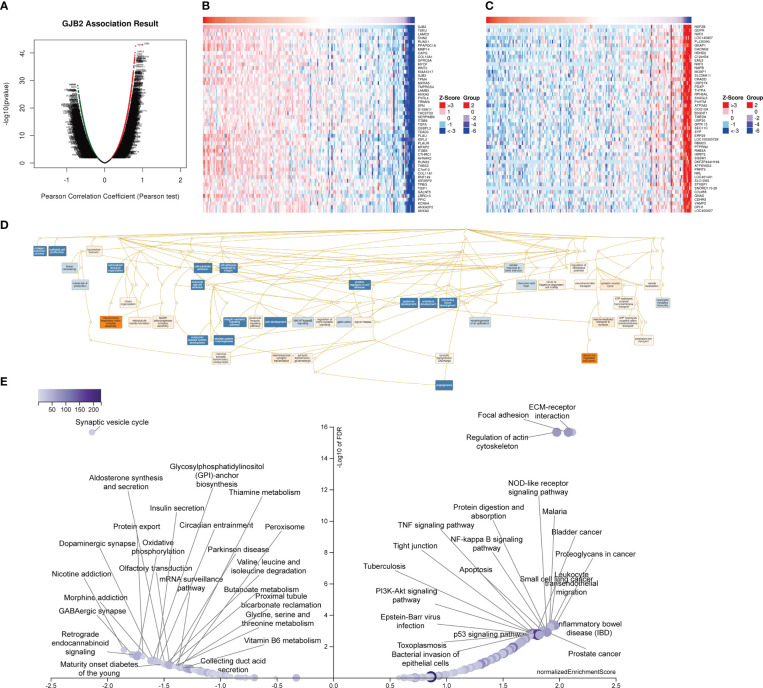
Methods: The differential expression of GJB2 in the tumor and adjacent normal tissues of various cancer types was analyzed using the TIMER, GEPIA, and Sangerbox databases. GEPIA and Kaplan-Meier plotter databases were used to analyze the survival outcomes based on GJB2 expression levels in pan-cancer. Furthermore, the association of GJB2 expression with the immune checkpoint (ICP) genes, tumor mutational load (TMB), microsatellite instability (MSI), neoantigens, and tumor infiltration of immune cells was analyzed using via the Sangerbox database. The cBioPortal database was used to determine the characteristics of GJB2 gene alterations in the cancer tissues. The STRING database was used to identify the GJB2-binding proteins. GEPIA database was used to identify the GJB2 co-expressed genes. DAVID was used to perform the functional enrichment analysis of gene ontology (GO) terms and KEGG pathways associated with GJB2. Finally, the mechanistic role of GJB2 in pancreatic adenocarcinoma (PAAD) was analyzed using the LinkedOmics database.
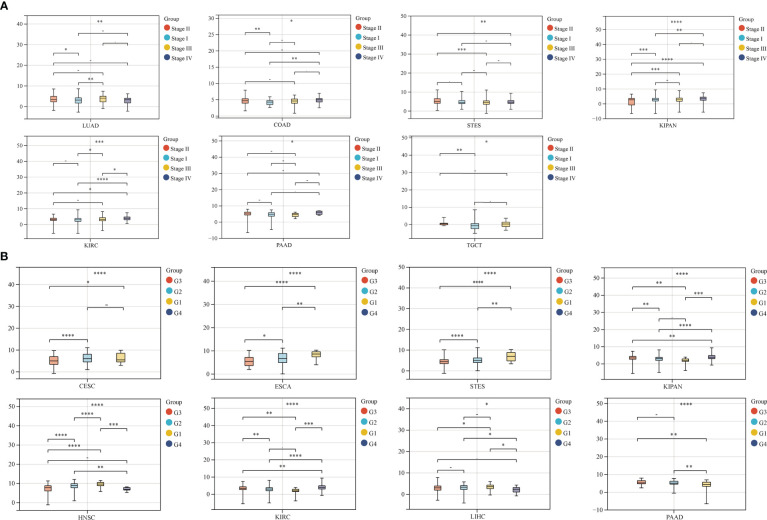
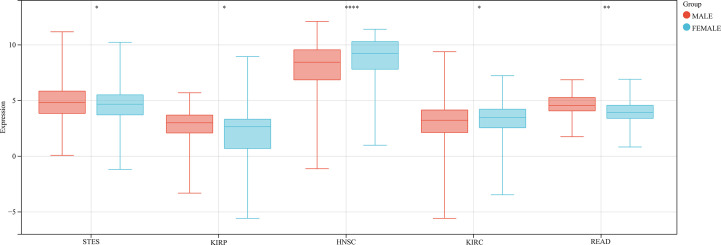
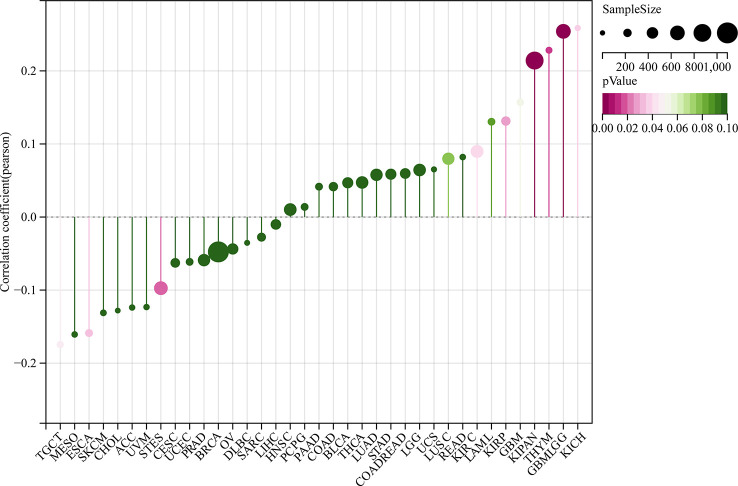
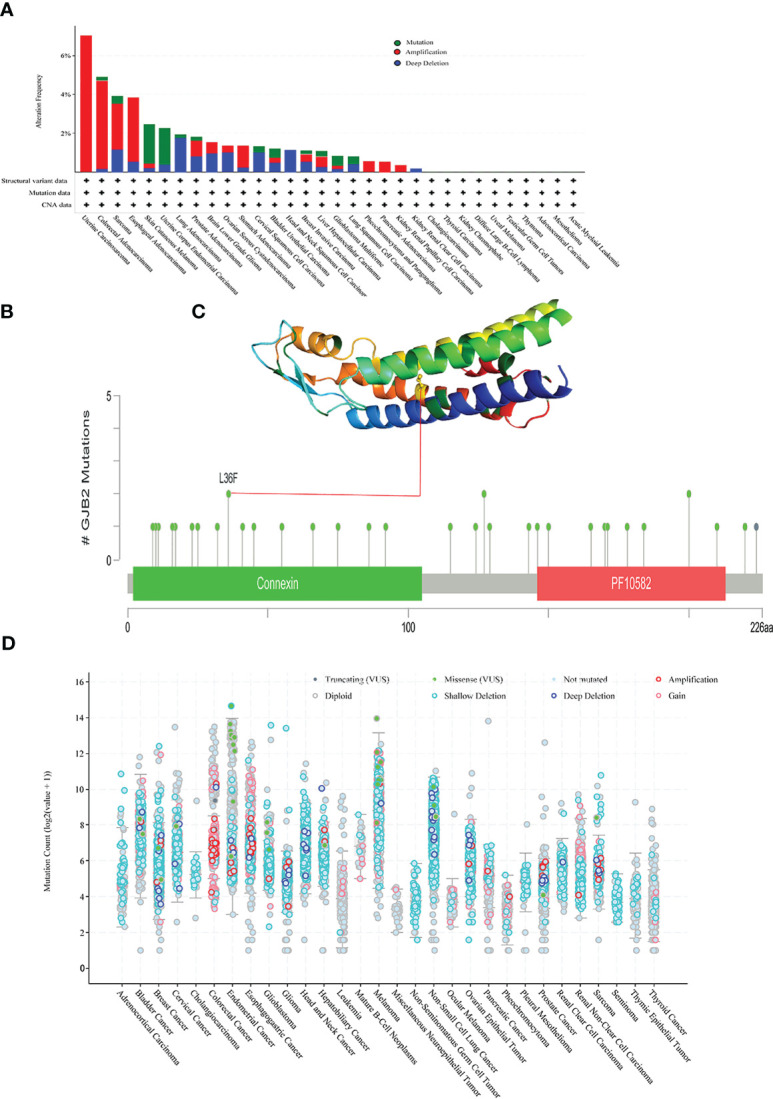
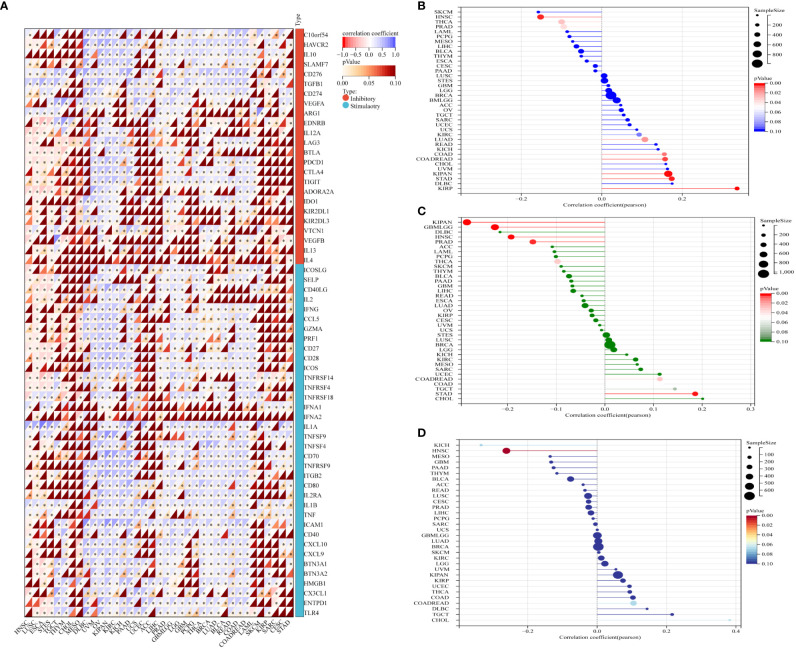
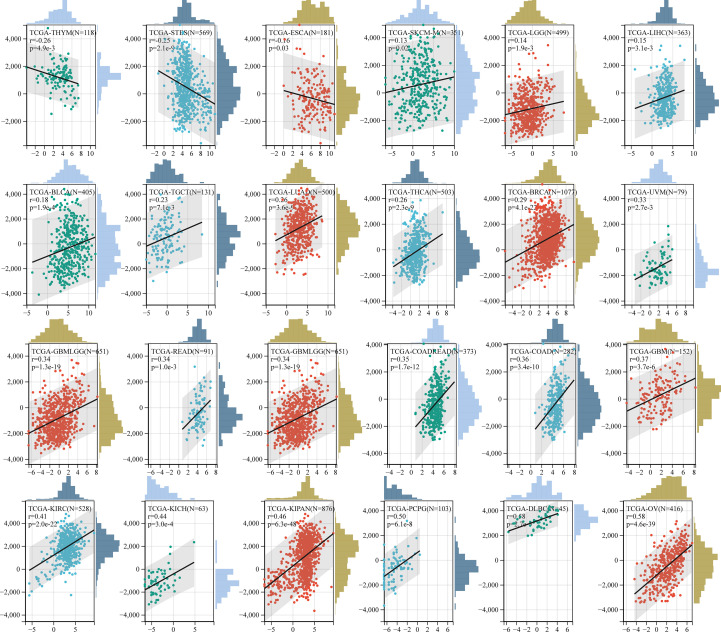
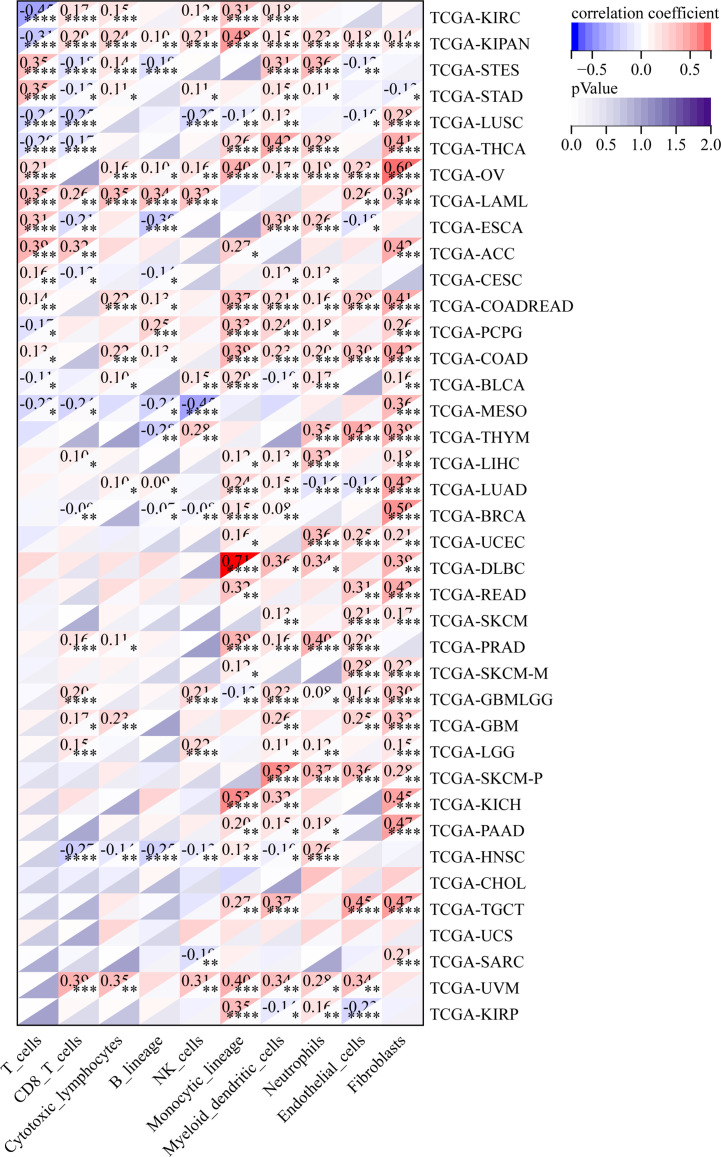
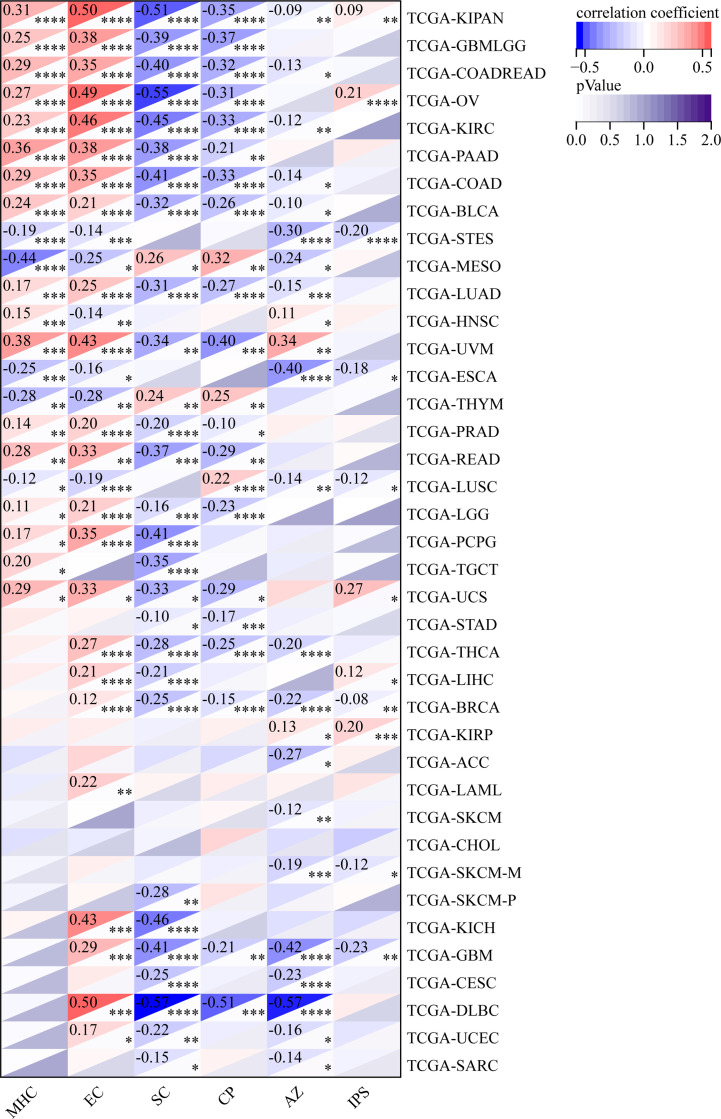
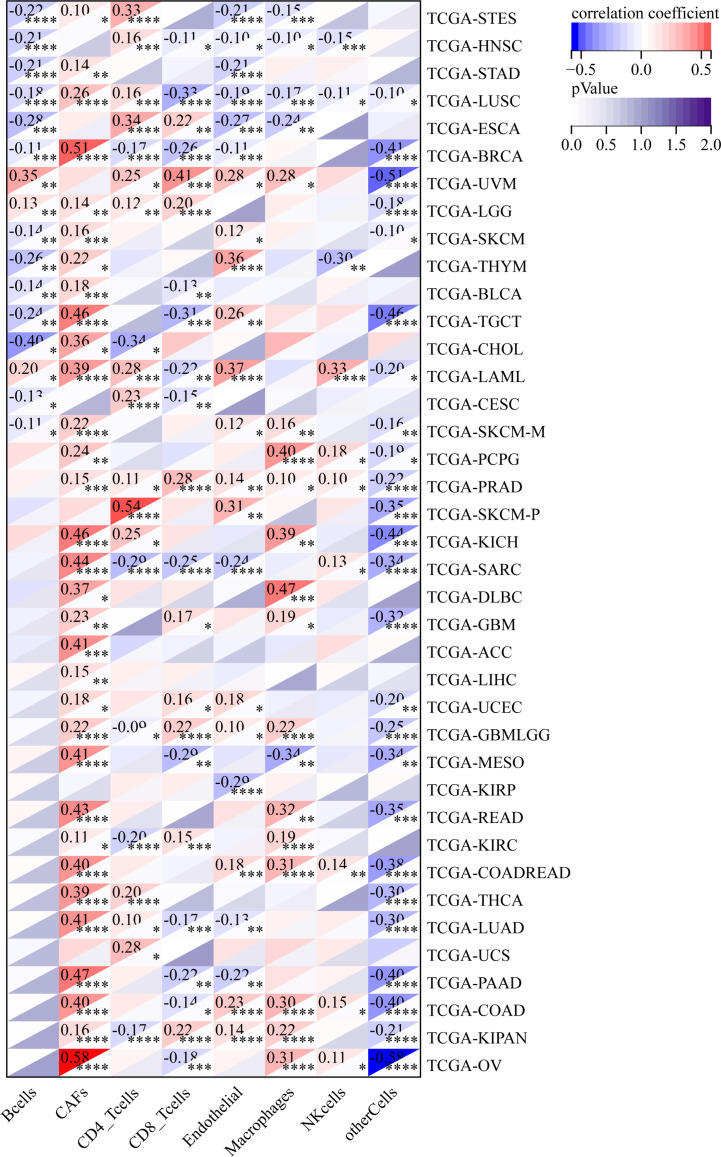
Results: The GJB2 gene was highly expressed in a variety of tumors. Furthermore, GJB2 expression levels showed significant positive or negative association with the survival outcomes in various cancers. GJB2 expression levels cor related with tumor mutational burden, microsatellite instability, neoantigens, and tumor infiltration of immune cells in multiple cancers. This suggested that GJB2 played a critical role in the tumor microenvironment. Functional enrichment analysis showed that the biological role of GJB2 in tumors included modulation of gap junction-mediated intercellular transport, regulation of cell communication by electrical coupling, ion transmembrane transport, autocrine signaling, apoptotic signaling pathway, NOD-like receptor signaling pathway, p53 signaling pathway, and PI3K-Akt signaling pathway.
Conclusions: Our study demonstrated that GJB2 played a significant role in tumorigenesis and tumor immunity in multiple cancers. Furthermore, GJB2 is a potential prognostic biomarker and a promising therapeutic target in multiple types of cancers.
Keywords: ICP; MSI; TMB; immune infiltration; pan-cancer; prognosis.
Copyright © 2023 Jia, Guo, Zhang, Wang, Zhang, Zhang and Li.
Conflict of interest statement
The authors declare that the research was conducted in the absence of any commercial or financial relationships that could be construed as a potential conflict of interest.
Figures
Similar articles
-
YTHDF1 Is a Potential Pan-Cancer Biomarker for Prognosis and Immunotherapy.Front Oncol. 2021 May 6;11:607224. doi: 10.3389/fonc.2021.607224. eCollection 2021. Front Oncol. 2021. PMID: 34026603 Free PMC article.
-
HHLA2 Used as a Potential Prognostic and Immunological Biomarker and Correlated with Tumor Microenvironment in Pan-Cancer.Biomed Res Int. 2022 Feb 23;2022:3924400. doi: 10.1155/2022/3924400. eCollection 2022. Biomed Res Int. 2022. Retraction in: Biomed Res Int. 2024 Mar 20;2024:9789013. doi: 10.1155/2024/9789013. PMID: 35252444 Free PMC article. Retracted.
-
Identification of SHCBP1 as a potential biomarker involving diagnosis, prognosis, and tumor immune microenvironment across multiple cancers.Comput Struct Biotechnol J. 2022 Jun 18;20:3106-3119. doi: 10.1016/j.csbj.2022.06.039. eCollection 2022. Comput Struct Biotechnol J. 2022. PMID: 35782736 Free PMC article.
-
Prognostic significance of Lymphocyte-activation gene 3 (LAG3) in patients with solid tumors: a systematic review, meta-analysis and pan-cancer analysis.Cancer Cell Int. 2023 Dec 2;23(1):306. doi: 10.1186/s12935-023-03157-5. Cancer Cell Int. 2023. PMID: 38041068 Free PMC article. Review.
-
Systems biology and OMIC data integration to understand gastrointestinal cancers.World J Clin Oncol. 2022 Oct 24;13(10):762-778. doi: 10.5306/wjco.v13.i10.762. World J Clin Oncol. 2022. PMID: 36337313 Free PMC article. Review.
Cited by
-
Identification and validation of ion channels-related mRNA prognostic signature for glioblastomas.Medicine (Baltimore). 2024 Nov 29;103(48):e40736. doi: 10.1097/MD.0000000000040736. Medicine (Baltimore). 2024. PMID: 39612412 Free PMC article.
-
Transcriptomic analysis of ROS1+ non-small cell lung cancer reveals an upregulation of nucleotide synthesis and cell adhesion pathways.Front Oncol. 2024 Dec 16;14:1408697. doi: 10.3389/fonc.2024.1408697. eCollection 2024. Front Oncol. 2024. PMID: 39737401 Free PMC article.
-
Targeting GJB4 to inhibit tumor growth and induce ferroptosis in pancreatic cancer.Front Oncol. 2025 Jun 12;15:1585236. doi: 10.3389/fonc.2025.1585236. eCollection 2025. Front Oncol. 2025. PMID: 40575171 Free PMC article.
-
Intercellular cross-talk through lineage-specific gap junction of cancer-associated fibroblasts related to stromal fibrosis and prognosis.Sci Rep. 2023 Aug 30;13(1):14230. doi: 10.1038/s41598-023-40957-1. Sci Rep. 2023. PMID: 37648762 Free PMC article.
-
A retrospective analysis of the clinicopathological features and prognostic value of MAPK12 protein expression in diffuse large B-cell lymphoma.Clin Transl Oncol. 2024 Dec;26(12):2966-2978. doi: 10.1007/s12094-024-03515-3. Epub 2024 May 21. Clin Transl Oncol. 2024. PMID: 38773060 Free PMC article.
References
Publication types
LinkOut - more resources
Full Text Sources
Research Materials
Miscellaneous