

Cell fragmentation in mouse preimplantation embryos induced by ectopic activation of the polar body extrusion pathway
- PMID: 37427462
- PMCID: PMC10476277
- DOI: 10.15252/embj.2023114415
Cell fragmentation in mouse preimplantation embryos induced by ectopic activation of the polar body extrusion pathway
Abstract
Cell fragmentation is commonly observed in human preimplantation embryos and is associated with poor prognosis during assisted reproductive technology (ART) procedures. However, the mechanisms leading to cell fragmentation remain largely unknown. Here, light sheet microscopy imaging of mouse embryos reveals that inefficient chromosome separation due to spindle defects, caused by dysfunctional molecular motors Myo1c or dynein, leads to fragmentation during mitosis. Extended exposure of the cell cortex to chromosomes locally triggers actomyosin contractility and pinches off cell fragments. This process is reminiscent of meiosis, during which small GTPase-mediated signals from chromosomes coordinate polar body extrusion (PBE) by actomyosin contraction. By interfering with the signals driving PBE, we find that this meiotic signaling pathway remains active during cleavage stages and is both required and sufficient to trigger fragmentation. Together, we find that fragmentation happens in mitosis after ectopic activation of actomyosin contractility by signals emanating from DNA, similar to those observed during meiosis. Our study uncovers the mechanisms underlying fragmentation in preimplantation embryos and, more generally, offers insight into the regulation of mitosis during the maternal-zygotic transition.
Keywords: cytoskeleton; meiosis; mitosis; morphogenesis; preimplantation development.
© 2023 The Authors. Published under the terms of the CC BY NC ND 4.0 license.
Conflict of interest statement
The authors declare that they have no conflict of interest.
Figures

- A
Representative image of a Control (left) and Myo1cKO (right) embryo. Top: max projections of embryos stained with Phalloidin (green) and DAPI (gray). Bottom: magnifications at dashed rectangles of Phalloidin (gray) with white arrows pointing at fragments.
- B, C
Number of fragments without DNA (B) per embryo and mean radius (C) in Control (gray) and Myo1cKO (salmon) embryos (left, Control n = 20, Myo1cKO n = 20). Boxplot shows median, upper and lower quartiles, min and max values. Whisker plot shows median, upper and lower quartiles.
- D
Representative images of a time‐lapse of a Myo1cKO embryo undergoing fragmentation outside of division (top) and during division (bottom). Max projections of embryos expressing mTmG (gray) and mCherry‐EB3 (gray) imaged with light sheet microscopy are shown. White arrows point at the forming fragments.
- E
Ratio of fragmentation events during and outside of division (n = 13 cells from 7 embryos).

- A
Mouse single cell RNA sequencing analysis adapted from Deng et al (2014), showing the expression levels of members for the Myosin 1 family at the zygote, 2‐, 4‐, 8‐, 16‐cell, early and late blastocyst stages. Data show mean ± SD of cells at the zygote (n = 4), 2‐ (n = 8), 4‐ (n = 13), 8‐ (n = 19), 16‐cell (n = 57), early (n = 43), and late (n = 28) blastocyst stages.
- B–E
Number of fragments without DNA as a function of the number of cells (B), percentage of fragments containing DNA per embryo (C), percentage of fragments located at the embryo apical surface (D), cell number per embryo (E) in Control (gray) and Myo1cKO (salmon) embryos at E3.5 (Control n = 20, Myo1cKO n = 20) and E4.5 (Control n = 13, Myo1cKO n = 28).
- F
Mean contact angle at maximal compaction (Control n = 11, Myo1cKO n = 39).
- G
Representative image of surface tension measurement.
- H
Surface tension of control (gray, n = 6 embryos, 27 contacts) and Myo1cKO (salmon, n = 6 embryos, 53 contacts) blastomeres as a function of their contact angle. Representative image of tension measurement on a control 8‐cell stage embryo.
- I
Representative images of Control (left) and Myo1cKO (right) embryos at E5.5 stained for Pard6b (yellow), Aqp3 (magenta) and DAPI (gray).
- J
Representative images of Control (left) and Myo1cKO (right) embryos at E5.5 stained for Cdx2 (cyan) Sox2 (red) and Phalloidin (gray).
- K
Sox2 nuclear to cytoplasmic (N/C) ratio as a function of Cdx2 N/C ratio of individual cells in Control (gray, n = 7) and Myo1cKO (salmon, n = 11) embryos.
- L
Cdx2 N/C ratio of cells located at the surface (left) or inside (right) the embryo in Control (n = 8) and Myo1cKO (n = 21) embryos.
- M
Sox2 N/C ratio of cells located at the surface (left) or inside (right) the embryo in Control (n = 11) and Myo1cKO (n = 16) embryos.
- A
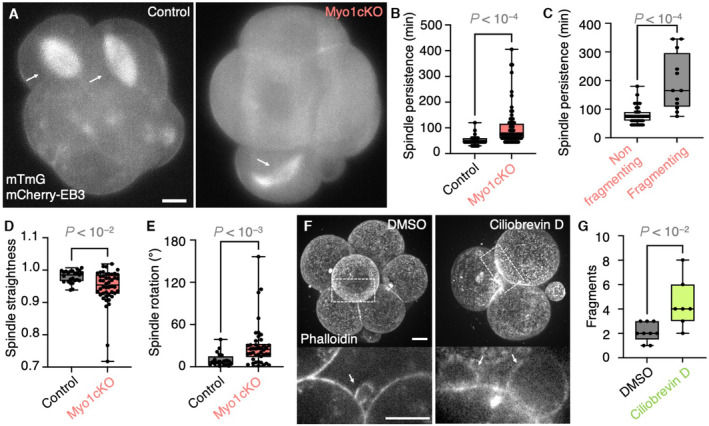
Representative images of Control (left) and Myo1cKO (right) embryos expressing mTmG and mCherry–EB3 (gray) shown as max projections. White arrows indicate the mitotic spindle.
- B, C
Spindle persistence in Control (n = 6) and Myo1cKO (n = 9) embryos (B) and in non‐fragmenting and fragmenting cells of Myo1cKO embryos (C, n = 42 and 12 cells from 7 Myo1cKO embryos). Spindle persistence measures the time from appearance to disassembly of the spindle.
- D, E
Spindle straightness (D) and rotation (E) in Control (n = 6) and Myo1cKO (n = 9) embryos. Straightness reports the pole to pole distance of the spindle divided by its continuous length. Rotation describes the angle between the initial orientation of the spindle pole and its maximal deviation in 2D.
- F
Representative images of embryos treated with DMSO (left) and 37.5 μM Ciliobrevin D (right), stained with Phalloidin. Top: Maximum projection. Bottom: magnifications of a single plane at dashed rectangles of Phalloidin with white arrows pointing at fragments.
- G
Number of fragments without DNA per embryo in DMSO (gray) and Ciliobrevin D (honeydew) embryos at E2.5 (left, Control n = 9, Myo1cKO n = 7).
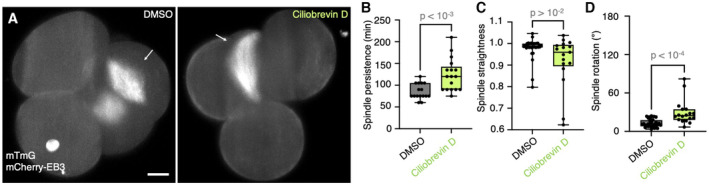
- A
Representative images of DMSO (left) and Ciliobrevin D (right) treated embryos expressing mTmG and mCherry–EB3 (gray) shown as max projections. White arrows indicate the mitotic spindle. Scale bar, 10 μm.
- B–D
Spindle persistence (B), straightness (C) and rotation (D) in DMSO (n = 11) and Ciliobrevin D (n = 11) treated embryos. Persistence measures the time from appearance to disassembly of the spindle. Straightness reports the pole to pole distance of the spindle divided by its continuous length. Rotation describes the angle between the initial orientation of the spindle pole and its maximal deviation in 2D.
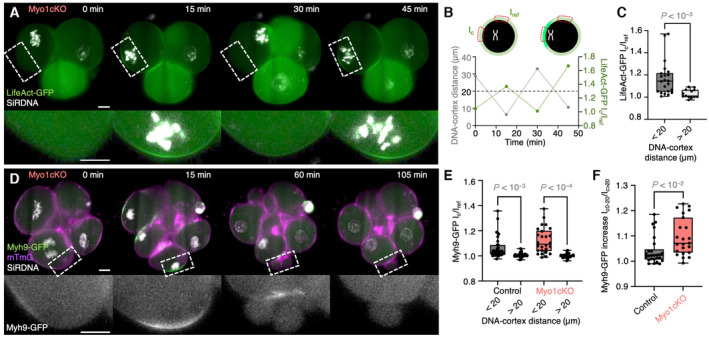
- A
Top: Representative images of a time‐lapse of a Myo1cKO embryo labeled with LifeAct–GFP (green) and SiRDNA (gray) with one blastomere undergoing mitosis shown as max projections. Bottom: magnifications of dashed rectangles.
- B
In Myo1cKO embryo shown in (A) LifeAct–GFP intensities at the cortex region of eventual contact with DNA (Ic) are normalized to the intensity at a reference region (Iref). LifeAct–GFP Ic/Iref values (green) are plotted over time. The DNA‐cortex distance (gray) between the region of eventual contact and the center of the DNA signal is also measured. A threshold distance of 20 μm is indicated with a dashed line.
- C
LifeAct‐GFP Ic/Iref values at DNA‐cortex distances < 20 and > 20 μm (Myo1cKO embryos n = 13, cells n = 21).
- D
Top: Representative images of a time‐lapse of a Myo1cKO embryo expressing Myh9–GFP (green) and mTmG (magenta) while labeled with SiRDNA (gray) undergoing fragmentation during mitosis shown as max projections. Bottom: magnifications of Myh9‐GFP (gray) at dashed rectangles showing cortical accumulation (middle) followed by fragmentation (right).
- E
Control (gray) and Myo1cKO (salmon) embryos Myh9–GFP Ic/Iref values at DNA‐cortex distances < 20 and > 20 μm (Control embryos n = 10, cells n = 35; Myo1cKO embryos n = 9, cells n = 26).
- F
Comparison of the increase in Myh9–GFP intensity in Control and Myo1cKO embryos when DNA is in close proximity to the cortex. The ratio Ic0‐20/Ic > 20 is calculated from Myh9–GFP intensities at the contact region when DNA‐cortex distances are < 20 μm (Ic0‐20) divided by intensities when distances are > 20 μm (Ic > 20; Control embryos n = 10, cells n = 33; Myo1cKO embryos n = 9, cells n = 26).
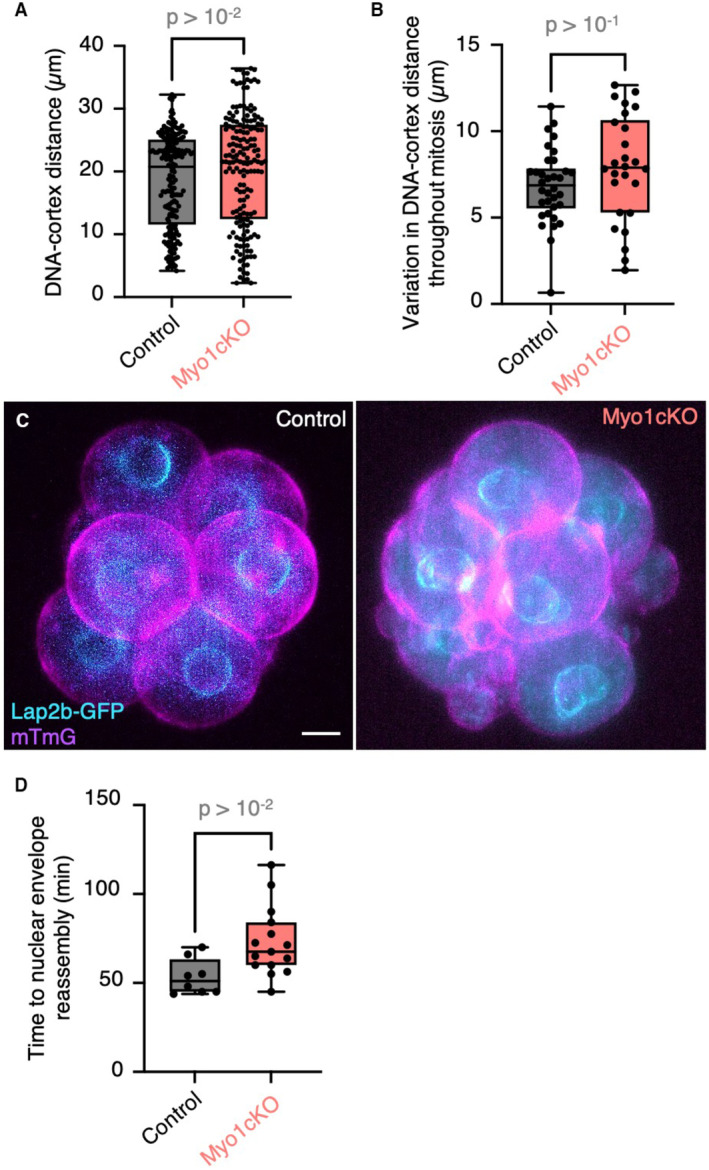
- A, B
Measured distance between the DNA visualized with SiRDNA or H2B‐mCherry and the cell cortex (A) and standard deviation of this distance throughout division (B) for Control (n = 10) and Myo1cKO embryos (n = 9).
- C
Representative images of Control (left) and Myo1cKO (right) embryos expressing mTmG (magenta) and Lap2b–GFP (cyan).
- D
Comparison of the time from nuclear envelope breakdown to its reassembly between Control (n = 8) and Myo1cKO embryos (n = 15).

Representative images of Control (left) and Myo1cKO (right) embryos labeled with SiRDNA (gray) and expressing a reporter of Cdc42 activity (yellow) in one blastomere, which is undergoing mitosis, shown as max projections. The second blastomere is outlined with a dashed line. White arrows point at the accumulation of active Cdc42 at the cortex in close proximity to DNA.
The ratio of active Cdc42 Ic/Iref was compared between < 20 and 20 μm DNA‐cortex distances for Control (dark yellow) and Myo1cKO (yellow) embryos (Control embryos n = 10; Myo1cKO embryos n = 10).
Representative images of Myo1cKO embryos expressing LifeAct–GFP (green) alone (left) or together with dominant negative Cdc42 (DNCdc42, right) labeled with SiRDNA (gray) shown as max projections. White arrows point at the cortex in close proximity to DNA.
LifeAct–GFP Ic/Iref values at DNA‐cortex distances < 20 and > 20 μm for Myo1cKO (salmon) and Myo1cKO + DNCdc42 (yellow) embryos (Myo1cKO embryos n = 8, cells n = 19; Myo1cKO + DNCdc42 embryos n = 12, cells n = 30).
Representative images of a GFP (left) and Ect2–GFP (right) expressing embryo stained with Phalloidin (green) and DAPI (gray) shown as max projections. White arrows indicate fragments.
Number of fragments without DNA per embryo in GFP (gray) and Ect2–GFP (blue) embryos (GFP n = 14; Ect2–GFP n = 18).

Representative images of GFP (top, blue) and Ect2–GFP (bottom, blue) expressing embryos during mitosis labeled with LifeAct‐RFP (green) and SiRDNA (white) shown as max projections. Scale bar, 10 μm.
LifeAct–RFP Ic/Iref ratio compared between DNA‐cortex distances < 20 and > 20 μm for GFP (gray) and Ect2–GFP (blue) embryos (GFP embryos n = 7, cells n = 26; Ect2‐GFP embryos n = 9, cells n = 26).
Surface tension of 4‐cell stage embryos in Control (gray) and Ect2–GFP (blue) embryos (Control n = 8; Ect2–GFP n = 12).

Similar articles
-
CDCA8 regulates meiotic spindle assembly and chromosome segregation during human oocyte meiosis.Gene. 2020 May 30;741:144495. doi: 10.1016/j.gene.2020.144495. Epub 2020 Feb 20. Gene. 2020. PMID: 32088244
-
A casein kinase 1 prevents expulsion of the oocyte meiotic spindle into a polar body by regulating cortical contractility.Mol Biol Cell. 2017 Sep 1;28(18):2410-2419. doi: 10.1091/mbc.E17-01-0056. Epub 2017 Jul 12. Mol Biol Cell. 2017. PMID: 28701347 Free PMC article.
-
Microtubules oppose cortical actomyosin-driven membrane ingression during C. elegans meiosis I polar body extrusion.PLoS Genet. 2023 Oct 2;19(10):e1010984. doi: 10.1371/journal.pgen.1010984. eCollection 2023 Oct. PLoS Genet. 2023. PMID: 37782660 Free PMC article.
-
The chromosomal basis of meiotic acentrosomal spindle assembly and function in oocytes.Chromosoma. 2017 Jun;126(3):351-364. doi: 10.1007/s00412-016-0618-1. Epub 2016 Nov 11. Chromosoma. 2017. PMID: 27837282 Free PMC article. Review.
-
Actin filaments: key players in the control of asymmetric divisions in mouse oocytes.Biol Cell. 2009 Feb;101(2):69-76. doi: 10.1042/BC20080003. Biol Cell. 2009. PMID: 19076067 Review.
Cited by
-
Measuring the forces that shape early human embryos.Nature. 2024 May 30. doi: 10.1038/d41586-024-01556-w. Online ahead of print. Nature. 2024. PMID: 38816474 No abstract available.
-
Getting there in one piece: The Rac pathway prevents cell fragmentation in a nonprotrusively migrating leader cell during organogenesis.bioRxiv [Preprint]. 2023 Dec 4:2023.12.01.569642. doi: 10.1101/2023.12.01.569642. bioRxiv. 2023. Update in: Curr Biol. 2024 Jun 3;34(11):2387-2402.e5. doi: 10.1016/j.cub.2024.04.073. PMID: 38106045 Free PMC article. Updated. Preprint.
-
MRCK activates mouse oocyte myosin II for spindle rotation and male pronucleus centration.J Cell Biol. 2023 Nov 6;222(11):e202211029. doi: 10.1083/jcb.202211029. Epub 2023 Aug 31. J Cell Biol. 2023. PMID: 37651121 Free PMC article.
-
The Rac pathway prevents cell fragmentation in a nonprotrusively migrating leader cell during C. elegans gonad organogenesis.Curr Biol. 2024 Jun 3;34(11):2387-2402.e5. doi: 10.1016/j.cub.2024.04.073. Epub 2024 May 21. Curr Biol. 2024. PMID: 38776905 Free PMC article.
References
-
- Abe T, Kiyonari H, Shioi G, Inoue K, Nakao K, Aizawa S, Fujimori T (2011) Establishment of conditional reporter mouse lines at ROSA26 locus for live cell imaging. Genesis 49: 579–590 - PubMed
-
- Alikani M (1999) Human embryo fragmentation in vitro and its implications for pregnancy and implantation. Fertil Steril 71: 836–842 - PubMed
-
- Alikani M (2007) The origins and consequences of fragmentation in mammalian eggs and embryos. In Human Preimplantation Embryo Selection, Cohen J, Elder K (eds), pp 51–78. Boca Raton, FL: CRC Press;
Publication types
MeSH terms
Substances
LinkOut - more resources
Full Text Sources
