Mining for a new class of fungal natural products: the evolution, diversity, and distribution of isocyanide synthase biosynthetic gene clusters
- PMID: 37427794
- PMCID: PMC10415135
- DOI: 10.1093/nar/gkad573
Mining for a new class of fungal natural products: the evolution, diversity, and distribution of isocyanide synthase biosynthetic gene clusters
Abstract
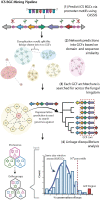
The products of non-canonical isocyanide synthase (ICS) biosynthetic gene clusters (BGCs) mediate pathogenesis, microbial competition, and metal-homeostasis through metal-associated chemistry. We sought to enable research into this class of compounds by characterizing the biosynthetic potential and evolutionary history of these BGCs across the Fungal Kingdom. We amalgamated a pipeline of tools to predict BGCs based on shared promoter motifs and located 3800 ICS BGCs in 3300 genomes, making ICS BGCs the fifth largest class of specialized metabolites compared to canonical classes found by antiSMASH. ICS BGCs are not evenly distributed across fungi, with evidence of gene-family expansions in several Ascomycete families. We show that the ICS dit1/2 gene cluster family (GCF), which was prior only studied in yeast, is present in ∼30% of all Ascomycetes. The dit variety ICS exhibits greater similarity to bacterial ICS than other fungal ICS, suggesting a potential convergence of the ICS backbone domain. The evolutionary origins of the dit GCF in Ascomycota are ancient and these genes are diversifying in some lineages. Our results create a roadmap for future research into ICS BGCs. We developed a website (https://isocyanides.fungi.wisc.edu/) that facilitates the exploration and downloading of all identified fungal ICS BGCs and GCFs.
Published by Oxford University Press on behalf of Nucleic Acids Research 2023.
Figures


Update of
-
Mining for a New Class of Fungal Natural Products: The Evolution, Diversity, and Distribution of Isocyanide Synthase Biosynthetic Gene Clusters.bioRxiv [Preprint]. 2023 Apr 18:2023.04.17.537281. doi: 10.1101/2023.04.17.537281. bioRxiv. 2023. Update in: Nucleic Acids Res. 2023 Aug 11;51(14):7220-7235. doi: 10.1093/nar/gkad573. PMID: 37131656 Free PMC article. Updated. Preprint.
Similar articles
-
Mining for a New Class of Fungal Natural Products: The Evolution, Diversity, and Distribution of Isocyanide Synthase Biosynthetic Gene Clusters.bioRxiv [Preprint]. 2023 Apr 18:2023.04.17.537281. doi: 10.1101/2023.04.17.537281. bioRxiv. 2023. Update in: Nucleic Acids Res. 2023 Aug 11;51(14):7220-7235. doi: 10.1093/nar/gkad573. PMID: 37131656 Free PMC article. Updated. Preprint.
-
Fungal Isocyanide Synthases and Xanthocillin Biosynthesis in Aspergillus fumigatus.mBio. 2018 May 29;9(3):e00785-18. doi: 10.1128/mBio.00785-18. mBio. 2018. PMID: 29844112 Free PMC article.
-
An interpreted atlas of biosynthetic gene clusters from 1,000 fungal genomes.Proc Natl Acad Sci U S A. 2021 May 11;118(19):e2020230118. doi: 10.1073/pnas.2020230118. Proc Natl Acad Sci U S A. 2021. PMID: 33941694 Free PMC article.
-
Computational strategies for genome-based natural product discovery and engineering in fungi.Fungal Genet Biol. 2016 Apr;89:29-36. doi: 10.1016/j.fgb.2016.01.006. Epub 2016 Jan 13. Fungal Genet Biol. 2016. PMID: 26775250 Review.
-
Context matters: assessing the impacts of genomic background and ecology on microbial biosynthetic gene cluster evolution.mSystems. 2025 Mar 18;10(3):e0153824. doi: 10.1128/msystems.01538-24. Epub 2025 Feb 24. mSystems. 2025. PMID: 39992097 Free PMC article. Review.
Cited by
-
Lichens are a treasure chest of bioactive compounds: fact or fake?New Phytol. 2025 Apr;246(2):389-395. doi: 10.1111/nph.70034. Epub 2025 Feb 27. New Phytol. 2025. PMID: 40013383 Free PMC article. No abstract available.
-
Conserved copper regulation of the antimicrobial isocyanide brassicicolin A in Alternaria brassicicola.Fungal Genet Biol. 2023 Dec;169:103839. doi: 10.1016/j.fgb.2023.103839. Epub 2023 Sep 12. Fungal Genet Biol. 2023. PMID: 37709127 Free PMC article.
-
Harboring Starships: The Accumulation of Large Horizontal Gene Transfers in Domesticated and Pathogenic Fungi.Genome Biol Evol. 2025 Jul 3;17(7):evaf125. doi: 10.1093/gbe/evaf125. Genome Biol Evol. 2025. PMID: 40579721 Free PMC article.
-
A glimpse into the fungal metabolomic abyss: Novel network analysis reveals relationships between exogenous compounds and their outputs.PNAS Nexus. 2023 Sep 29;2(10):pgad322. doi: 10.1093/pnasnexus/pgad322. eCollection 2023 Oct. PNAS Nexus. 2023. PMID: 37854706 Free PMC article.
-
Comparative genomics of Metarhizium brunneum strains V275 and ARSEF 4556: unraveling intraspecies diversity.G3 (Bethesda). 2024 Oct 7;14(10):jkae190. doi: 10.1093/g3journal/jkae190. G3 (Bethesda). 2024. PMID: 39210673 Free PMC article.
References
-
- Keller N.P., Turner G., Bennett J.W.. Fungal secondary metabolism - from biochemistry to genomics. Nat. Rev. Microbiol. 2005; 3:937–947. - PubMed
-
- López-Gresa M.P., González M.C., Ciavatta L., Ayala I., Moya P., Primo J.. Insecticidal activity of paraherquamides, including paraherquamide H and paraherquamide I, two new alkaloids isolated from Penicillium cluniae. J. Agric. Food. Chem. 2006; 54:2921–2925. - PubMed
-
- Balba H. Review of strobilurin fungicide chemicals. J. Environ. Sci. Health B. 2007; 42:441–451. - PubMed
Publication types
MeSH terms
Substances
Grants and funding
LinkOut - more resources
Full Text Sources
Medical

